
- Dogecoin has two key liquidity pockets nearby that could decide its next trend.
- The lack of social media enthusiasm need not be a cause for concern for investors right now.
Dogecoin [DOGE] saw muted social sentiment in the past few weeks. Social media engagement was falling, and user activity declined alongside the prices.
There was evidence of Dogecoin whales going long in the Futures market.
The meme coin could explode and reach a new ATH a year after the previous halving. Investors would be hoping for a repeat of that. Things need to change for the bulls to establish an uptrend shortly.
DOGE has not seen a bullish performance on par with the other meme coins. For example, at press time, its 7-day gains only measured 4.1% compared to Shiba Inu’s [SHIB] 20% or Pepe’s [PEPE] 53%.
Social metrics were not kind to DOGE
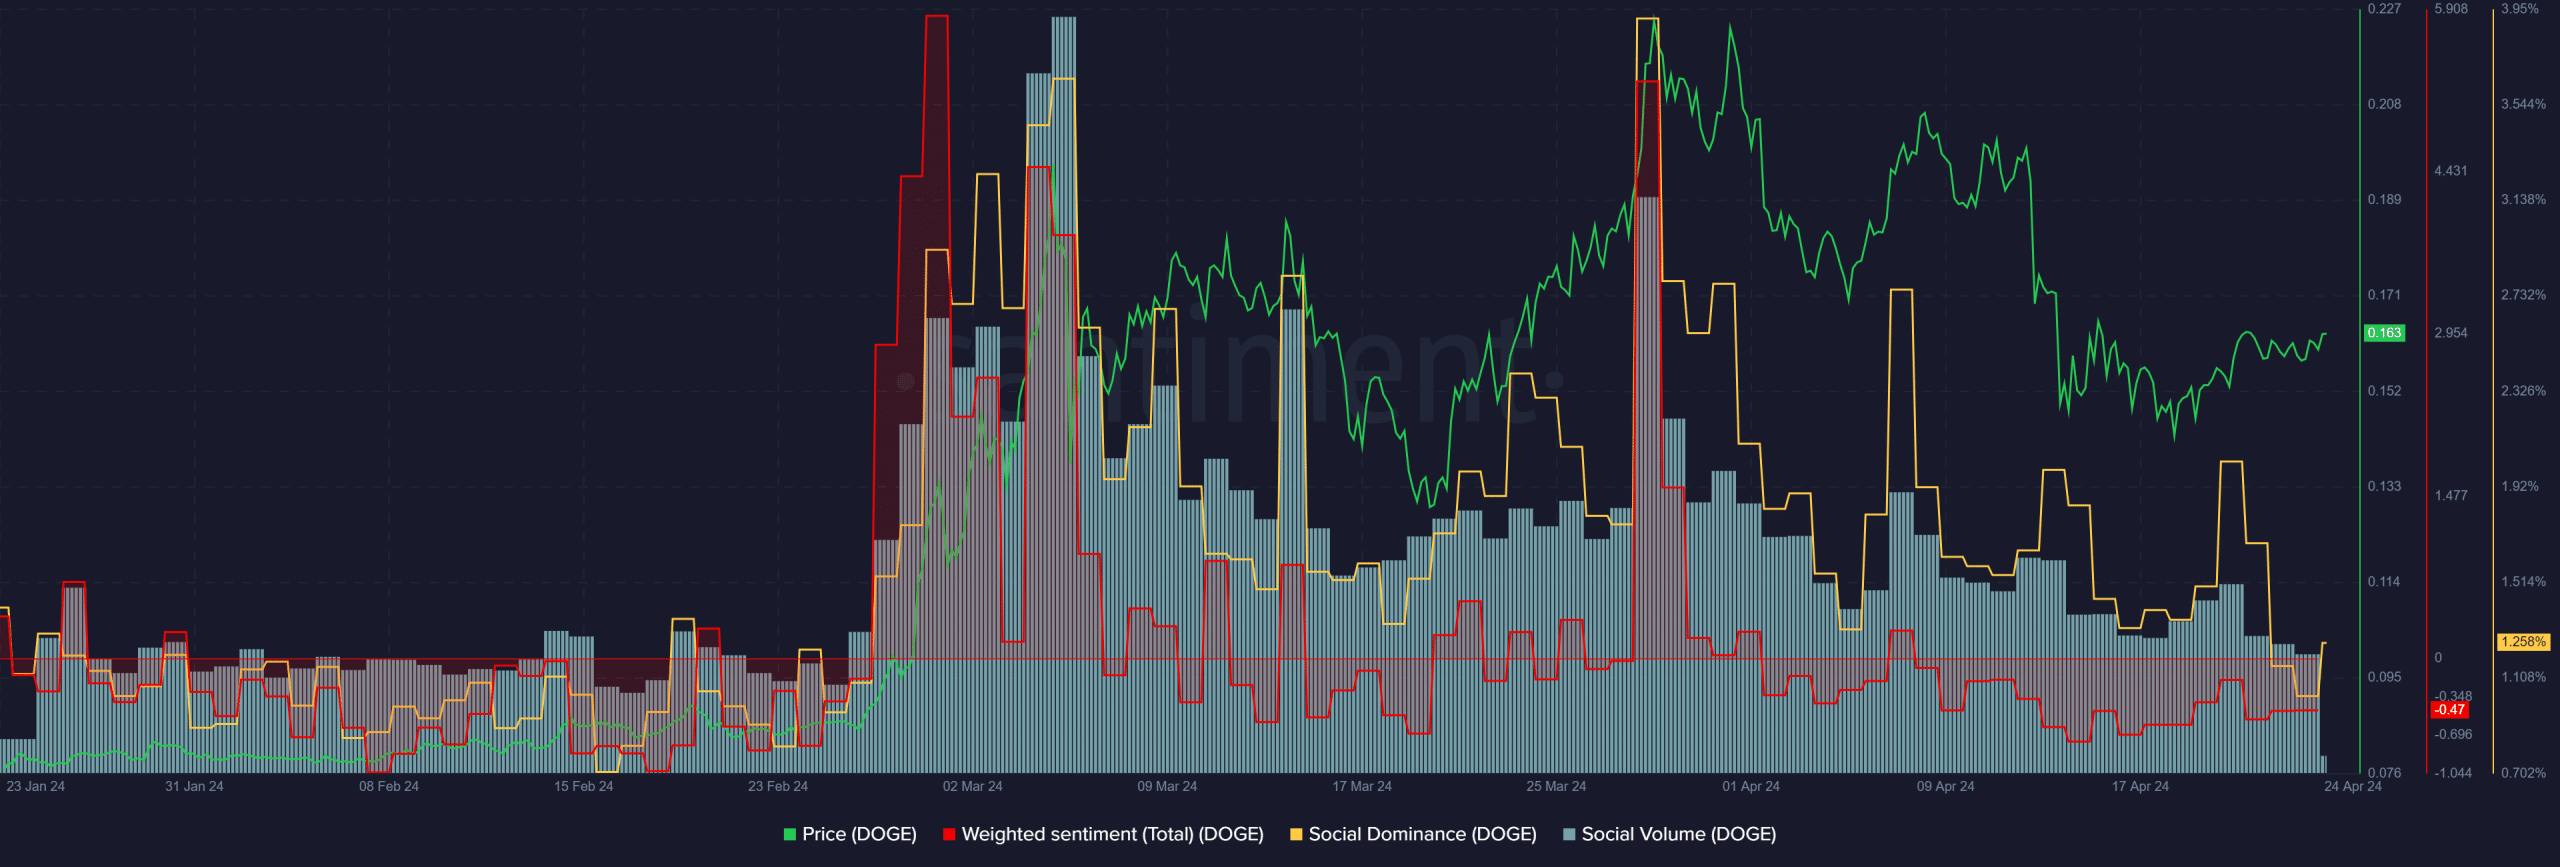
Source: Santiment
The price of Dogecoin has been in decline since the 30th of March. It began to trend downward after retesting the $0.2 mark as resistance on the 8th of April.
This downward move was accompanied by a steady decline in social volume.
Social volume is the number of mentions of a token on crypto social media channels tracked by Santiment. Inasmuch, the Weighted Sentiment has been negative throughout April.
This signaled negative engagement for DOGE on social media in recent weeks.
Additionally, Social Dominance trended strongly downward since the final week of March. The strong price surge past $0.2 a month ago saw Dogecoin take up 2.8% of total crypto-related mentions of popular projects.
The falling dominance was another strong sign that interest in the meme coin has cooled for now. This could change with the lower timeframe price trend.
DOGE holders steady the ship but were not profitable
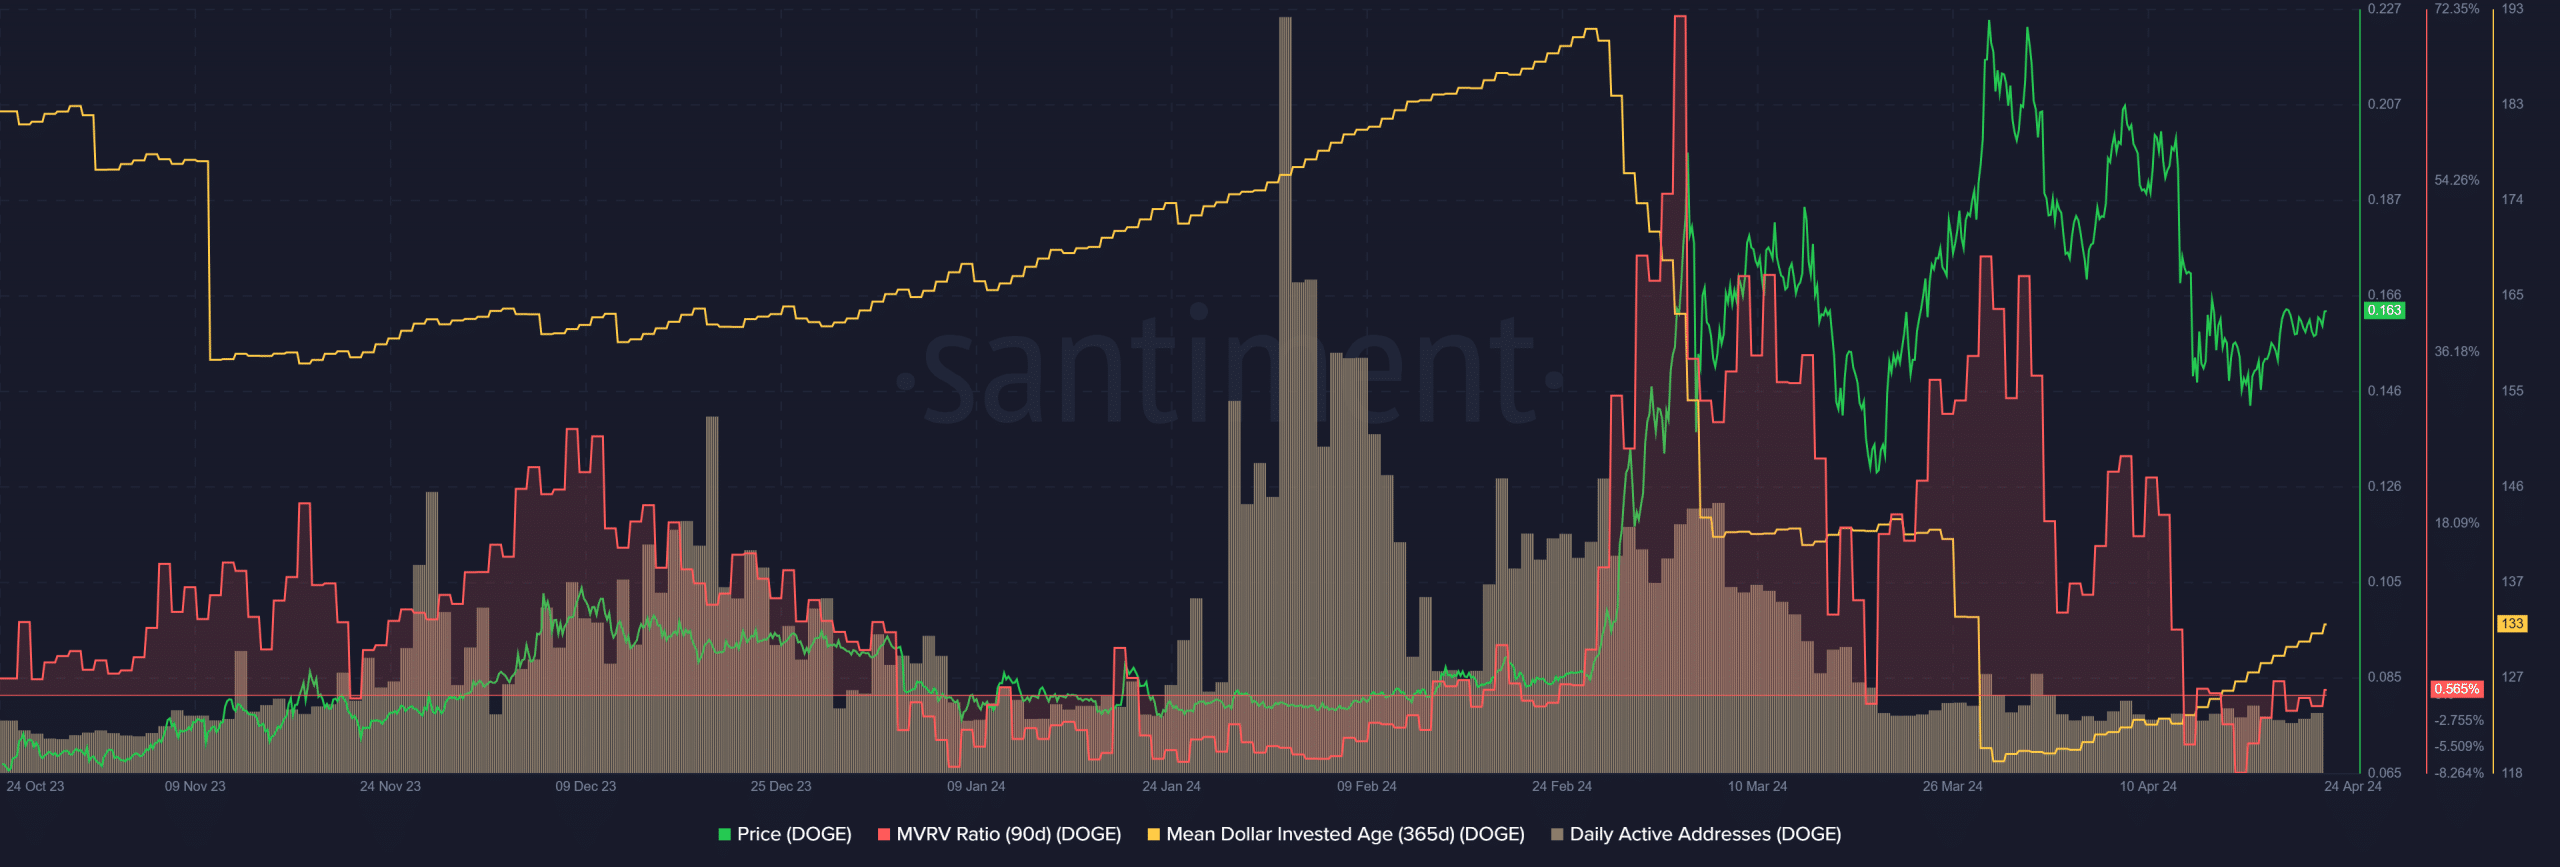
Source: Santiment
The mean dollar invested age dropped enormously in February and March alongside rising prices.
In April, the metric began to climb higher. This was a sign of accumulation among the DOGE holders. Additionally, the 90-day MVRV fell below 0 but managed to recover. It was at +0.565% at press time.
Together, the MDIA and MVRV metrics flashed a strong buy signal for Dogecoin. However, the daily active addresses metric continued to fall over the past month.
This was an indication of reduced interaction from users and therefore lower demand for the meme token.
The liquidity overhead could pose a significant obstacle
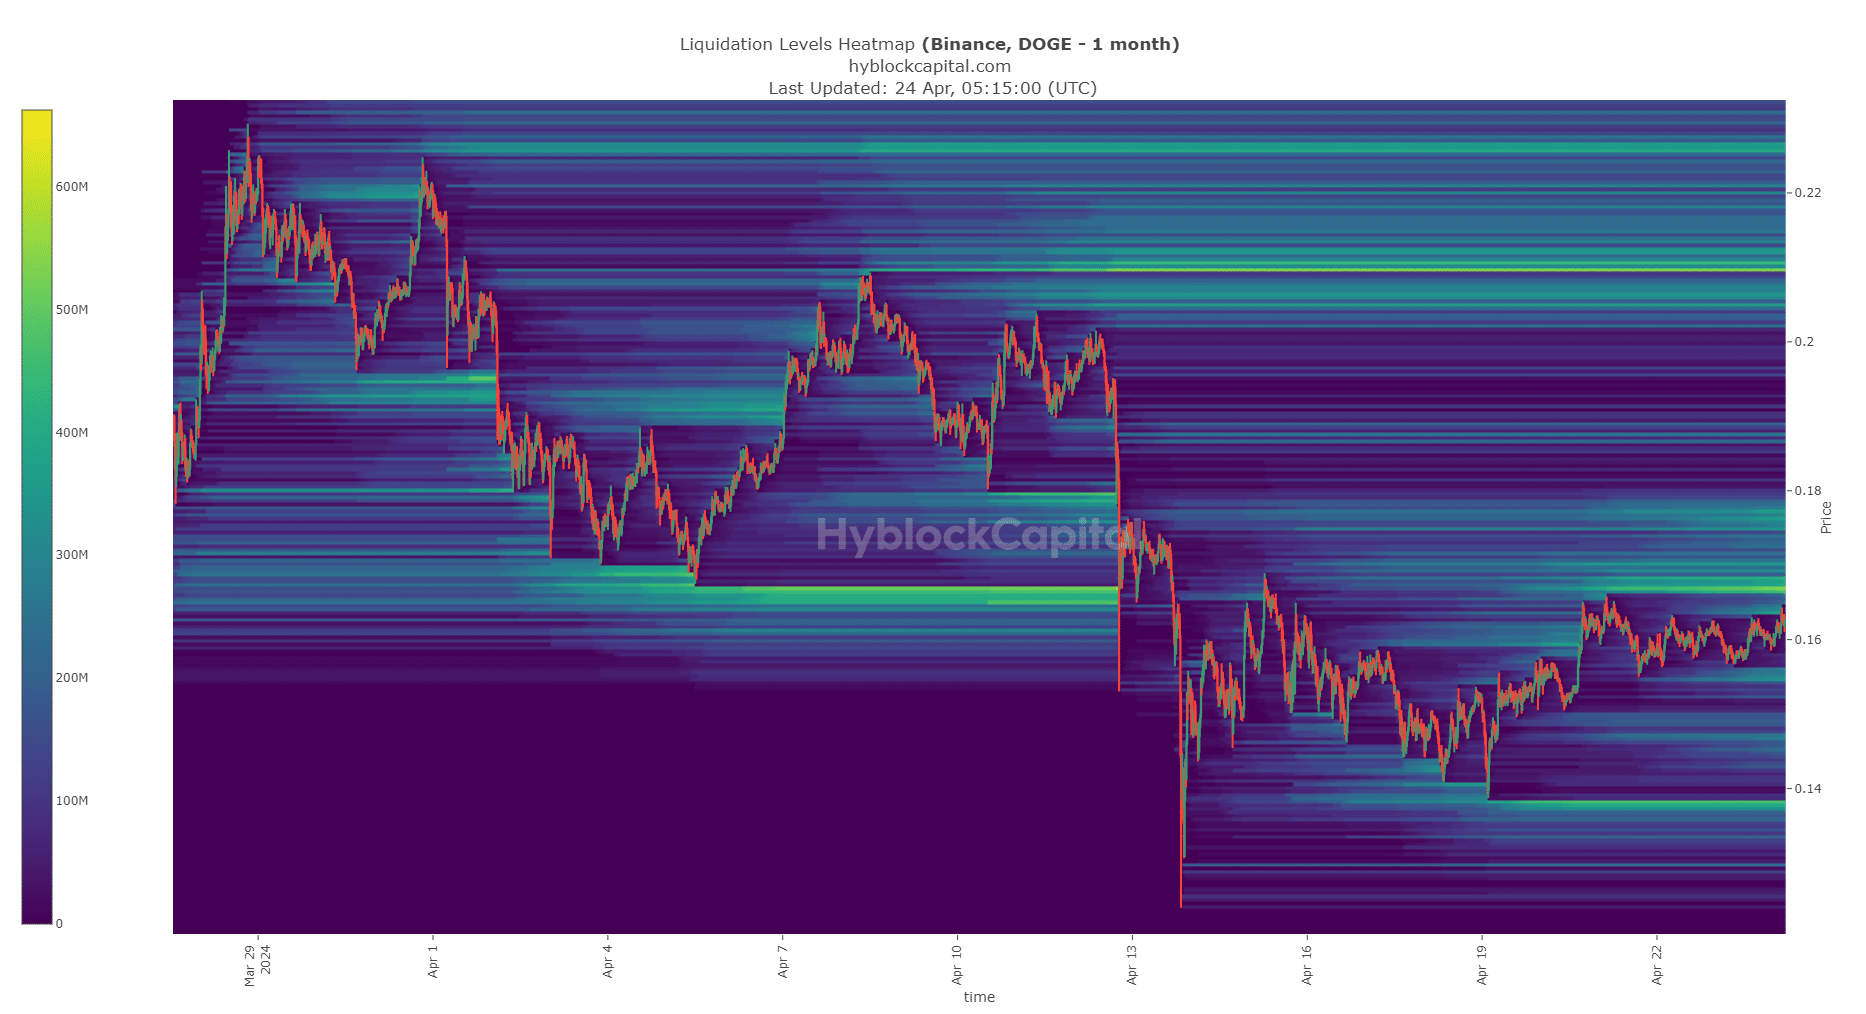
Source: Hyblock
The liquidation heatmap with a look-back period of a month showed that prices were just beneath an important pocket of liquidity. The $0.166-$0.168 region has been a resistance zone for close to ten days now.
This meant that a considerable amount of liquidation levels had built up above them. A price move into this zone would trigger short liquidations.
Their forced market buys upon liquidation would see prices surge higher in the short term.
Similarly, the $0.155 zone also witnessed a decent chunk of liquidity build-up below it in the past week. This was from bullish speculators. Further south, the $0.136-$0.138 lows were also an area of interest.
It was possible that the Dogecoin price would take a bearish path after sweeping the liquidity in the $0.17 region.
This would indicate a move toward $0.155, and possibly as deep as $0.136 in the coming days and weeks.
Hence, despite the buy signal that the on-chain metrics flashed, it would be more prudent for swing traders and investors to wait.
A positive reaction from Dogecoin such as flipping the $0.17-$0.18 region to support would pose less risk to investors looking to buy the meme coin.
Using technical analysis to explore a buying opportunity
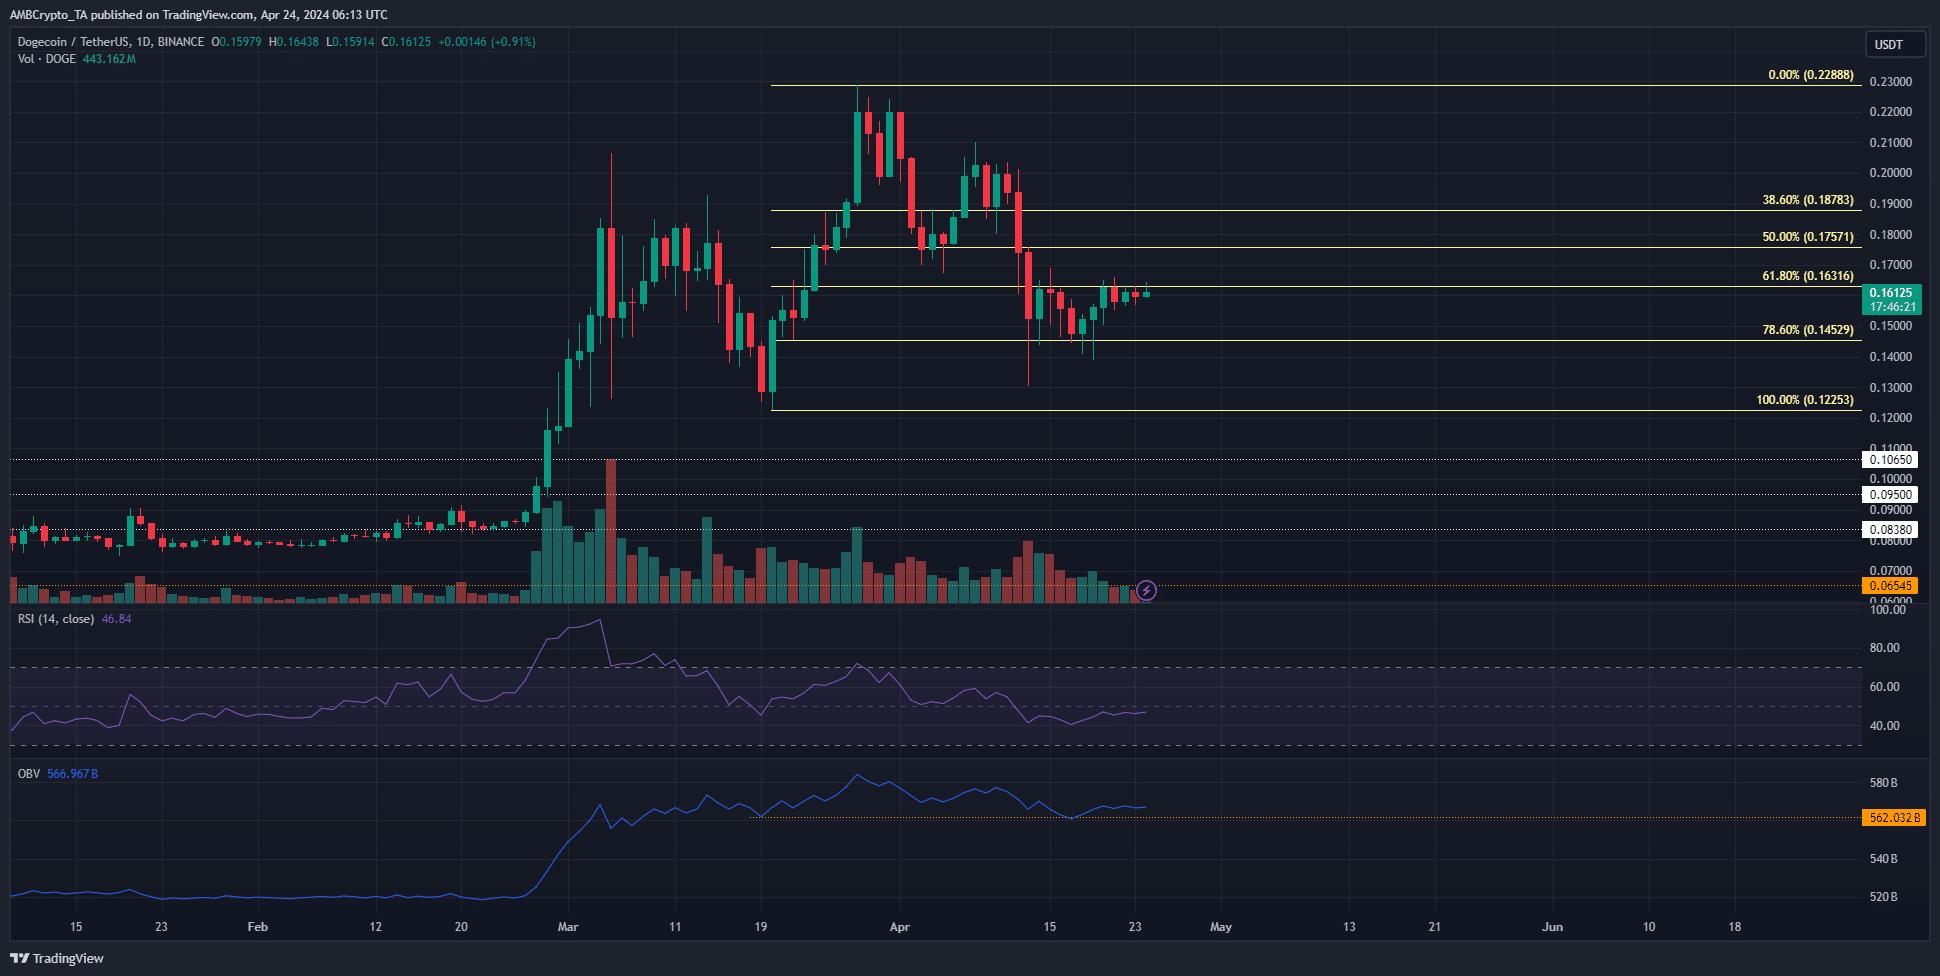
Source: DOGE/USDT on TradingView
The 1-day price chart showed that the uptrend was still intact. Additionally, the 78.6% Fibonacci retracement level (pale yellow) was also defended during the recent price plunge.
While the RSI was below neutral 50 to highlight bearish momentum, it was at 46.8. This value does not signify strong downward momentum. Additionally, the OBV was also above a support level from mid-March.
The findings from the OBV were encouraging and showed that selling pressure was intense but not yet dominant on the higher timeframes.
As mentioned earlier, the lower timeframe trend was bearish after the retest of $0.2 as resistance.
To change this bearish bias, the $0.163-$0.17 region has to be flipped to support. The $0.175 level is also a short-term resistance. It tied in well with the findings from the liquidation heatmap chart.
Read Dogecoin’s [DOGE] Price Prediction 2024-25
In conclusion, the long-term bias of Dogecoin remained bullish. The on-chain metrics gave a buy signal, despite uninspiring social media activity.
The short-term resistance at $0.175 must be scaled for swing traders to gain a bullish conviction on DOGE. The next target would be the $0.2 resistance.