
- ETH wants to break above resistance.
- The bulls supported the coin’s uptrend with a number of markers spotted on a daily chart.
Leading altcoin Ethereum [ETH] is poised to breach the upper line of its descending channel, suggesting a decline in selling pressure.
At $3,100 at press time, the coin’s value has risen by almost 10% in the last week, according to CoinMarketCap. This growth mirrored the uptick in the general crypto market in the last seven days.
According to CoinGecko, global cryptocurrency market capitalization has surged by 9% during that period.
Will ETH make it?
A descending channel is formed when an asset’s price continues to make lower highs and lower lows, indicating a broader downward trend.
ETH began to trend within this channel on the 12th of March, causing its price to decline by 20% since then.
With the coin making its way toward the upper line of the channel, which has formed a resistance level since March, the market witnessed a surge in new liquidity inflow.
Confirming this was ETH’s Chaikin Money Flow, which recently crossed above the zero line and was in an uptrend at press time. This indicator measures the flow of money into and out of the coin’s market.
When an asset’s CMF climbs this way, it suggests more buying pressure than selling pressure in the market. This is often due to the asset’s price making new highs because of a surge in trading volume.
In the last seven days, ETH’s daily trading volume has risen by 40%, per Santiment’s data.
Signaling the rise in bullish presence, ETH’s positive directional index (green) crossed above its negative index (red) on the 17th of May.
Such readings made from an asset’s Directional Movement Index (DMI) indicate a bullish rise in the market.
Further, the value of the coin’s Elder-Ray Index was positive at press time.
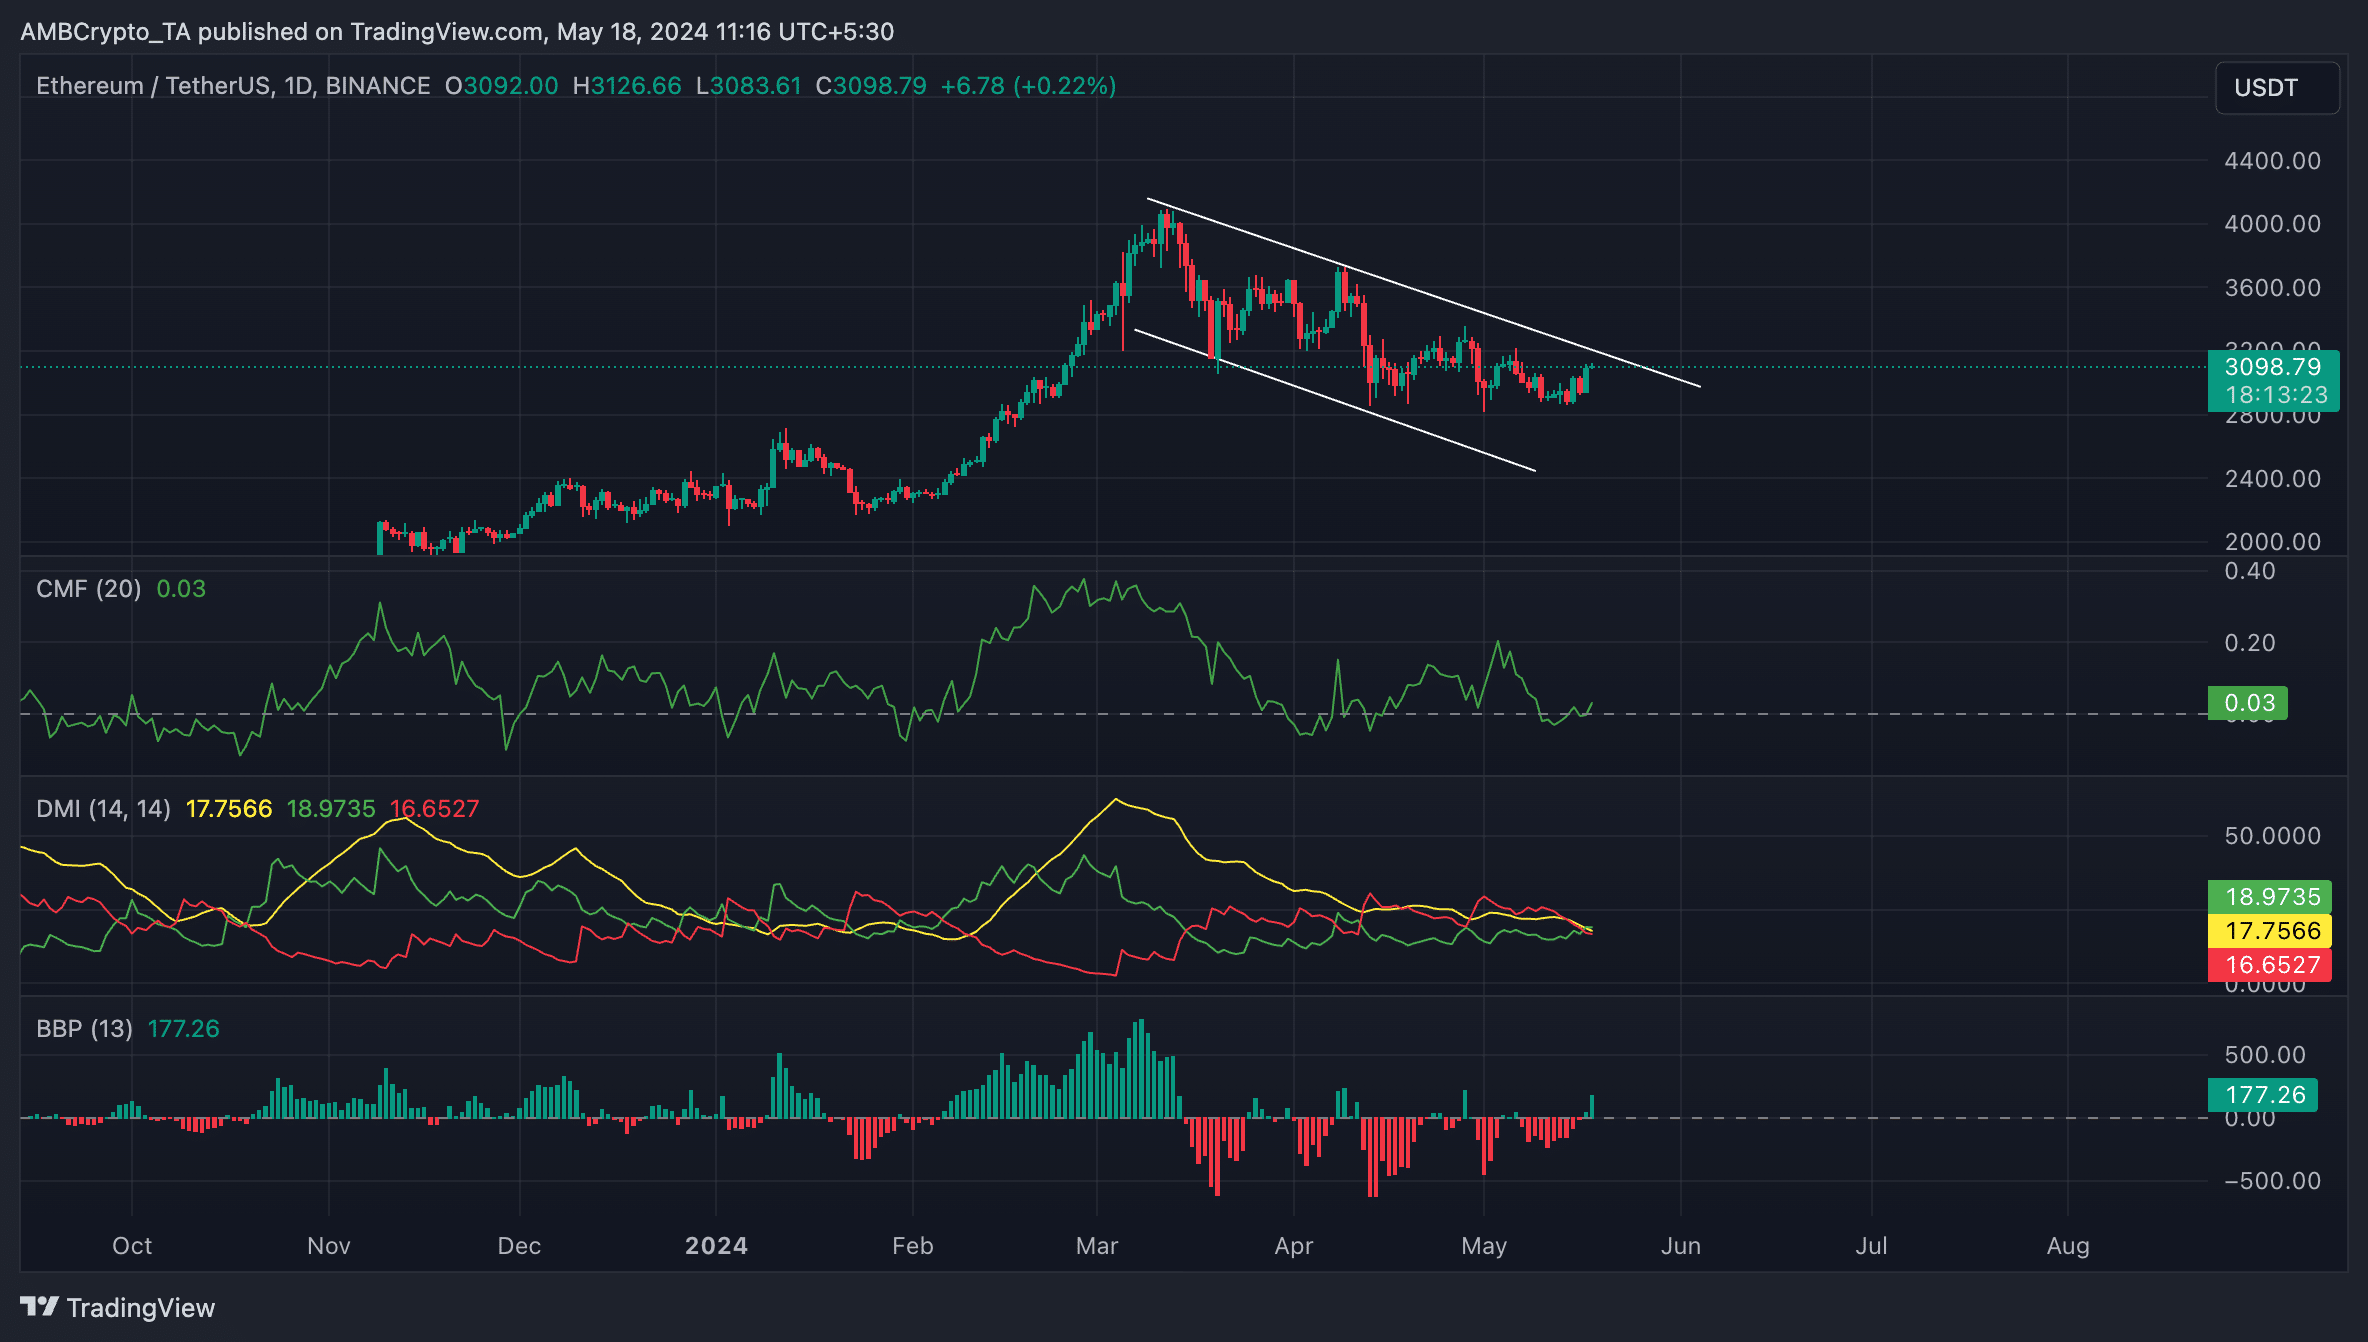
Source: ETH/USDT on TradingView
This indicator measures the relationship between the strength of buyers and sellers in the market. When it returns a positive value, it means that bull power dominates the market.
Read Ethereum’s [ETH] Price Prediction 2024-25
Should ETH bulls succeed and break above the upper line of the descending channel, the coin’s next price point will be above $3200.
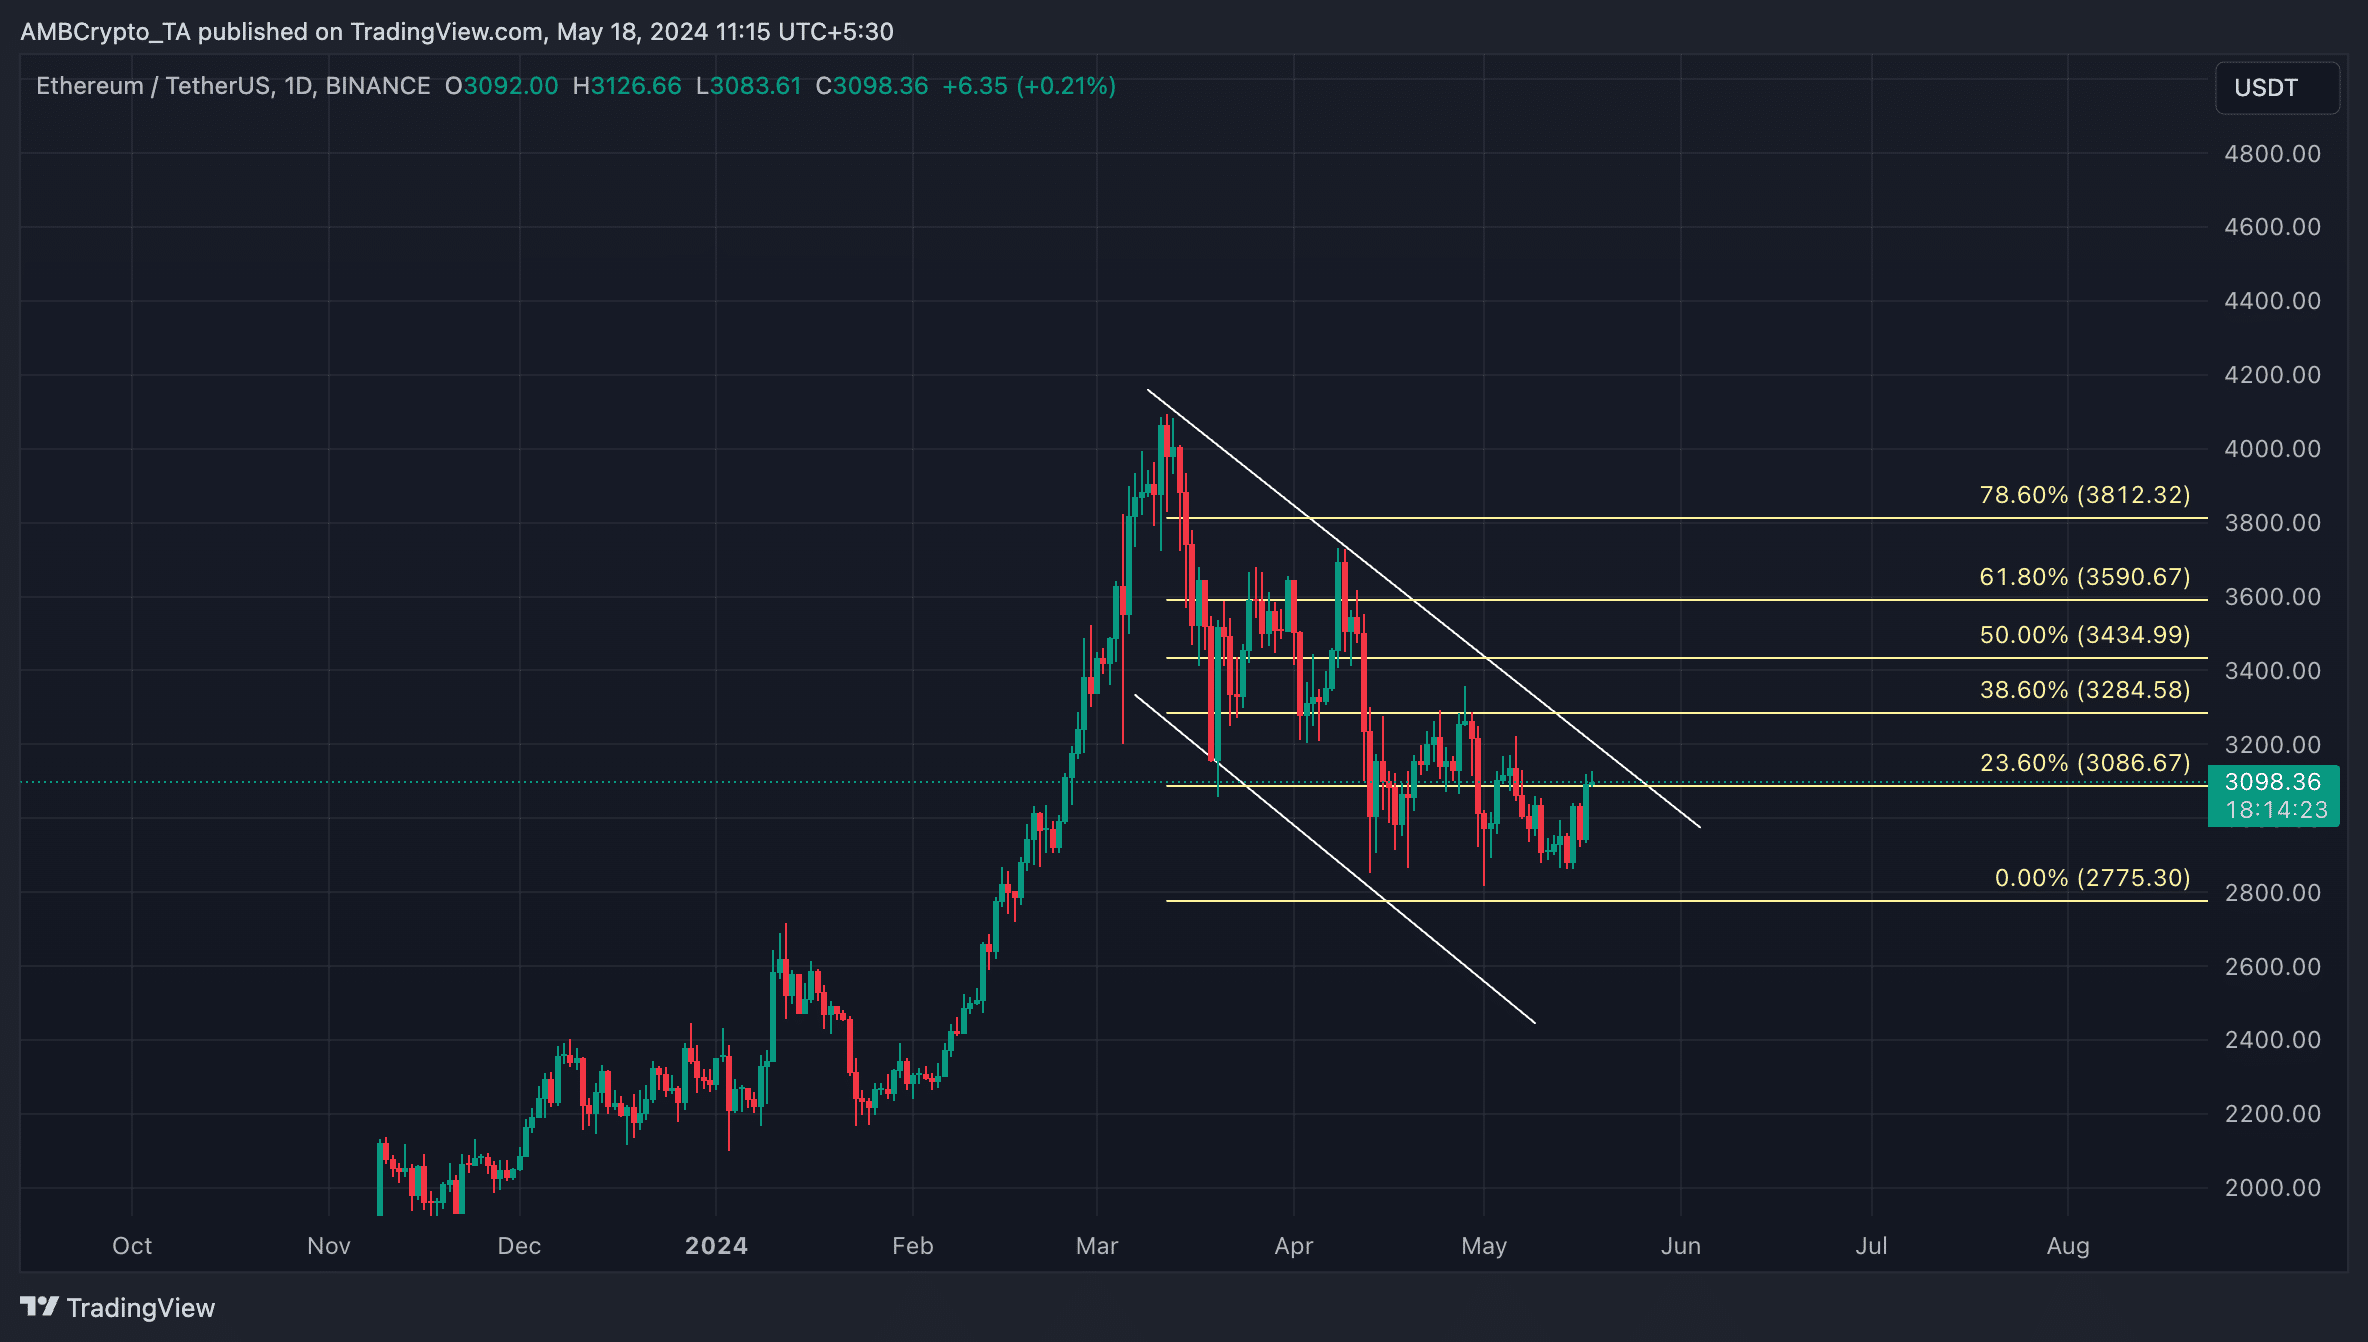
Source: ETH/USDT on TradingView
However, if selling pressure mounts and a downtrend is initiated, the price is expected to fall to $2775 toward support.