Helium breaks $7 as THIS rises by $2M – New ATH for HNT?

- HNT has gained by over 12% on growing buyer interest.
- Helium’s Open Interest has surged by over $50% to above $6 million.
The cryptocurrency market has retraced after the weekend rebound, with Bitcoin [BTC] sliding below $63,000. But despite most altcoins trading in the red, Helium [HNT] has defied the odds to gain by over 12% in the last 24 hours.
HNT was trading at $7.09 at the time of writing, with trading volumes having surged by 161%, according to CoinMarketCap.
What’s behind HNT’s gains?
Buyers are most likely driving the trading volumes as they chase the rally, aiming to profit from HNT as the rest of the market tanks.
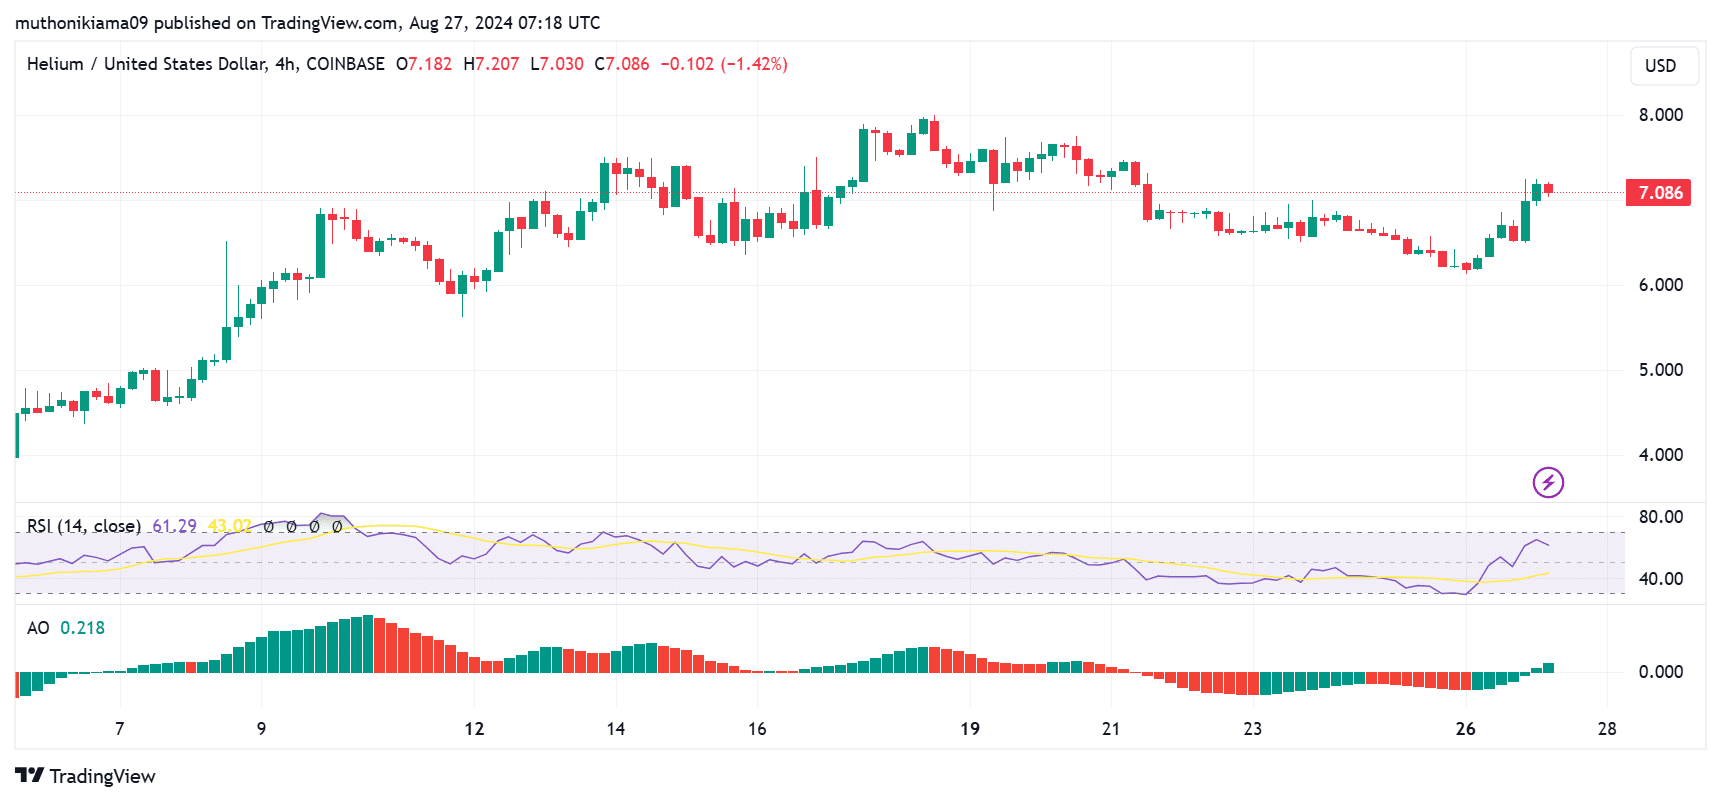
The Relative Strength Index has increased from the near oversold region of 30 on the 26th of August to the press time level of 61. This indicated an influx of buyers.
The bullish momentum is further seen in the RSI line, which has tipped north.
The green Awesome Oscillator (AO) histogram bars also showed a bullish momentum. The bars have flipped from negative to positive, showing that buyers were driving the price action.
This is usually a buying signal that could pave the way for further gains.
The rising interest around HNT can also be seen in the Open Interest (OI), which has increased by over 50% according to Coinglass. At press time, HNT’s OI stood at $6.84M, a significant jump from the previous day’s $4.2M.
The other key factor driving HNT gains is the boom of Decentralized Physical Infrastructure Networks (DePIN). Helium is making strides in this industry through its decentralized wireless networks.
Recently, Helius Labs’ CEO, Mert Mumtaz, tweeted that DePIN, stablecoins, and the tokenization of Real-World Assets (RWAs) would change how people interacted with crypto.
Key levels to watch
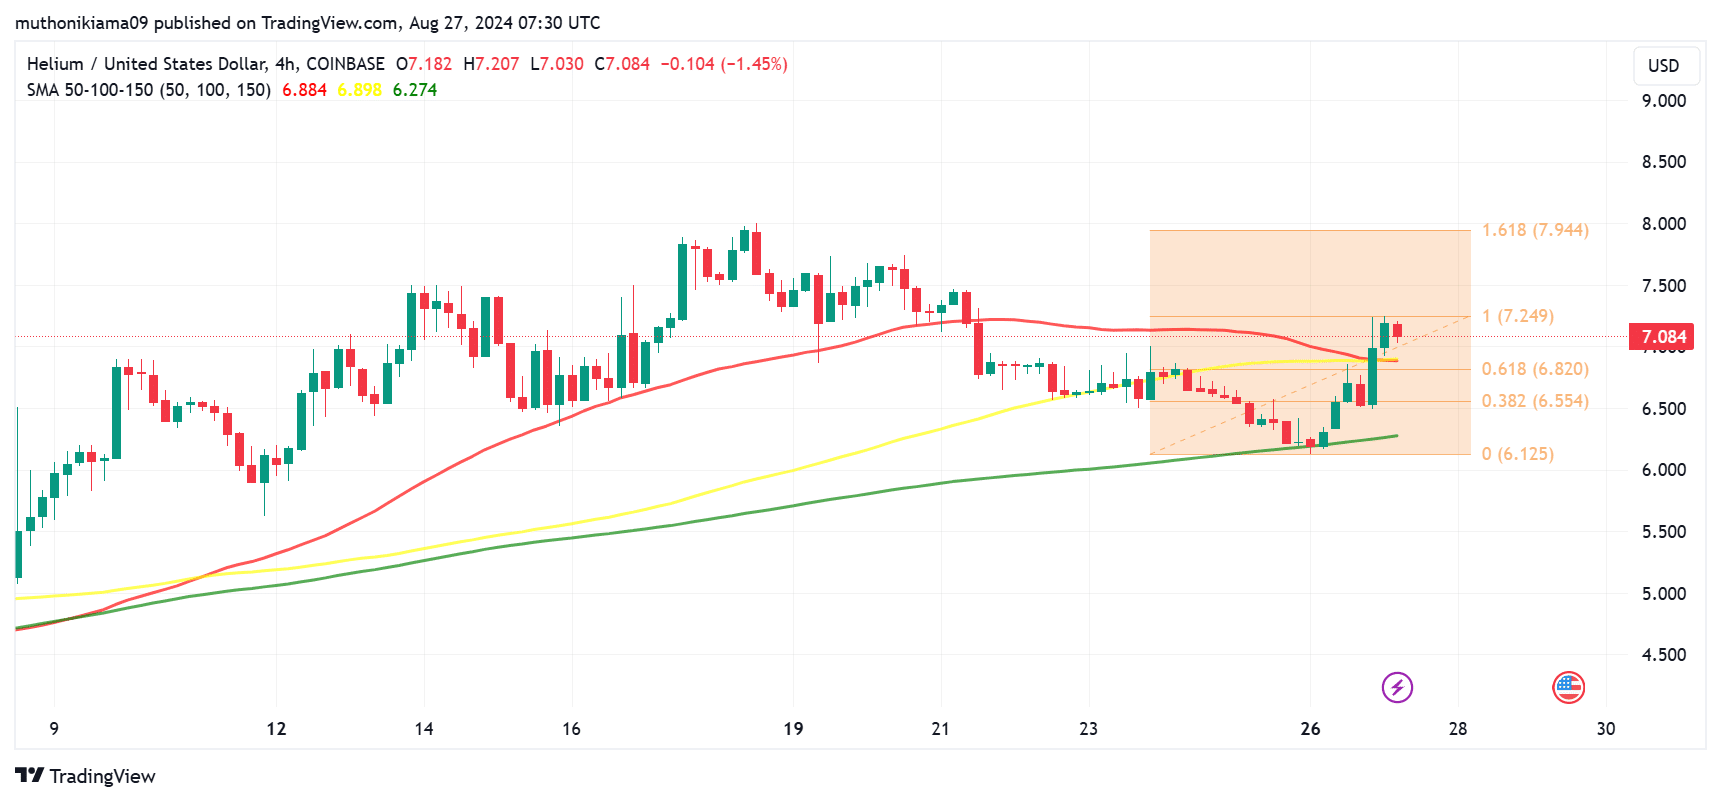
HNT remained above the 150-day Simple Moving Average (SMA) at press time, showing that it was still in a long-term uptrend.
However, traders should watch out for a potential bearish crossover of the 50-day SMA below the 100-day SMA.
The 50-day SMA has converged with the 100-day SMA. If it closes below it, it will indicate a weakening of the short-term momentum, which could see the HNT uptrend fail.
If the bullish momentum continues, HNT will likely test the next resistance at the 1.618 Fibonacci level ($7.94).
Read Helium’s [HNT] Price Prediction 2024–2025
On the other hand, if bears take control, HNT will drop to test a key support level at $6.554. Failing to hold this support will increase the downside risk.
A look at the HNT long/short ratio at 0.84 showed an influx in short positions while long positions have dropped. This meant that Futures traders were anticipating a possible correction.


