- BNB started to trade above a long-term resistance level.
- The coin’s price might reclaim its two-year-old all-time high.
Binance Coin [BNB] has broken above the upper line of its long-term symmetrical triangle, signaling a spike in buying pressure.
As of this writing, the altcoin traded at $623, above the $595 price region, which had formed a significant resistance level since March.
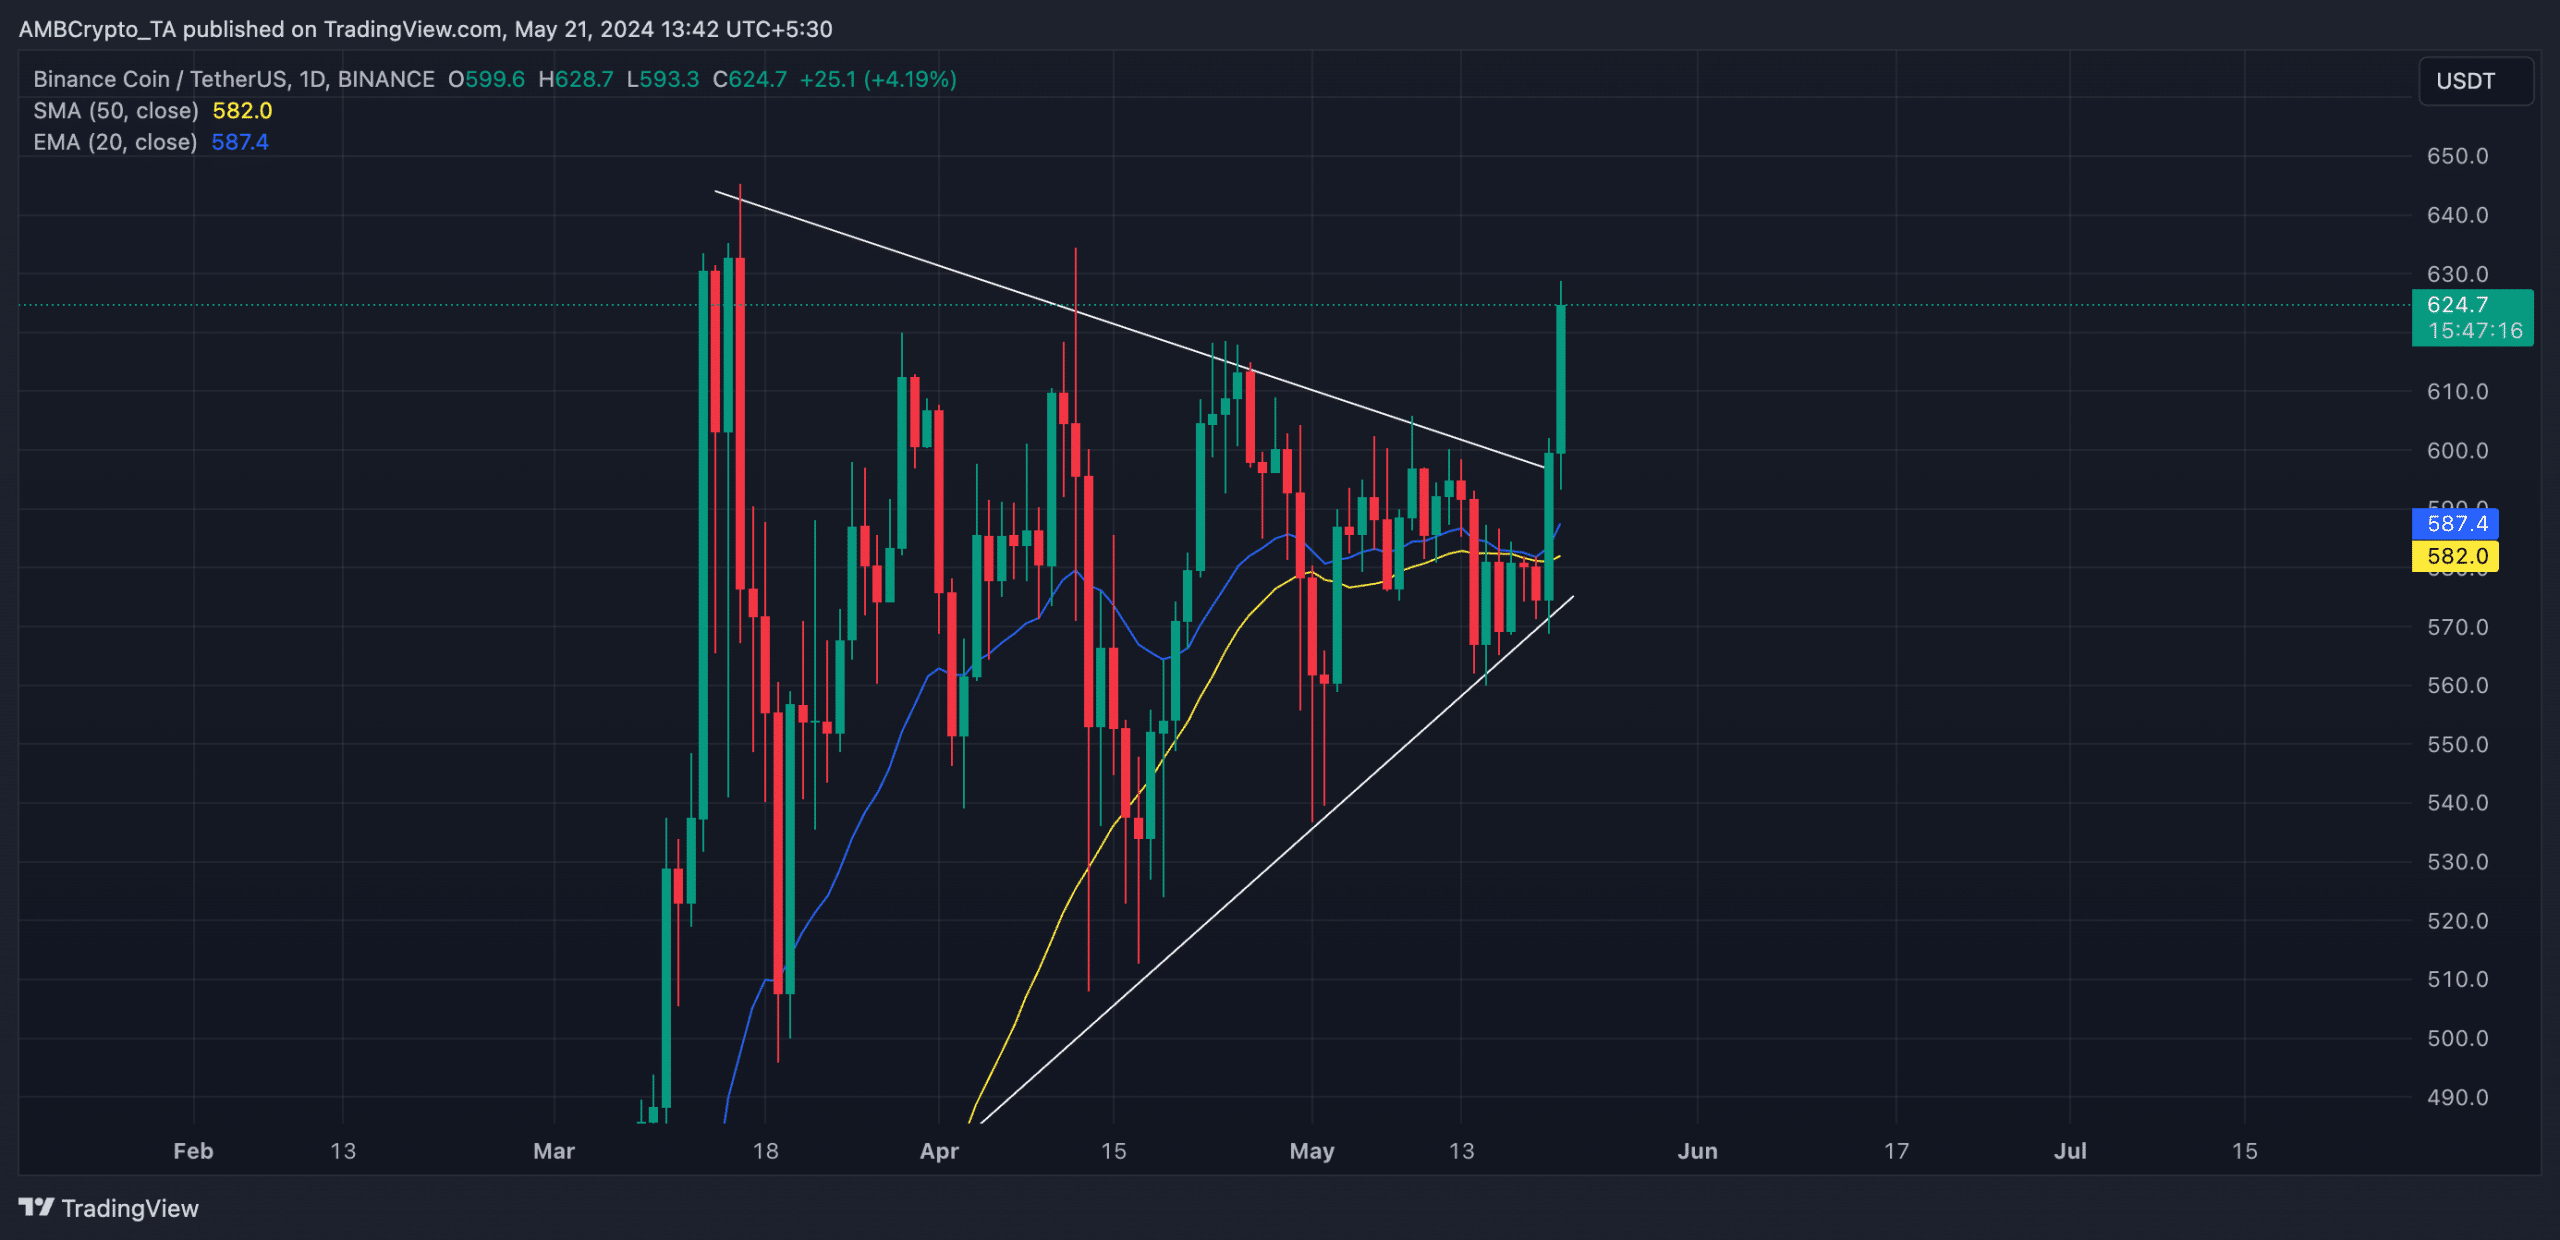
Source: BNB/USDT, TradingView
When an asset trades within a symmetrical triangle, its price continues to hit various lower highs and higher lows.
It suggests that the asset’s price is consolidating within a tight range, with buyers pushing prices up to meet resistance and sellers pushing them down to find support.
BNB poised for further growth
BNB’s price hike in the past 24 hours has led its price to rally above key moving averages.
At its press time price, the coin traded above its 20-day Exponential Moving Average (EMA) and its 50-day Small Moving Average (SMA) at press time.
This crossover is significant because BNB’s price had traded at these moving averages for five days, indicating indecision between the bulls and the bears before the 20 May market rally.
With this crossover, the market is in a sustained upward trend. Traders interpret it as a shift in momentum toward coin accumulation.
The coin’s Elder-Ray Index returned a positive value for the first time since 14 May, confirming the uptrend. This indicator measures the relationship between the strength of BNB’s buyers and sellers in the market.
When its value is positive, bull power dominates the market. As of this writing, BNB’s Elder-Ray Index was 41.44.
Further, the coin’s key momentum indicators trended upward, suggesting that the price hike in the past 24 hours has been backed by real demand for BNB.
Its Relative Strength Index (RSI) was 62.49, while its Money Flow Index (MFI) was 63.37.
At these values, these indicators showed that market participants preferred to buy more BNB coins rather than sell their current holdings.
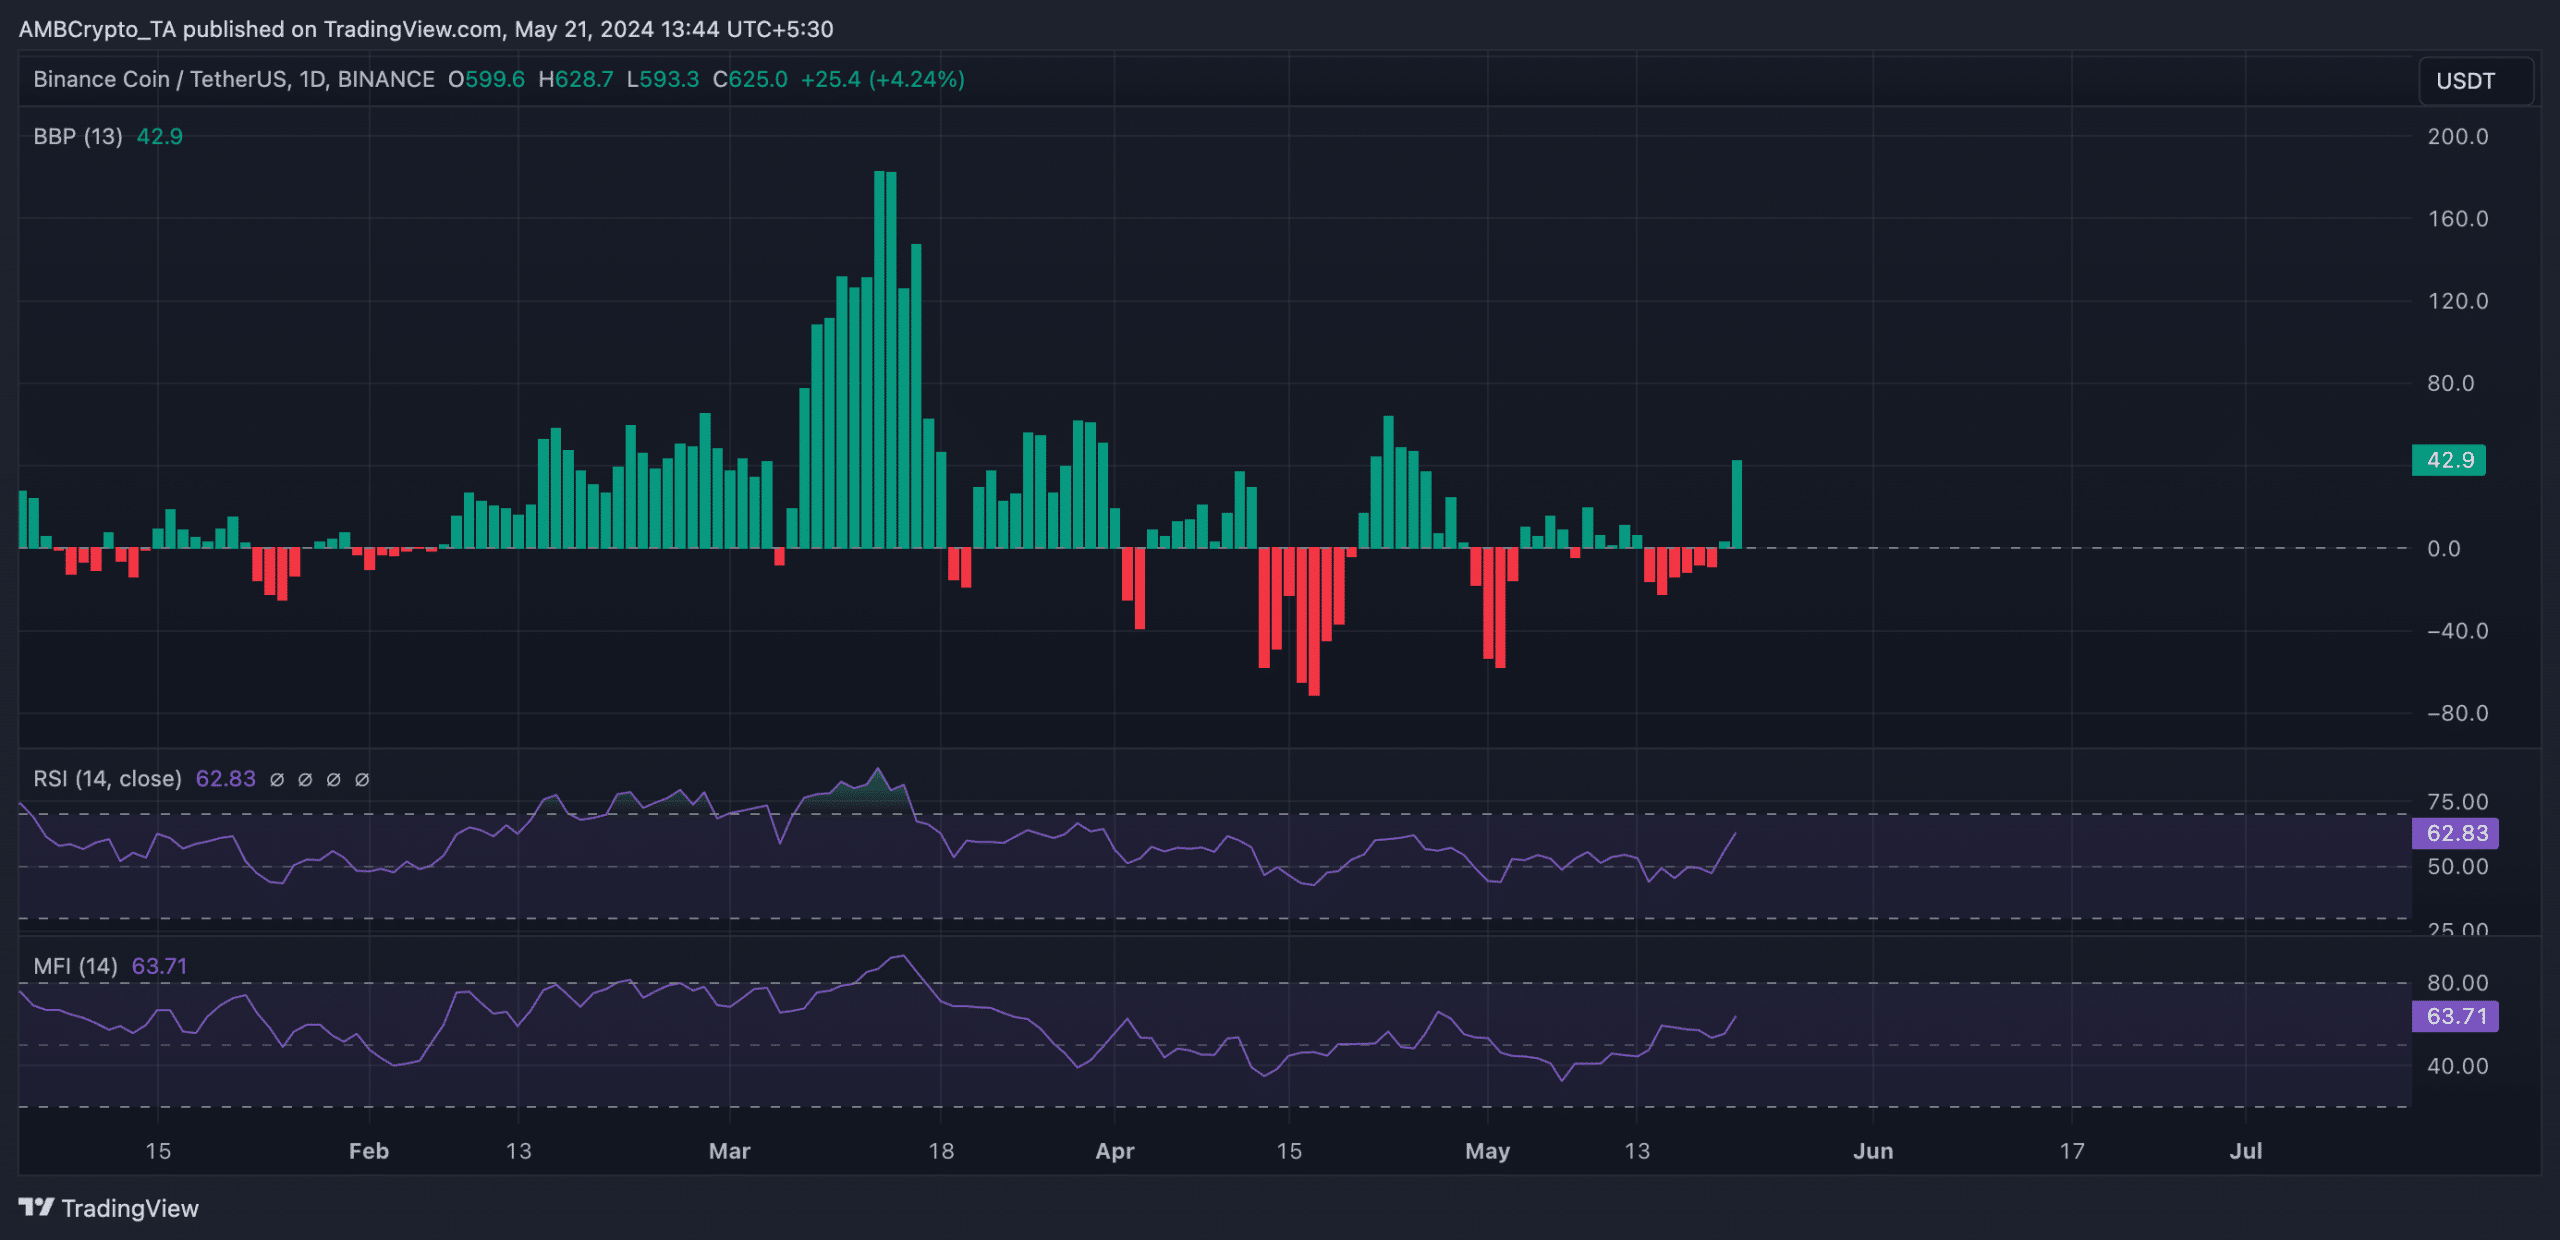
Source: BNB/USDT, TradingView
Is your portfolio green? Check out the BNB Profit Calculator
Regarding the coin’s next price point, if the buying momentum continues to grow, BNB may rally towards reclaiming its all-time high of $690, which it last reached three years ago.
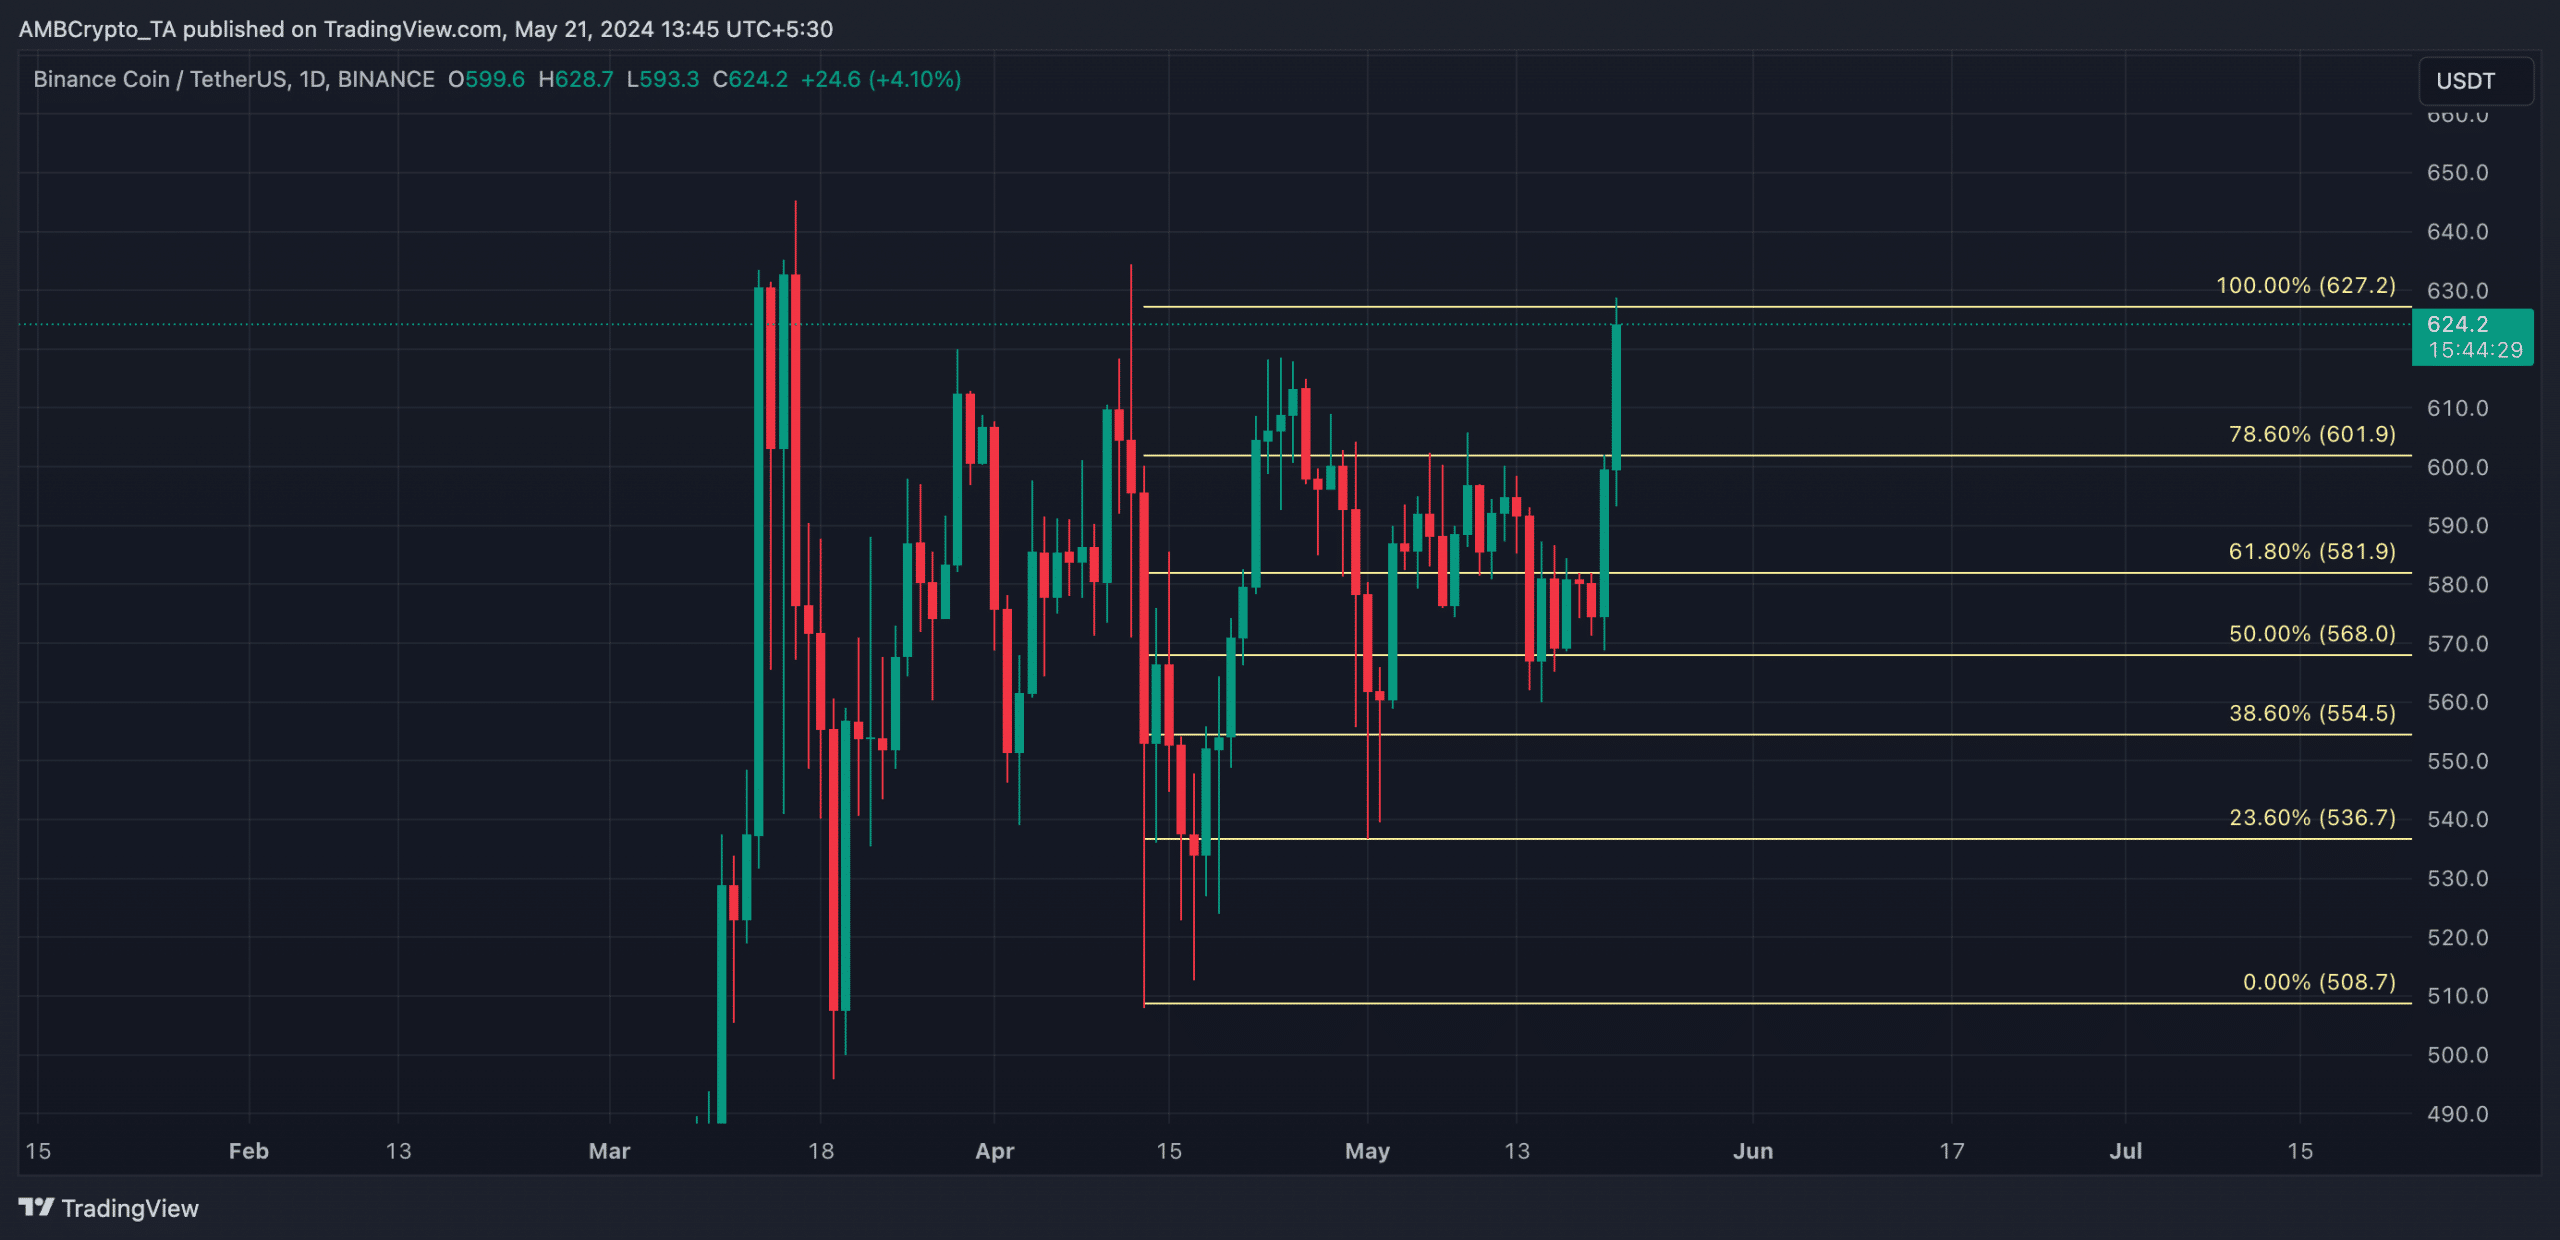
Source: BNB/USDT, TradingView
However, if buyer exhaustion sets in and the bears regain control, BNB may witness a correct back to resistance under $600.


![Render [RNDR] price prediction: Why $7 is crucial for bulls](https://ambcrypto.com/wp-content/uploads/2024/06/Render-RNDR-price-prediction-1-400x240.jpeg)