
- According to Ali Martinez, MATIC’s key metric has presented a buying opportunity.
- Bearish sentiments still abound in the token’s market.
The Market Value to Realized Value (MVRV) ratio of Polygon’s native token MATIC has flashed a buy signal, crypto analyst Ali Martinez noted in a post on X (formerly Twitter).
According to the analyst, the token’s MVRV ratio assessed over different moving averages returned negative values. Per Santiment’s data, MATIC’s MVRV ratios on 30-day and 365-day moving averages were -10.11% and 11.99%, respectively, at the time of writing.
The MVRV ratio tracks the ratio between an asset’s current market price and the average price of every coin or token acquired for that asset.
A positive MVRV ratio above one signals that an asset is overvalued. It suggests that the current market value of an asset is significantly higher than the price at which most investors acquired their holdings.
Conversely, a negative MVRV value shows that the asset in question is undervalued. It suggests that the market value of the asset in question is below the average purchase price of all its tokens that are in circulation.
As Martinez noted, MATIC’s negative MVRV ratios present a “perfect time to buy.” This is because, at its current price, MATIC trades at a discount relative to its historical cost basis.
Are MATIC bulls making a comeback?
An assessment of MATIC’s price movements on a 1-day chart showed a slow shift in market sentiment from bearish to bullish.
First, readings from the token’s Parabolic SAR indicator showed its dots resting below the price at the time of writing. This indicator is used to identify potential trend direction and reversals.
When its dotted lines are placed below an asset’s price, the market is said to be in an uptrend. It indicates that the asset’s price is rising and may continue to do so.
Likewise, for the first time since 15th March, MATIC’s MACD line (blue) now sits above its signal line (orange). When these lines are positioned this way, an asset’s shorter-term average is above its longer-term average.
It is a bullish sign, and market participants take it as a sign to take long positions and exit short ones.
Read Polygon’s [MATIC] Price Prediction 2024-2025
However, while buying activity may have returned to the MATIC market, bearish sentiments remain significant. For example, its negative directional index (red) still sits above its positive index (green).
This suggests that the power of MATIC bears significantly exceeds that of its bulls, as selling momentum remains high.
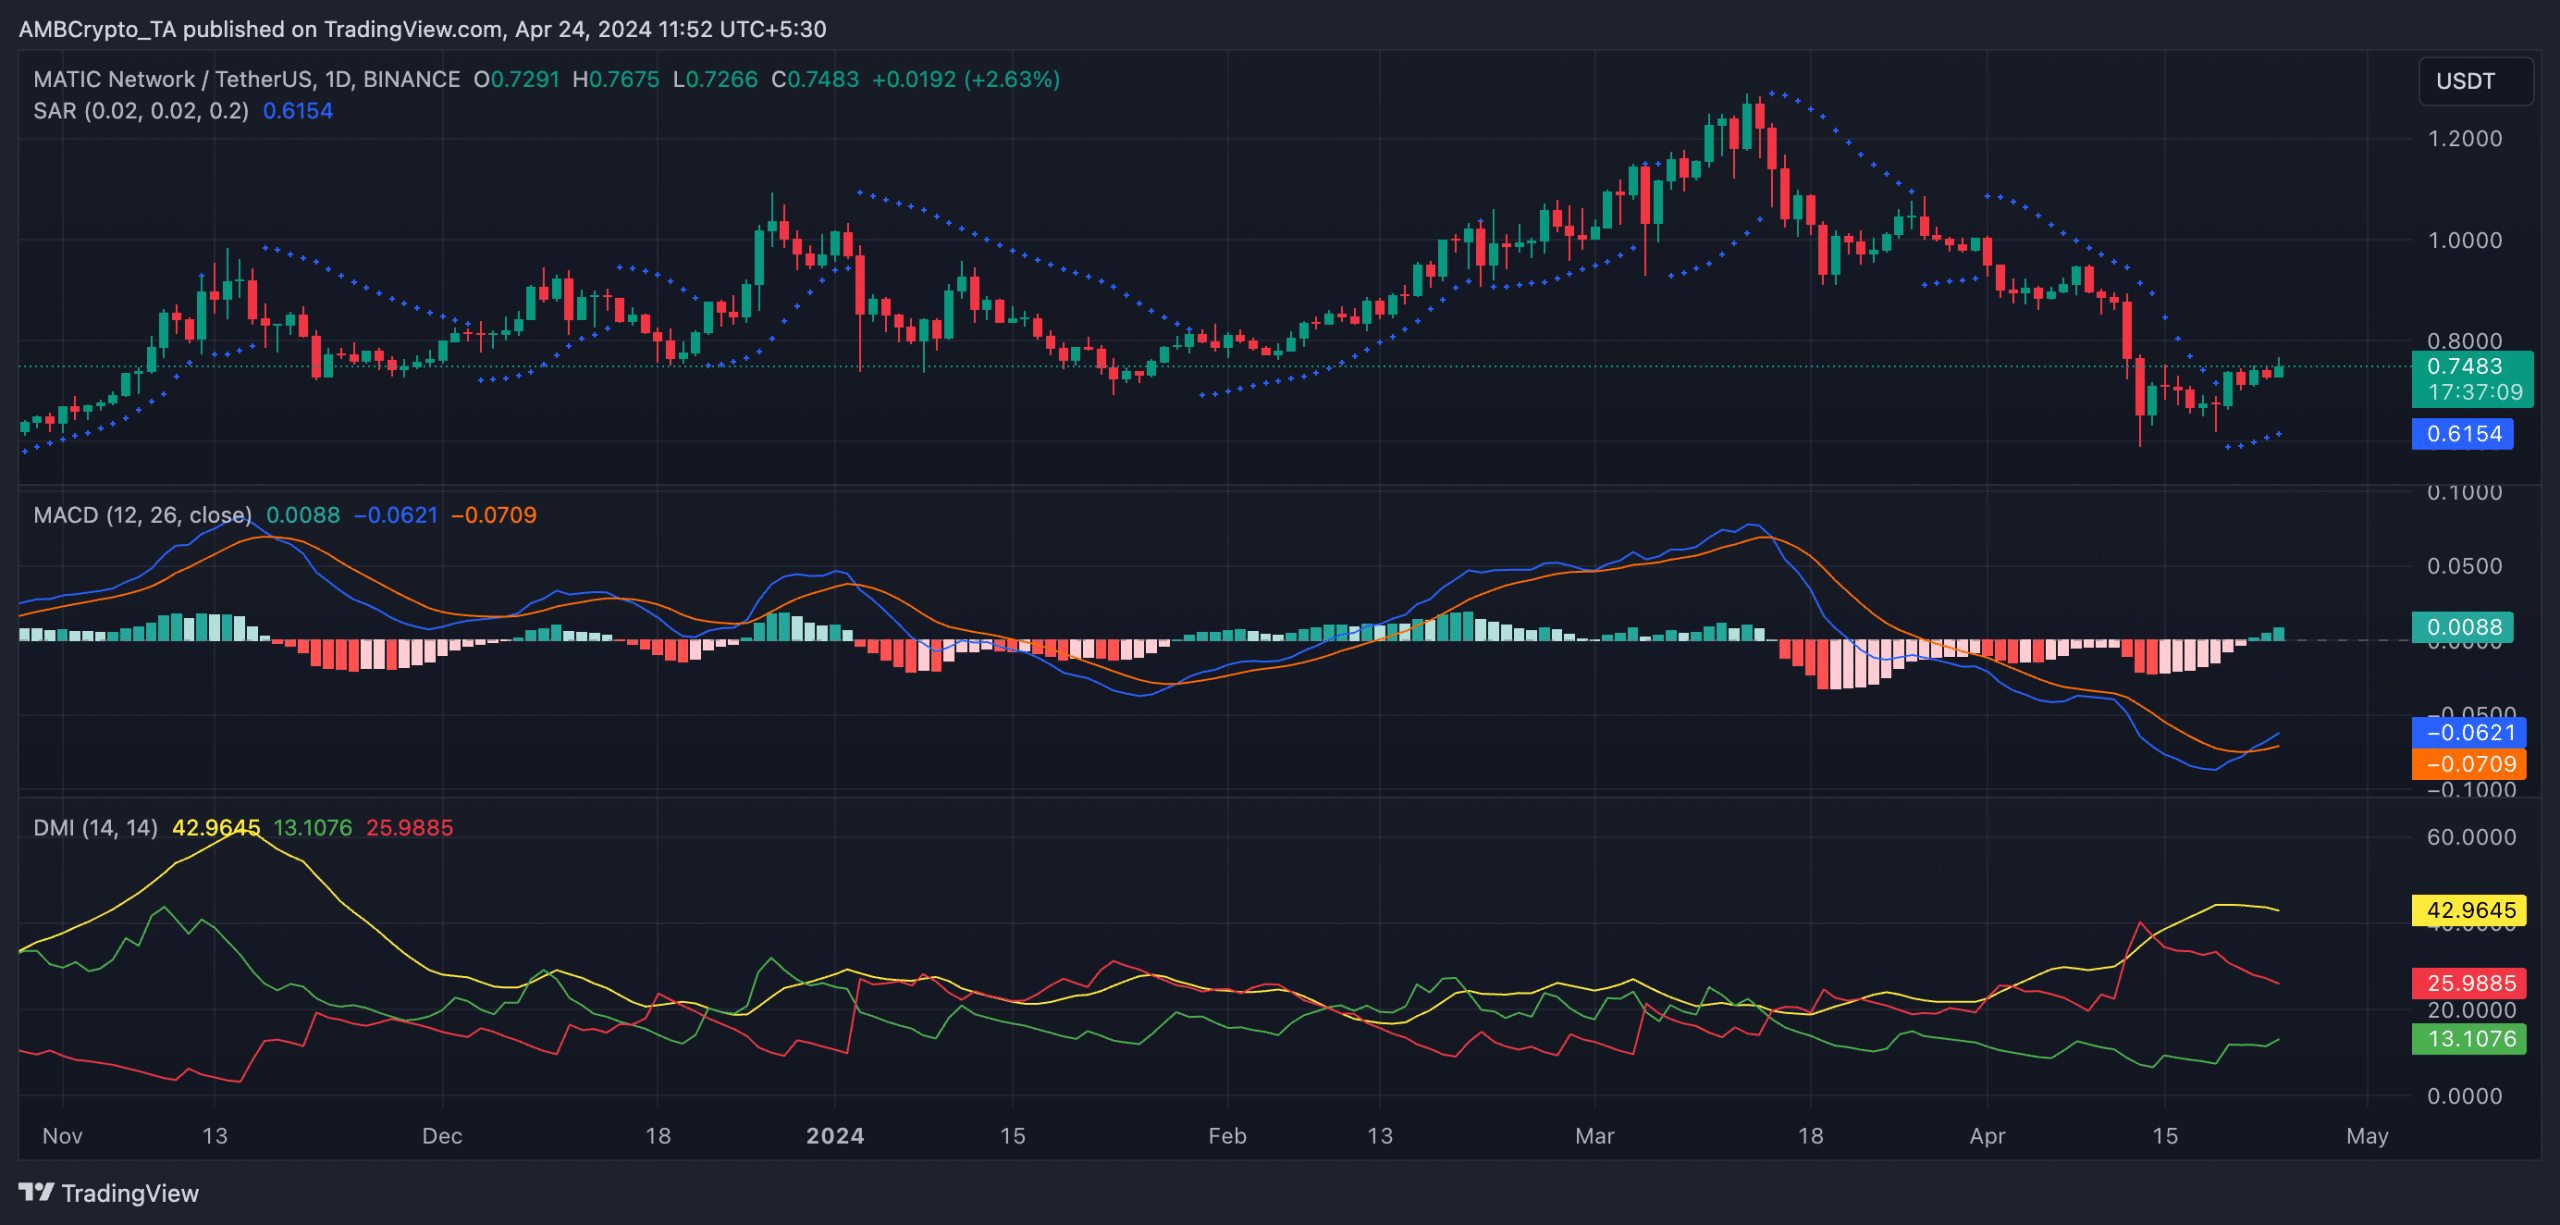
Source: MATIC/USDT on TradingView