
- MATIC remains caught in a bearish trend, with its price consistently below all major moving averages.
- Occasional bullish reversal signals have appeared, but were not strong enough to sustain a price recovery.
In recent weeks, Polygon [MATIC] has struggled to break free from a persistent bearish trend, causing concern among investors and traders.
Despite a broader recovery from the market, MATIC’s price has been stuck in a downward loop, raising questions about its ability to recover.
MATIC’s price was below all three moving averages at press time, which is a bearish indicator. The fact that the price is struggling to breach the 50-period MA on several occasions points to resistance in the short term.
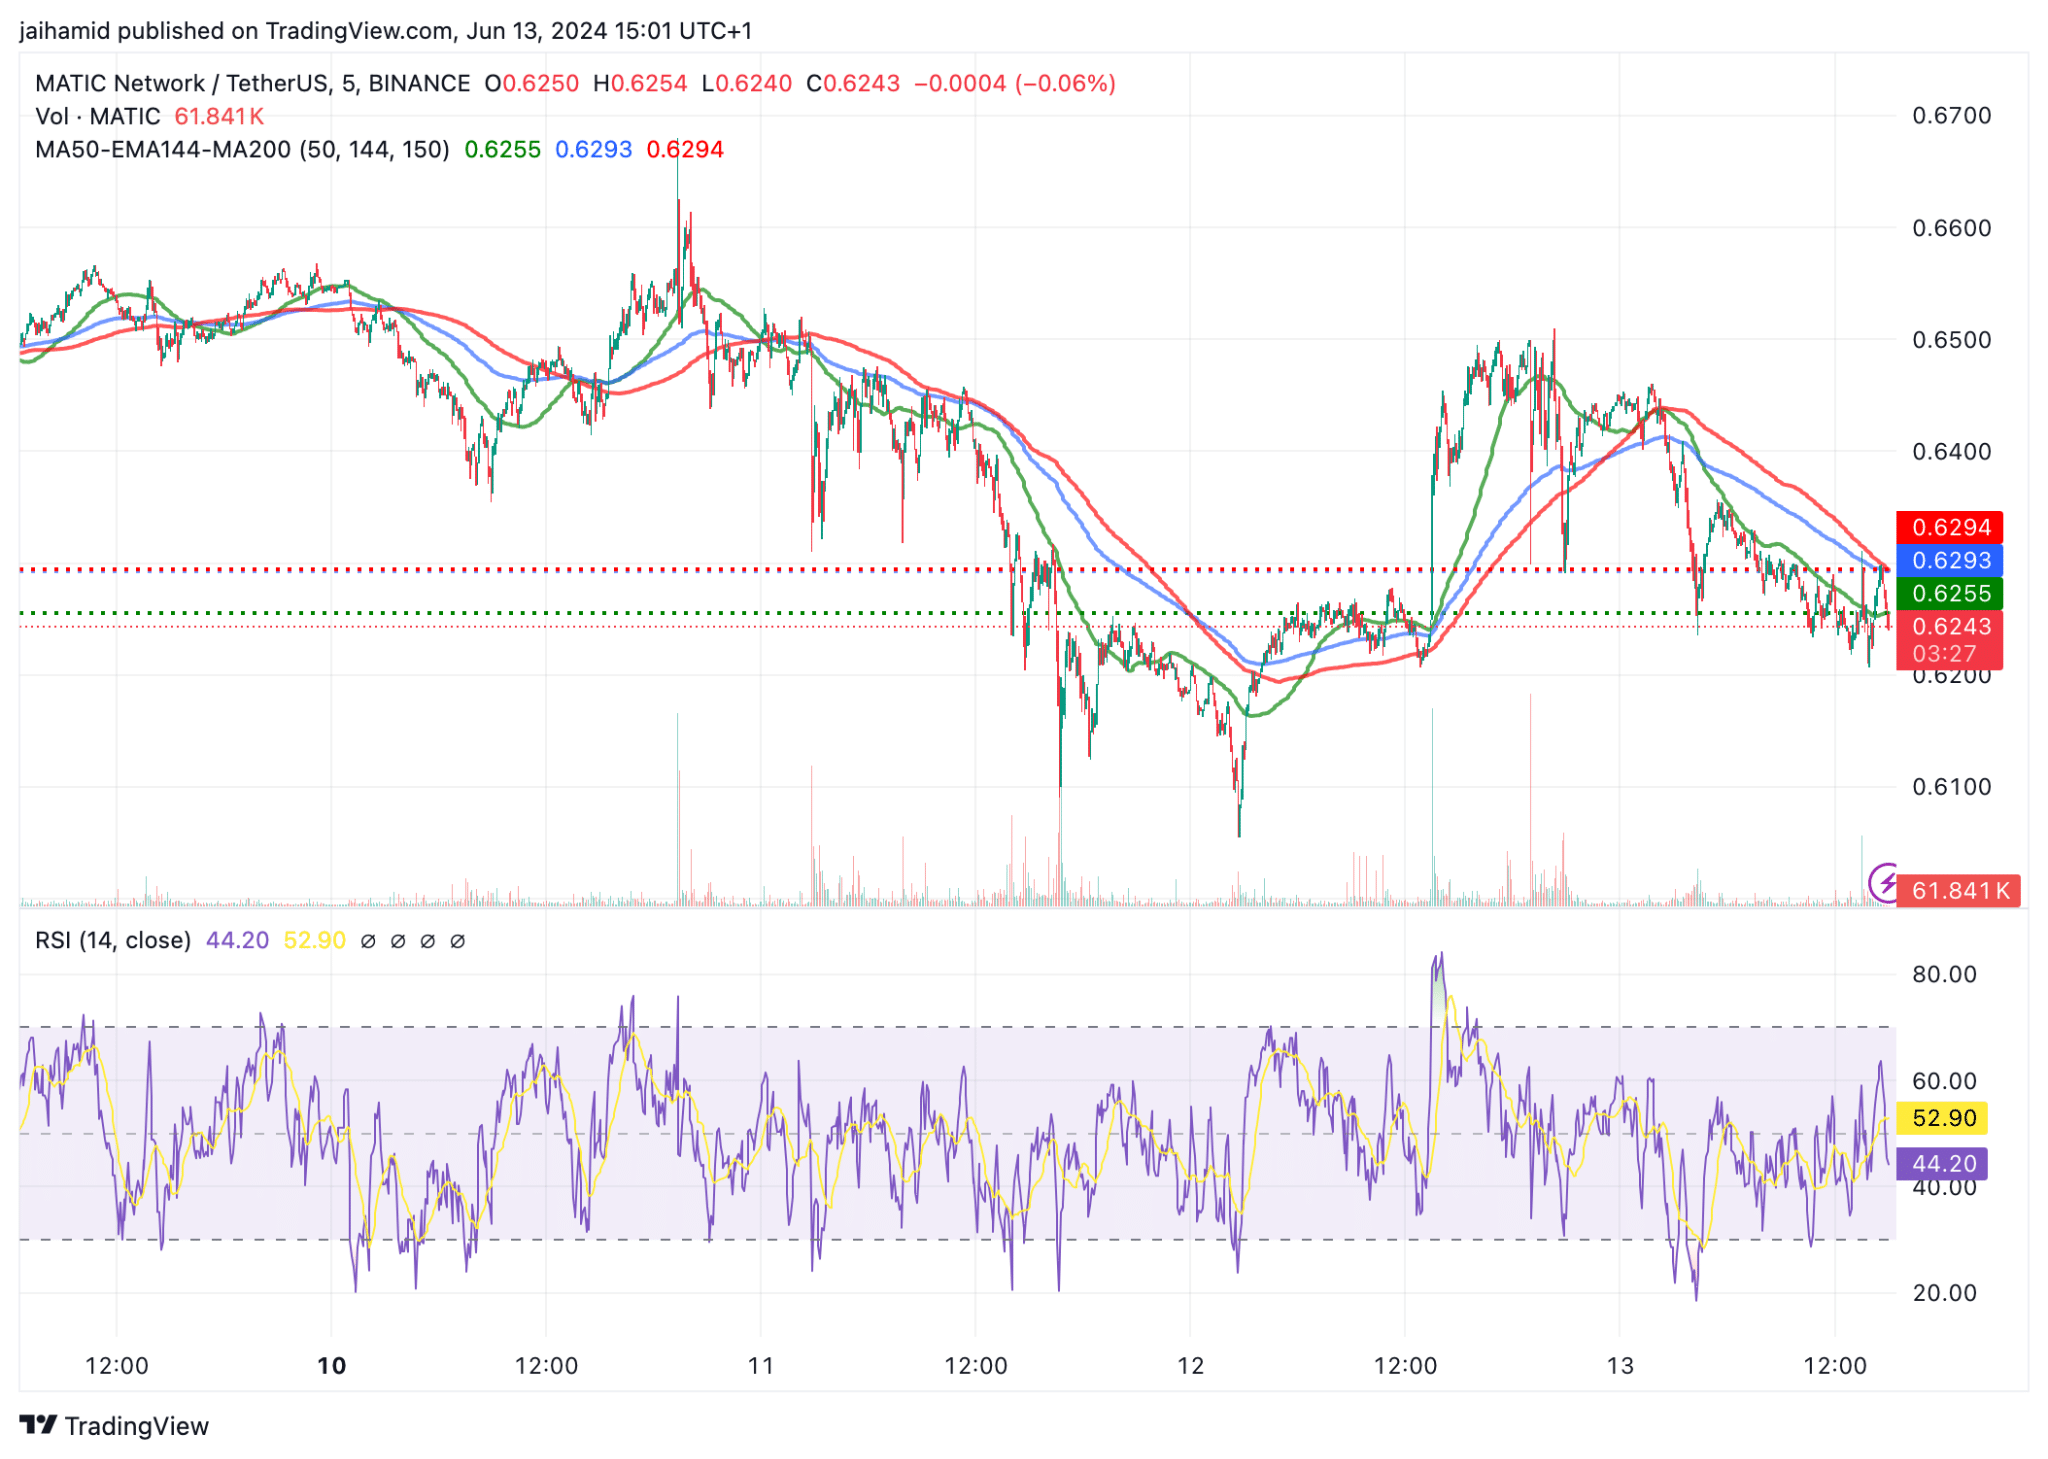
Source: TradingView
MATIC price chart shows…
The RSI suggests that there is neither strong selling pressure that has exhausted the market nor is there strong buying momentum, meaning traders are quite skeptical about Polygon.
The downward trend line (upper dotted line) shows consistent lower highs, which confirms the ongoing bearish sentiment.
Notably, the price has also not dropped significantly below the recent lows, suggesting some level of support around the $0.6250 area.
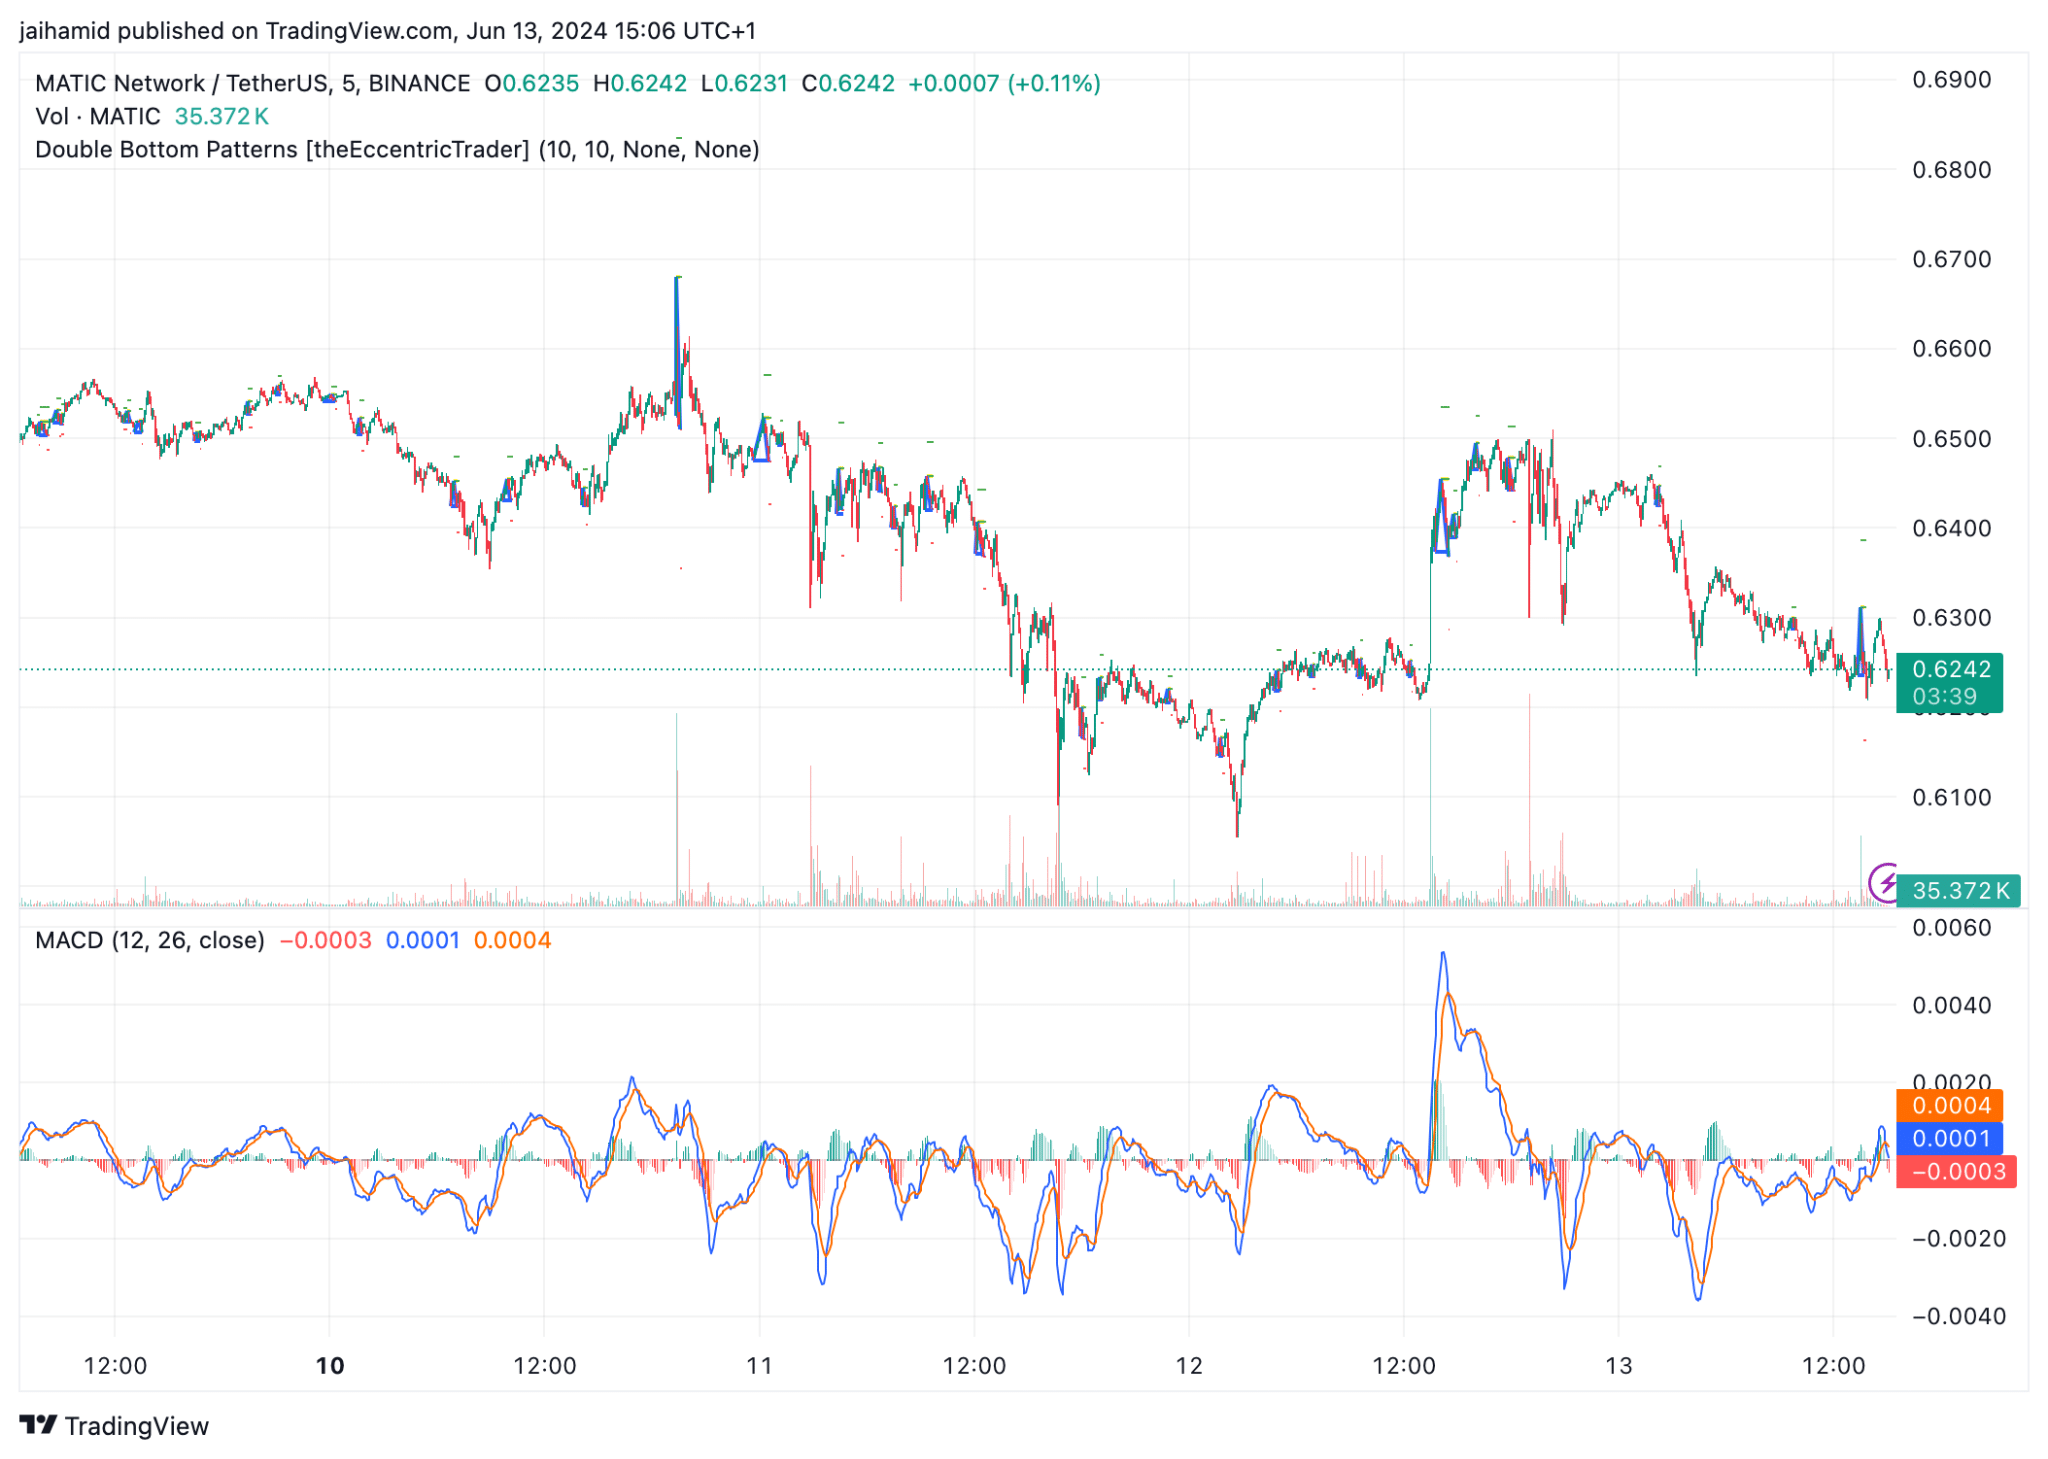
Source: TradingView
The chart is also marked with several double bottom patterns, which are considered bullish reversal patterns. The patterns suggest attempts to reverse the price from a downtrend to an uptrend.
But not all marked double bottoms lead to a huge price increase, which suggests that the buying pressure was not strong enough to sustain a reversal
The MACD line (blue) and its signal line (orange) are hovering around the zero line, indicating a lack of strong momentum in either direction.
The MACD histogram, which shows the difference between the MACD line and the signal line, is also very close to zero, further emphasizing the low momentum and indecisiveness in the market.
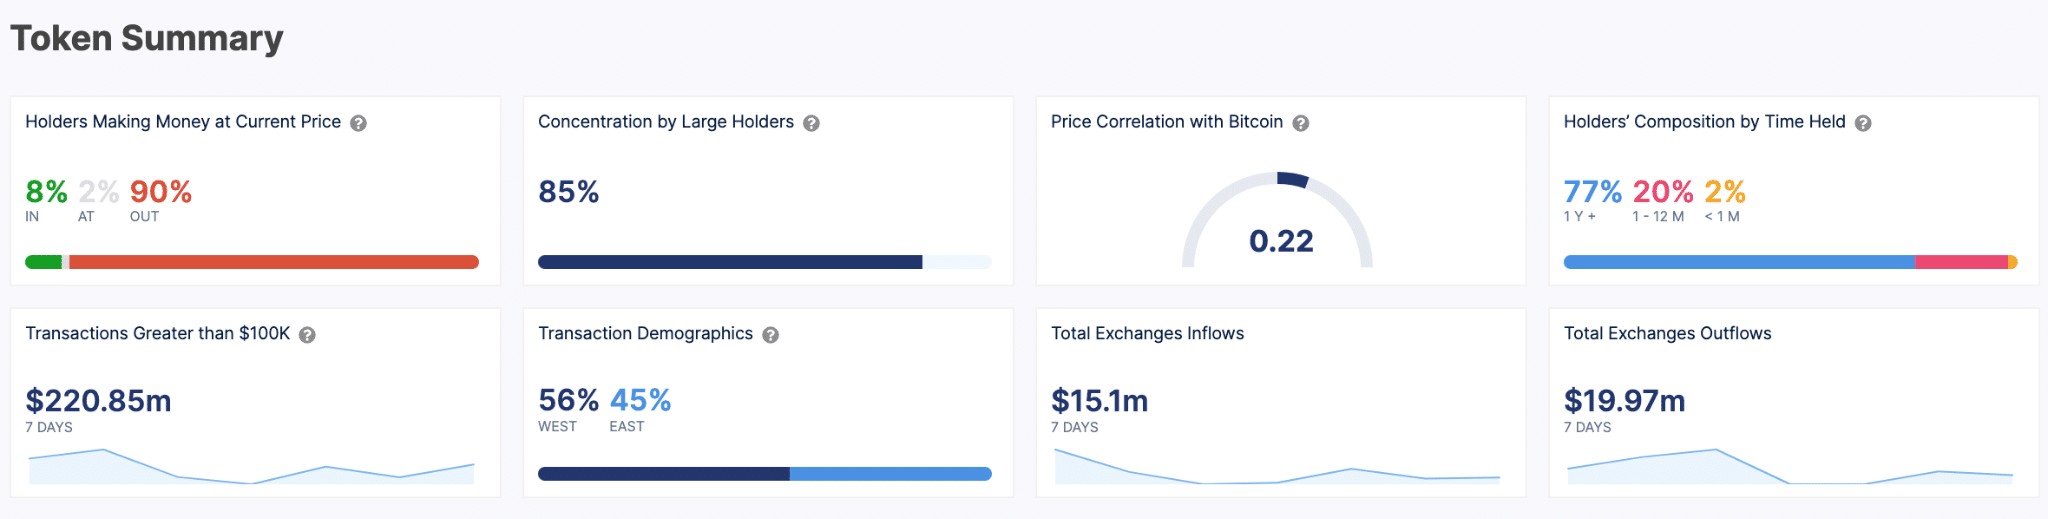
Source: IntoTheBlock
Only 8% of MATIC holders are currently in profit, which indicates that a significant majority (90%) of holders are experiencing a loss at the current price level.
Realistic or not, here’s MATIC’s market cap in ETH’s terms
This could create selling pressure as holders might look to cut losses or exit break-even points during price recoveries.
A low correlation of 0.22 with Bitcoin indicates that the token’s price movements are relatively independent of the broader market’s sentiment, which could either be really good, or really bad.