- XRP was down by more than 4% in the last seven days.
- Most market indicators remained bearish on the token.
Like most cryptos, XRP was also facing trouble of late as it failed to raise its price. The latest price correction has pushed XRP down to a critical support level.
This allowed the token to make a bullish move to change the trend. However, if the token fails to test the support, then things can get worse.
XRP bears are leading
CoinMarketCap’s data revealed that XRP’s value dropped by more than 4% in the last seven days. In the last 24 hours alone, its price dipped by over 2%.
At the time of writing, the token was trading at $0.4754 with a market capitalization of over $26 billion, making it the seventh largest crypto.
AMBCrypto’s analysis of the token’s daily chart revealed that a descending triangle pattern appeared.
In fact, the token was testing its crucial support zone, which gave XRP an opportunity to rebound. But if it fails to test the support, then investors might witness a further price decline in the coming days.
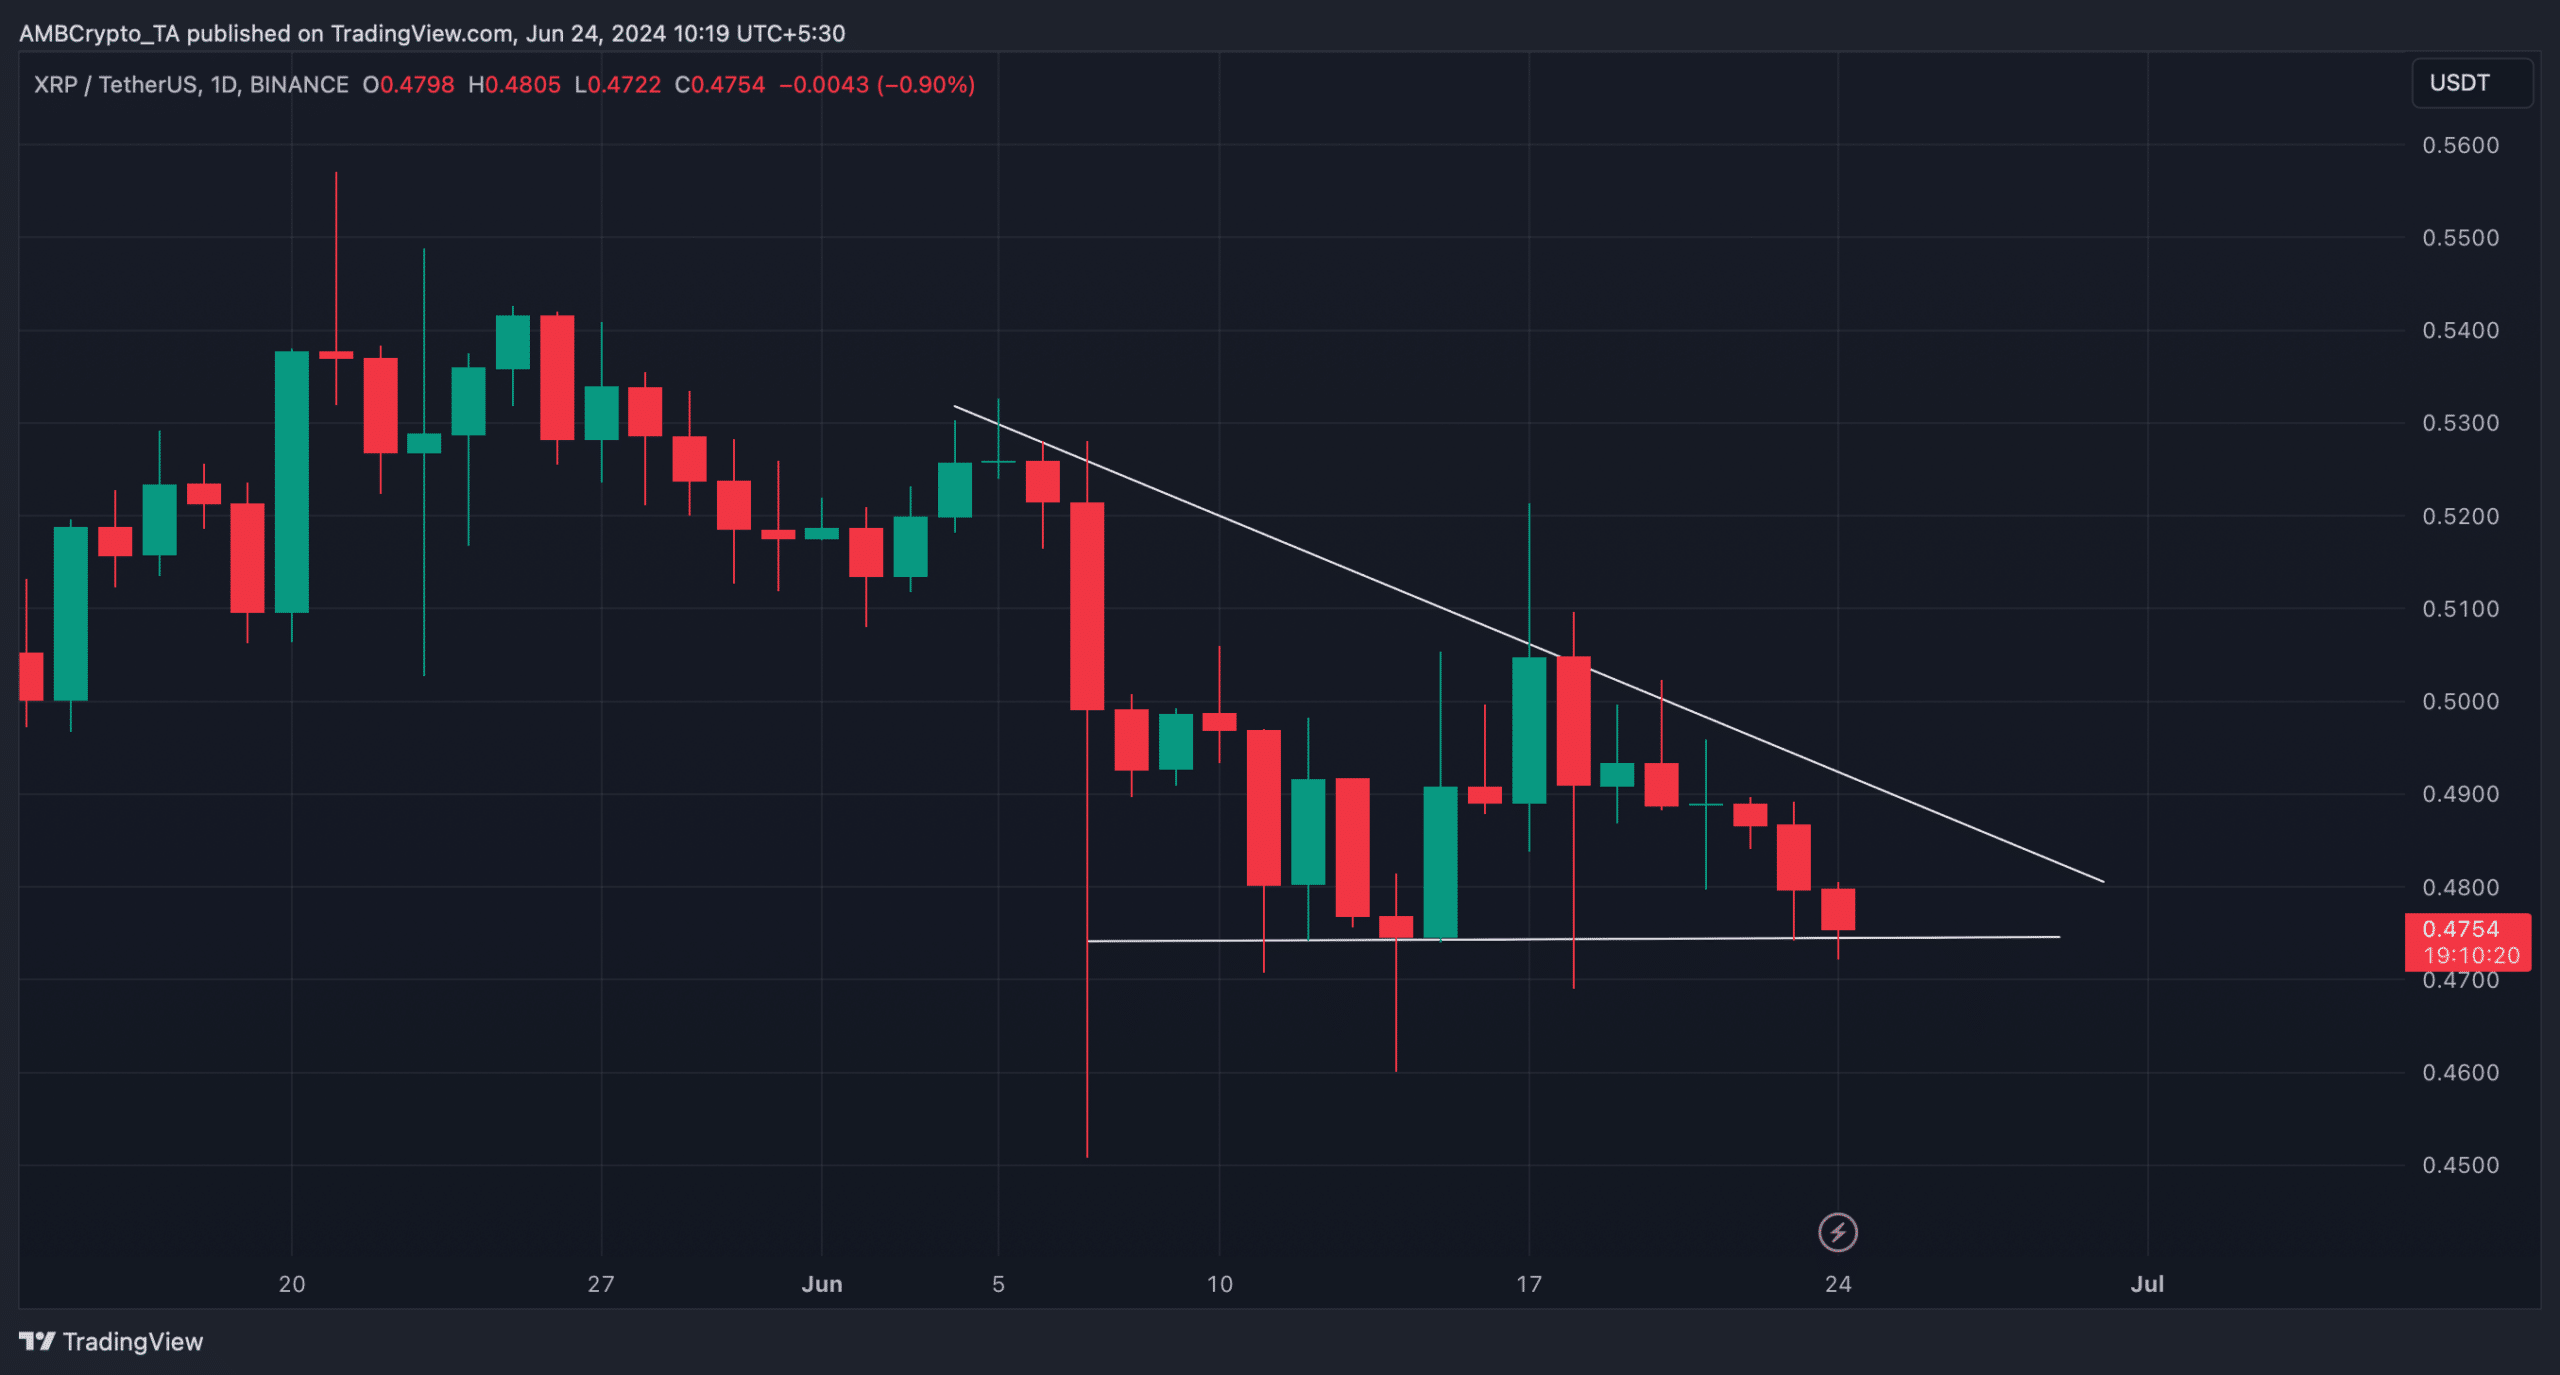
Source: TradingView
What to expect?
Since there was uncertainty about XRP in the coming days, AMBCrypto planned to have a look at the token’s on-chain data.
Our analysis of Santiment’s data revealed that buying pressure on XRP was rising. This was evident from the spikes in its exchange outflow last week.
On top of that, its supply on exchanges also dropped, meaning that investors were buying the token.
After a massive dip, the token’s weighted sentiment also improved. A rise in the metric means that investors were confident in XRP and bullish sentiment around the token was increasing.
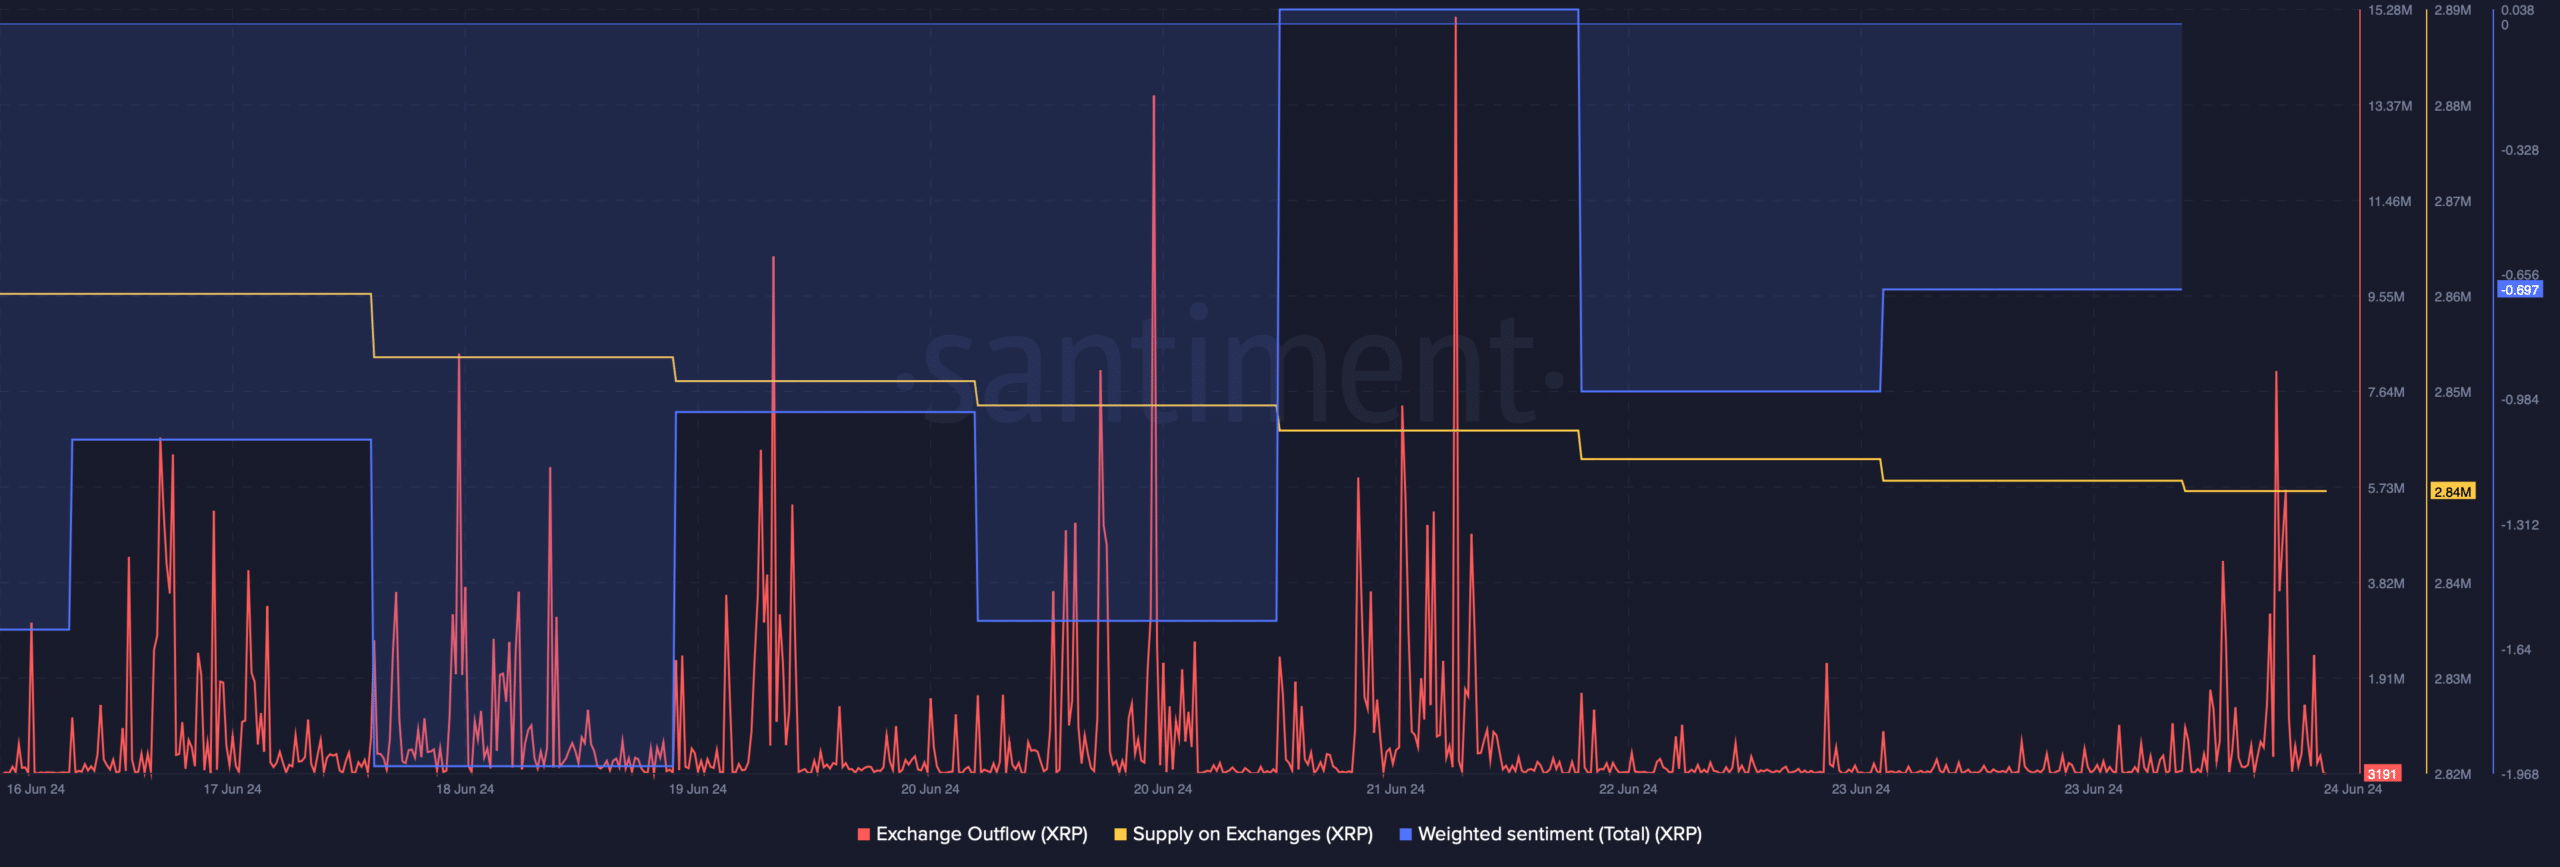
Source: Santiment
The token’s Chaikin Money Flow (CMF) also looked optimistic as it registered an uptick. However, the rest of the indicators looked bearish, suggesting that XRP might plummet under its support.
Both its Relative Strength Index (RSI) and Money Flow Index (MFI) registered downticks. Additionally, the MACD dispelled the idea that the bulls and the bears were in a battle to gain an advantage over each other.
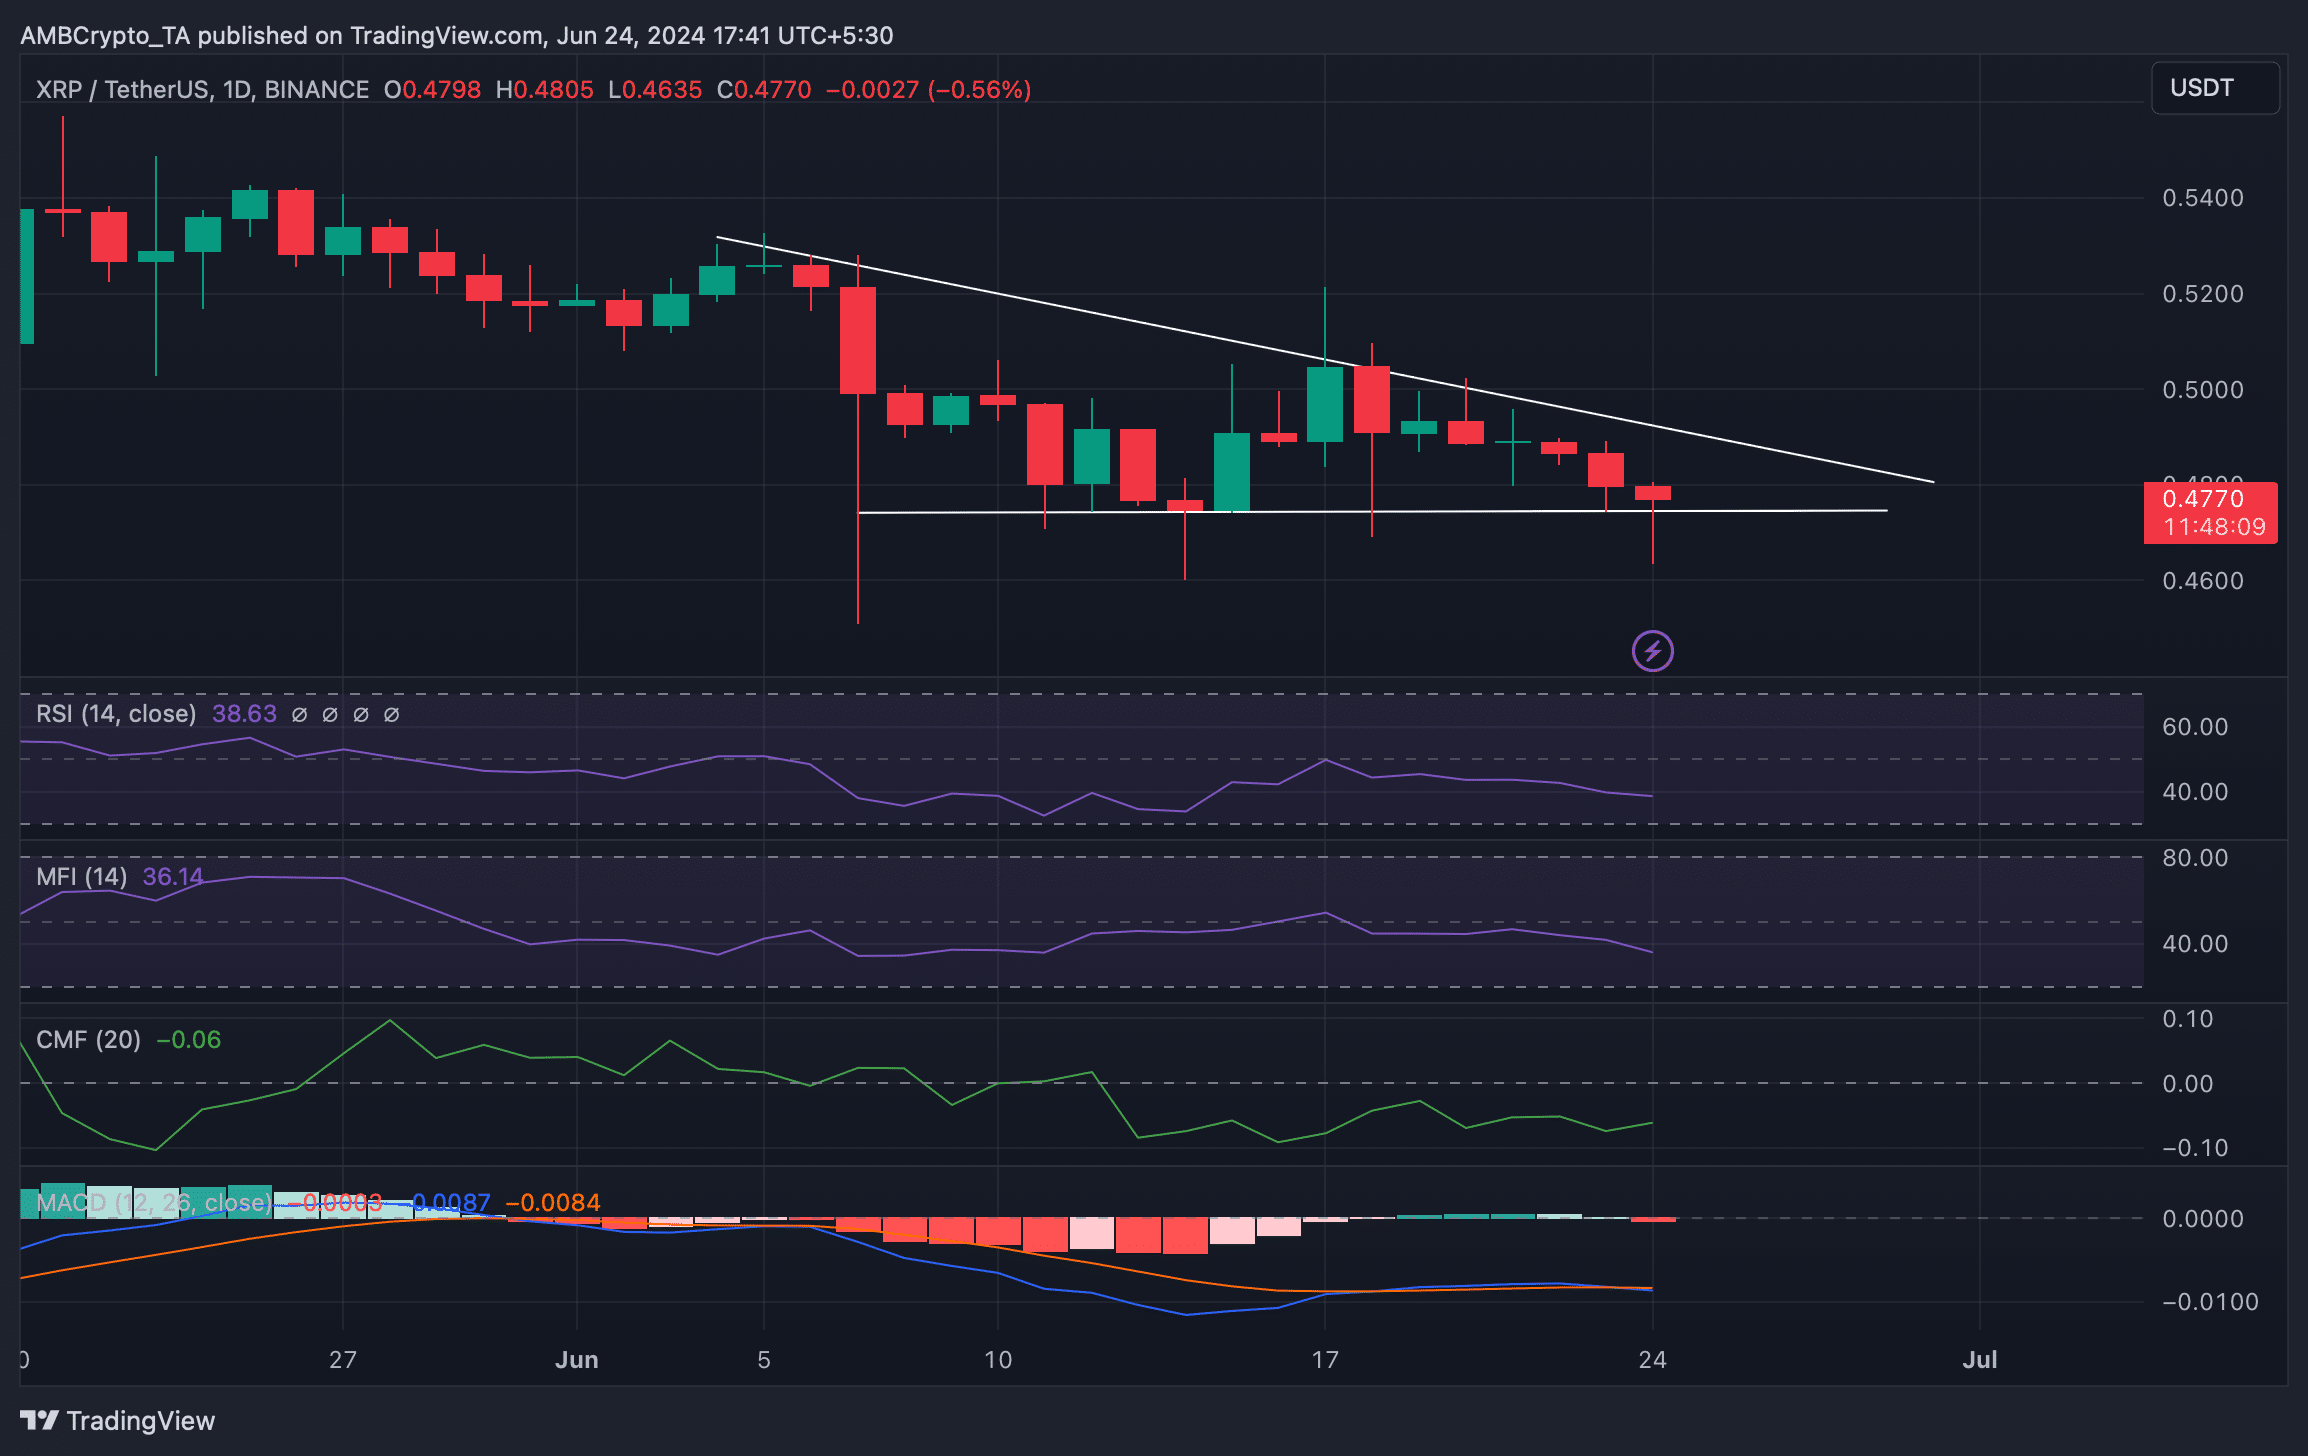
Source: TradingView
Is your portfolio green? Check out the XRP Profit Calculator
We then checked Hyblock Capital’s data to look for upcoming targets for XRP this week. As per our analysis, the bears continue to dominate.
Then investors might see the token drop to $0.445 this week. However, if the bulls step in and initiate a trend reversal, then the token might as well reclaim $0.5 as liquidation would rise at that level.

Source: Hyblock Capital