
- XRP’s price has dropped by almost 10% in the last week.
- It now trades below its 20-day EMA.
Ripple’s [XRP] price has trended downward in the last week. At $0.5 at press time, the token’s value dropped by 8% in the past seven days, according to CoinMarketCap’s data.
AMBCrypto found that this decline caused it to break below its 20-day Exponential Moving Average (EMA) on 7th June. This key moving average represents XRP’s average price over the past 20 days.
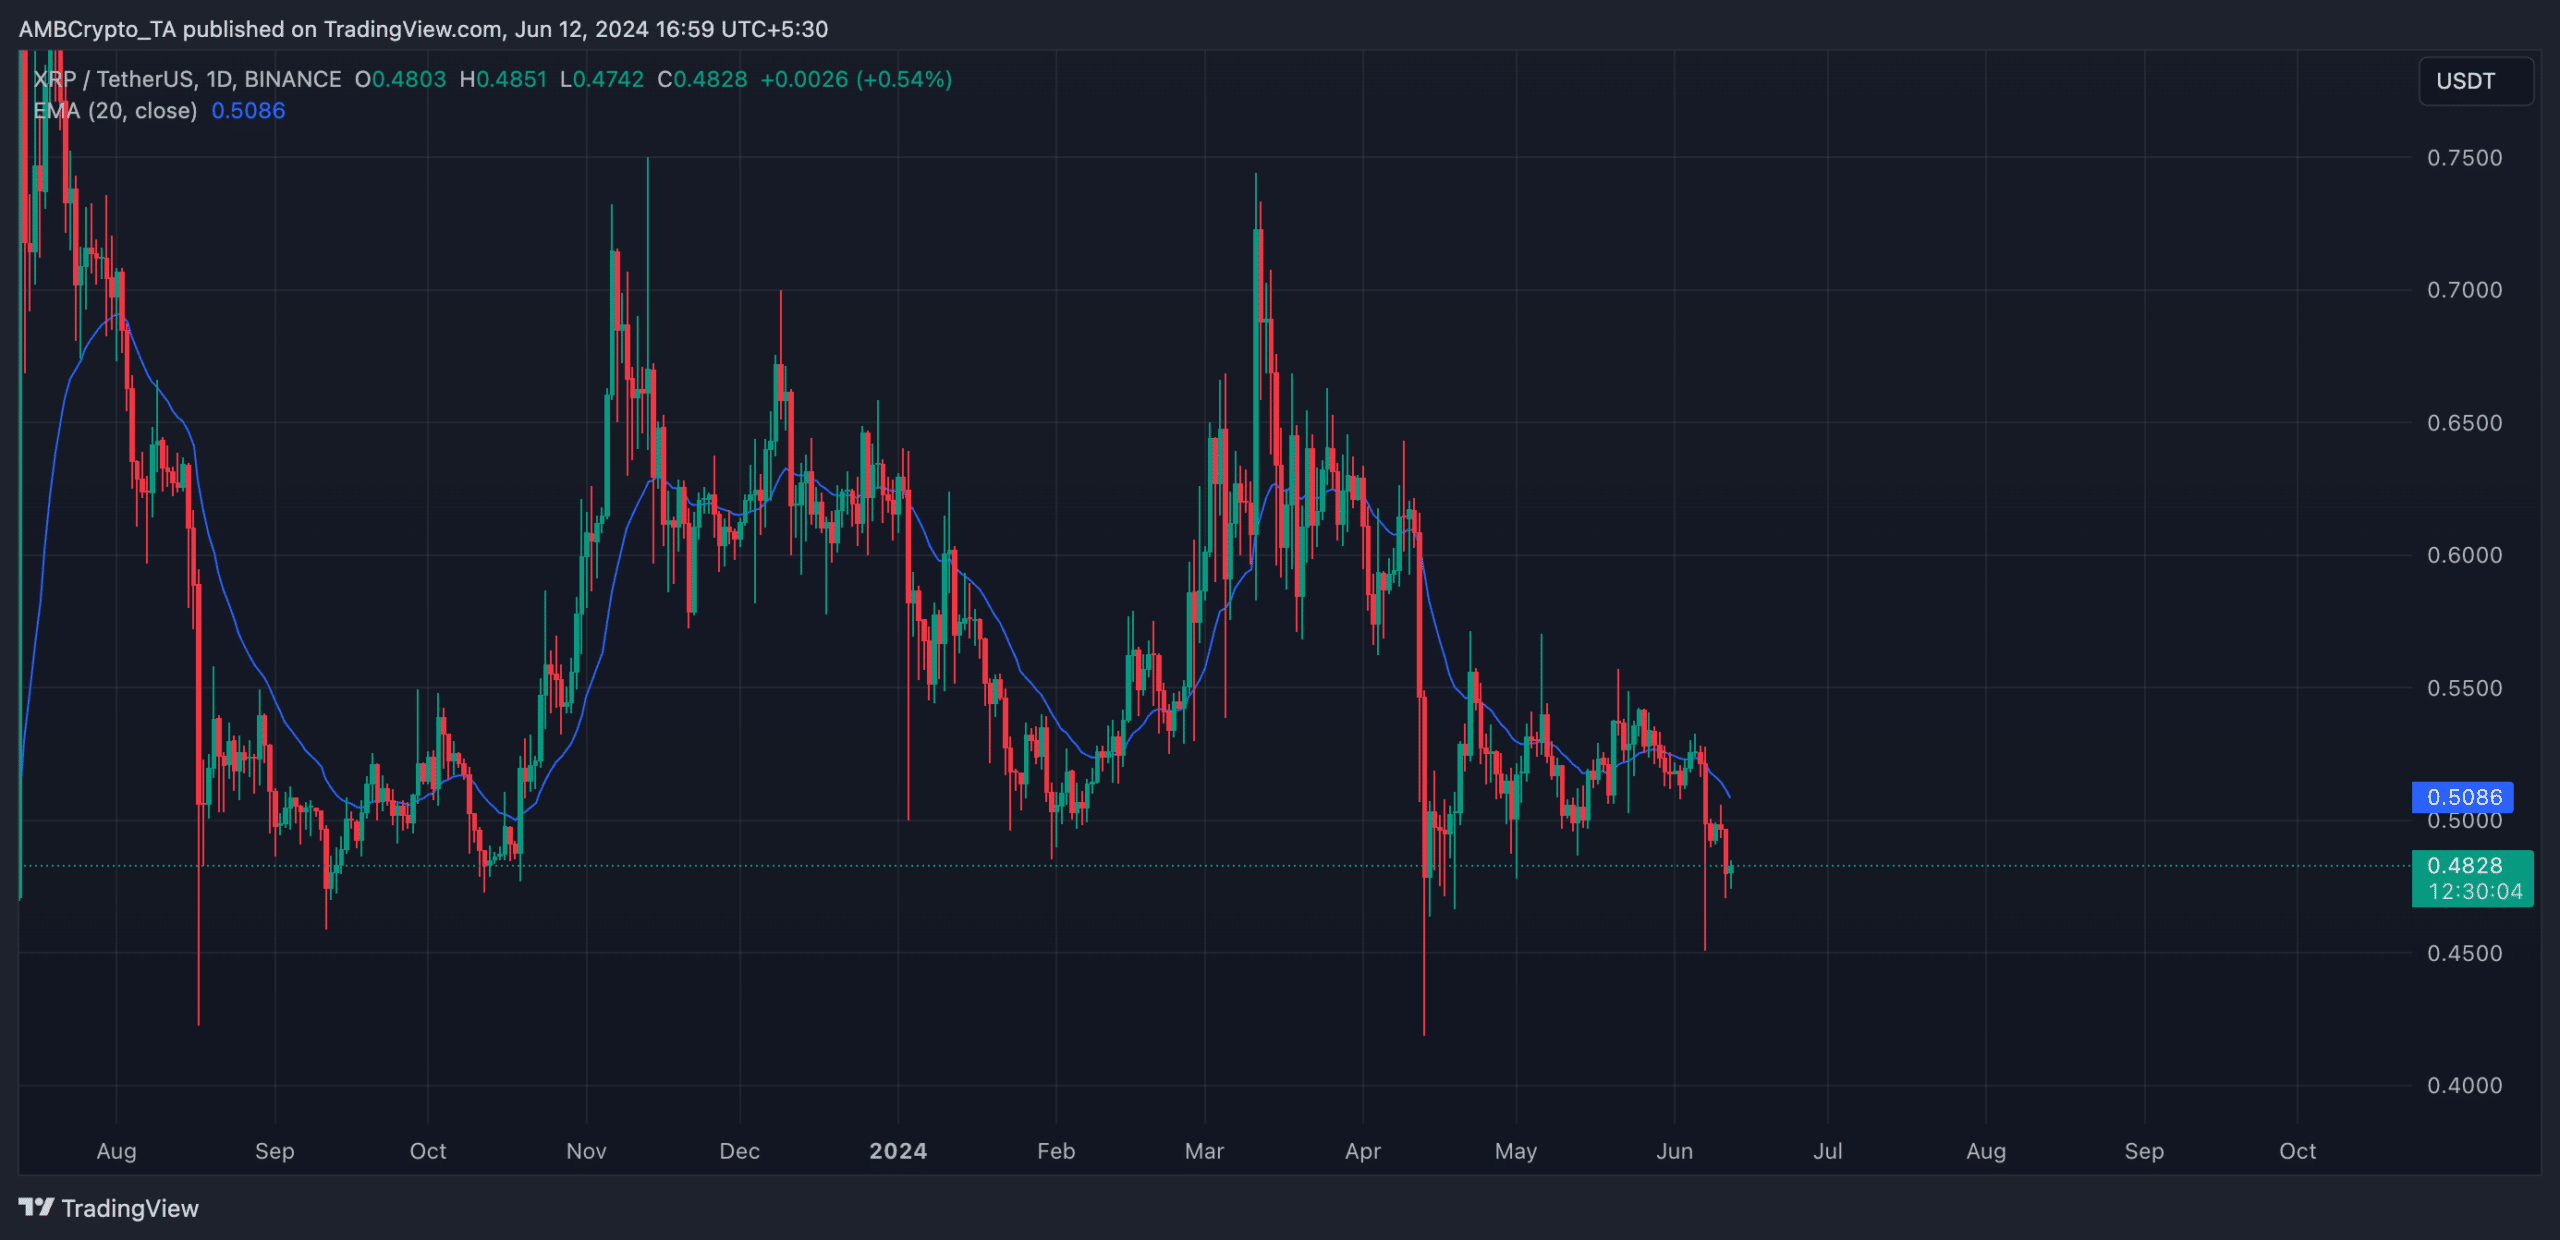
Source: TradingView
When an asset’s price falls below this level, it trades at a level lower than its average price in the past 20 days. It signals a decline in buying pressure and a rally in token sell-offs. It suggests a shift in sentiment from bullish to bearish.
XRP’s declining futures open interest confirms this. As of this writing, the token’s futures open interest was $525.57 million, falling by 20% since 6th June, according to Coinglass data.
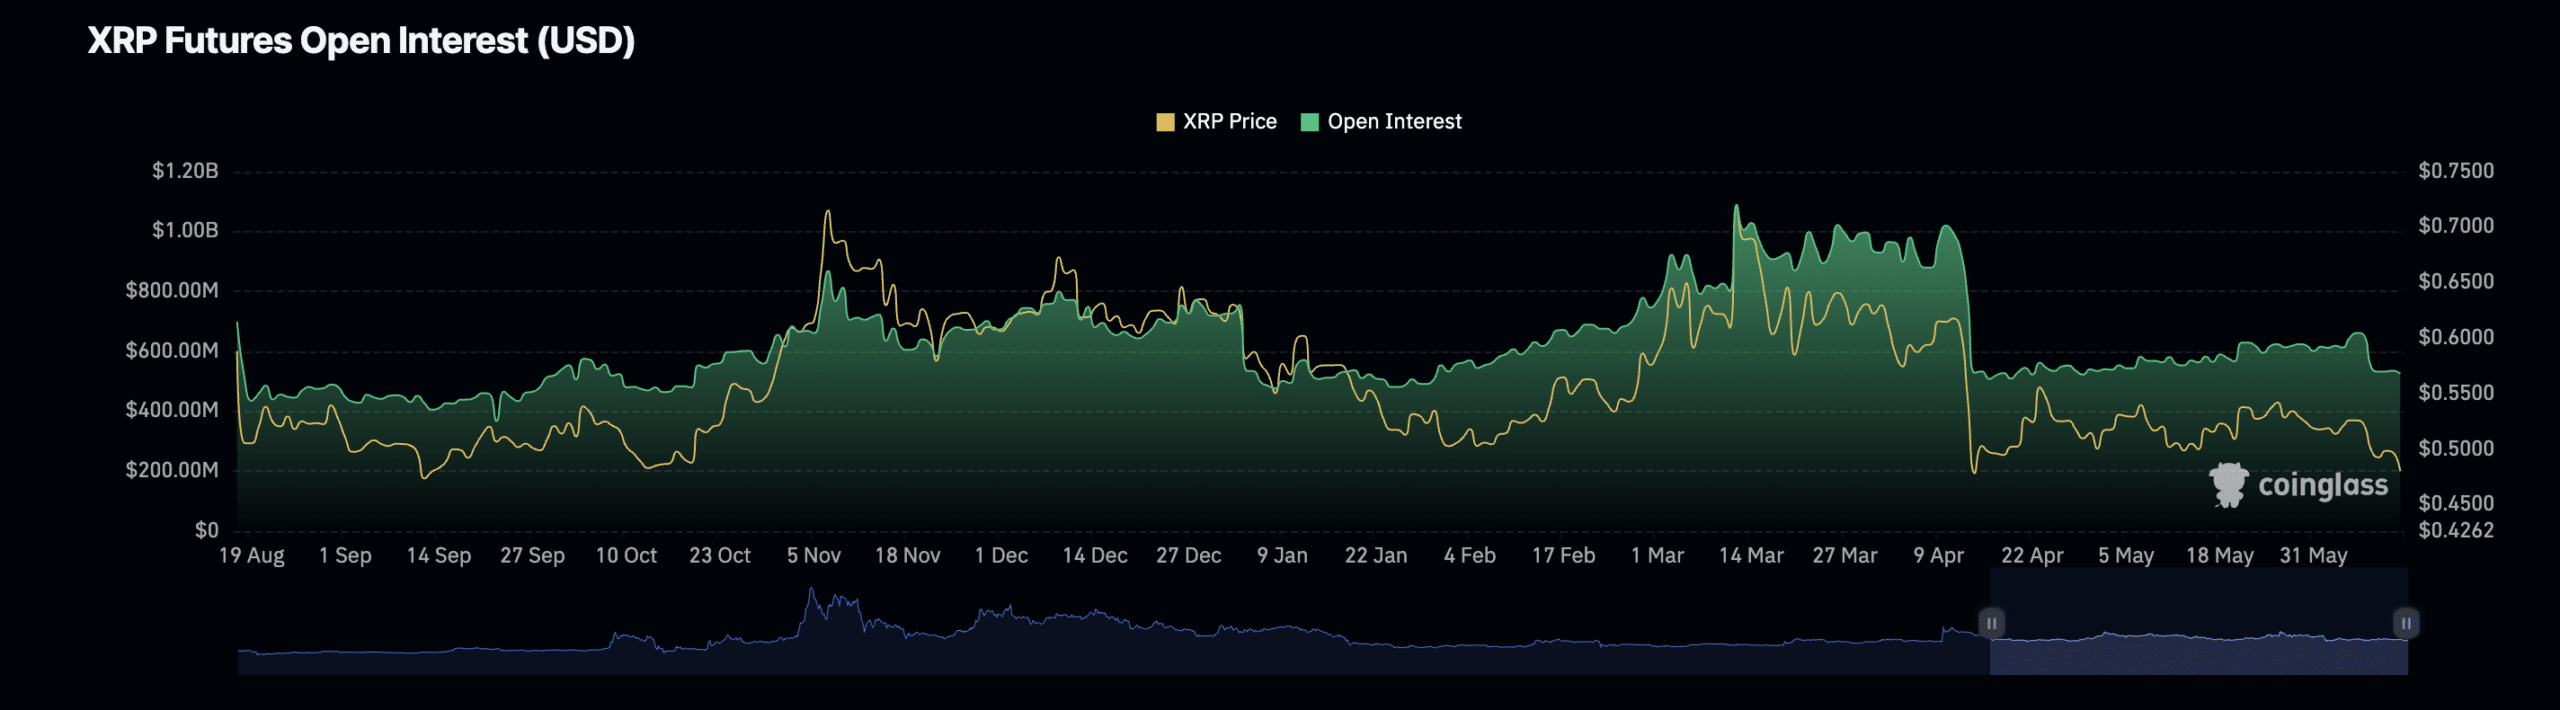
Source: Coinglass
XRP’s futures open interest tracks its outstanding futures contracts or positions that have not been closed or settled.
When it declines this way, it suggests a spike in the number of market participants exiting the market without opening new positions.
XRP selling momentum skyrockets
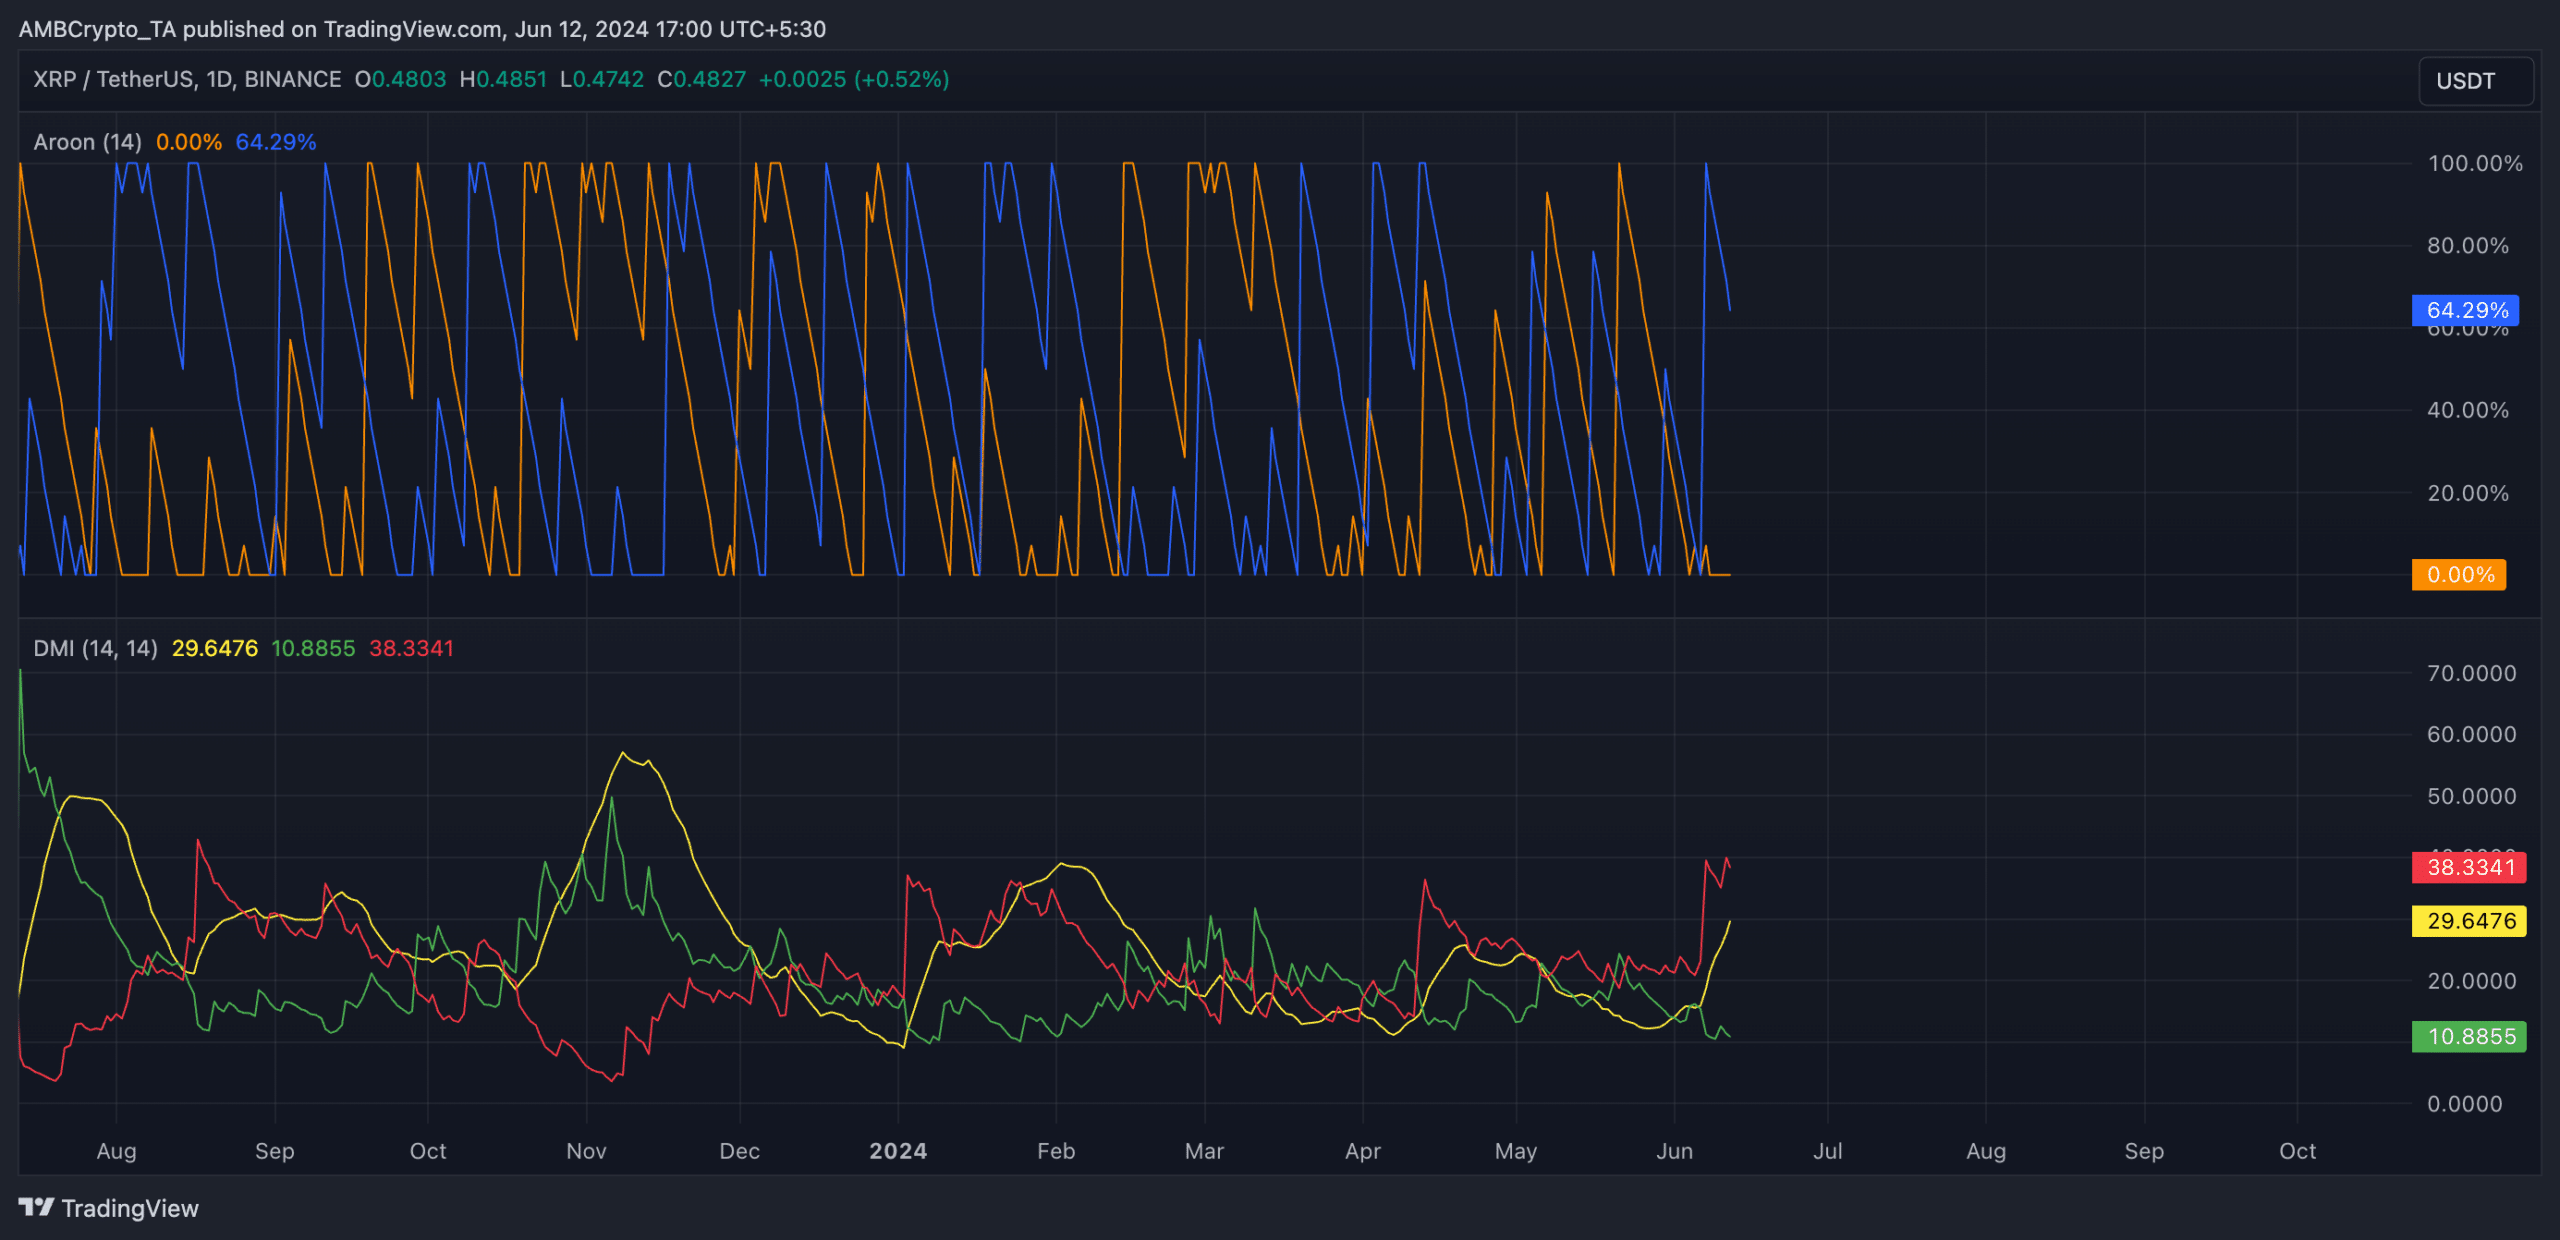
XRP’s Aroon Down Line (blue) was 64% at press time, confirming the strength of its current downtrend.
The indicator identifies an asset’s trend strength and potential price reversal points. When the Down Line is close to 100%, it suggests that the downtrend is strong and that the most recent low was reached relatively recently.
Further, XRP’s key momentum indicators rested below their respective neutral lines at press time. The token’s Relative Strength Index (RSI) was 35.12, while its Money Flow Index (MFI) was 37.87.
At these values, the momentum indicators showed that XRP traders favored sell-offs over accumulating new tokens.
In addition, according to XRP’s Directional Index (DMI), its positive directional index (green) rested below its negative index (red) at press time.
Realistic or not, here’s XRP’s market cap in BTC terms
Source: TradingView
An asset’s DMI measures the strength and direction of a market trend.
When the positive index crosses below the negative index, it confirms that the market is in a downtrend, with selling pressure surpassing buying pressure.