$15.86 or $17.54? Can DOT traders expect to see demand in the next week

Disclaimer: The findings of this analysis are the sole opinions of the writer and should not be considered investment advice.
In the hours prior to the time of writing, Bitcoin rallied sharply from $34.8k to $39k – but was unable to breach this resistance level despite pushing as far north as $39.8k. Following in its footsteps, Polkadot also saw a relief rally from the local lows at $14.2 and was trading at $16.08 during press time. However, the market structure remained bearish for Polkadot in the near term. Hence, shorting opportunities may present themselves, while a session close above $17.54 could present a shift in bias toward bullish.
DOT- 1H
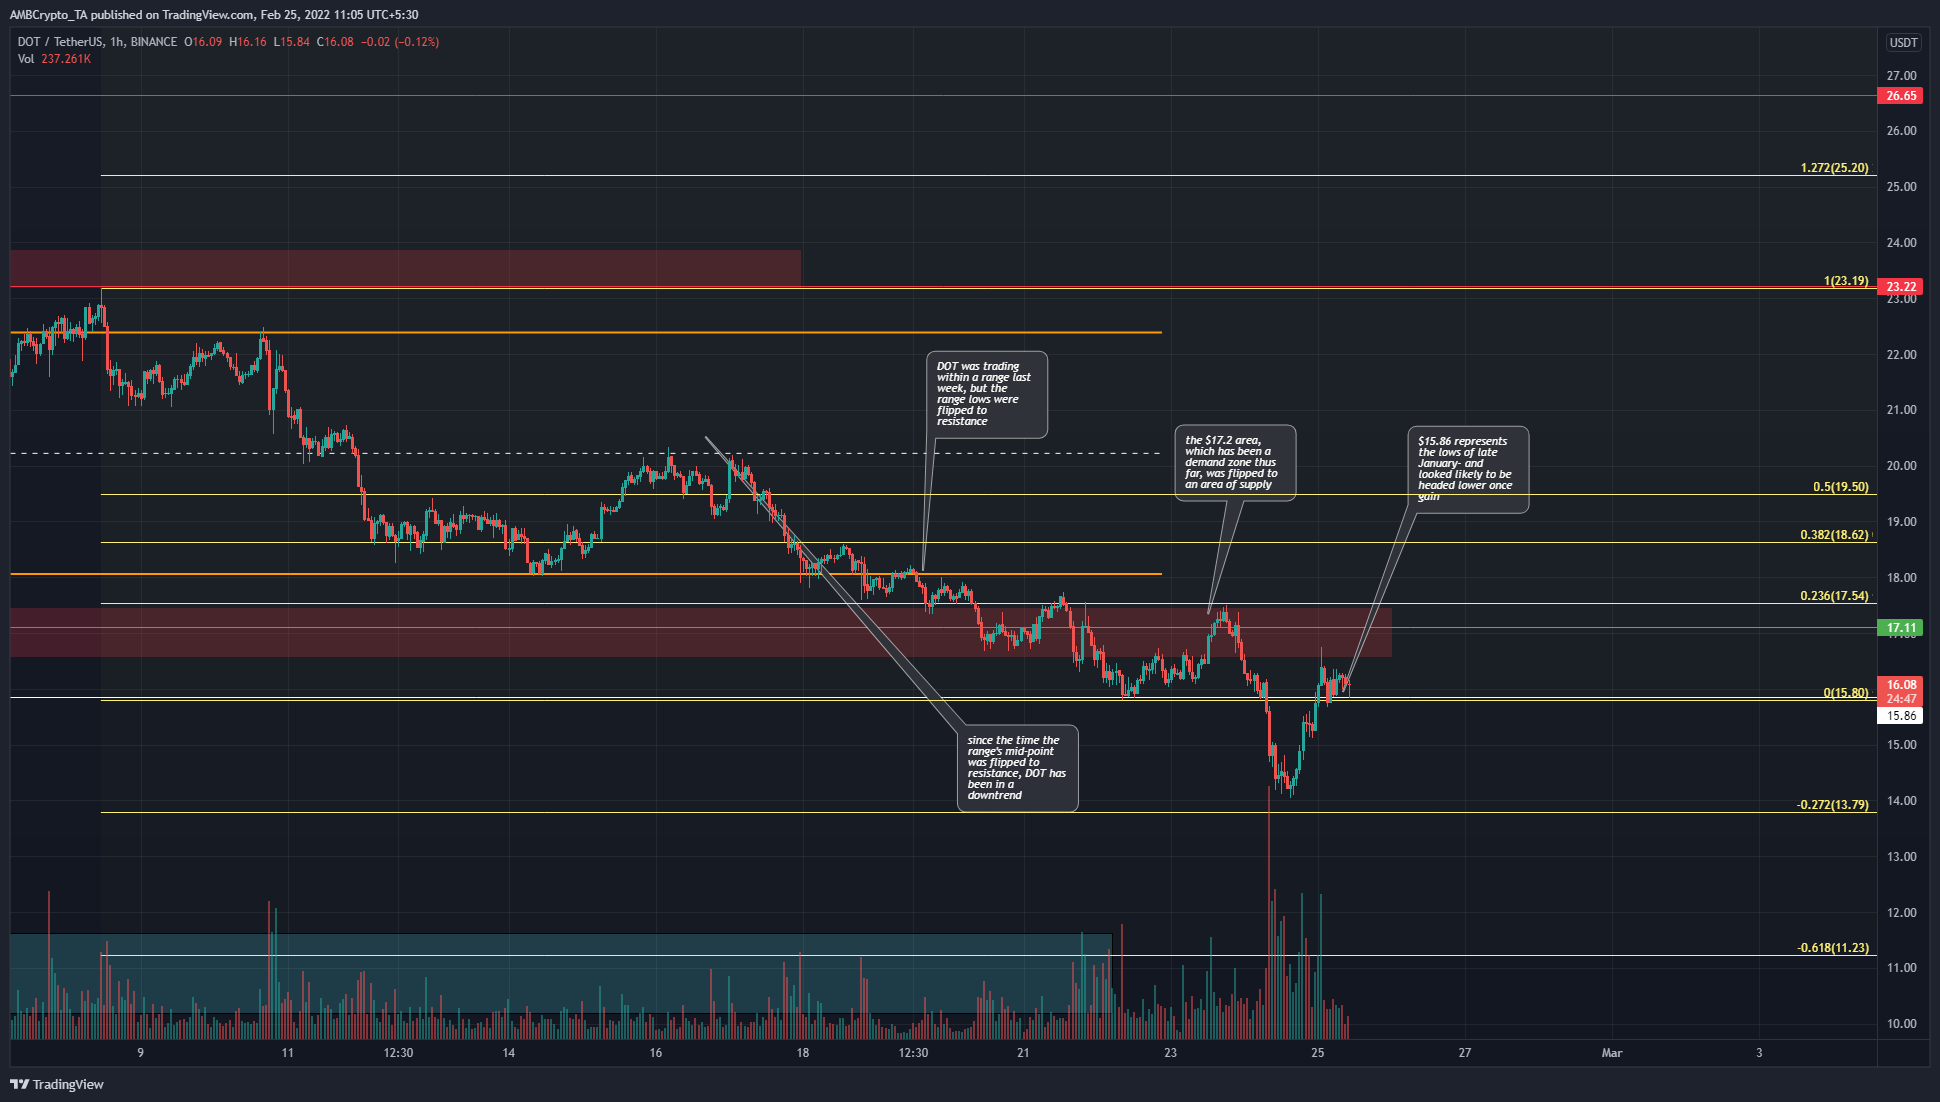
The short-term range that DOT was trading within about two weeks ago (orange) did not hold, and the range lows were flipped from support to resistance a week ago. Since then, DOT has registered a series of lower highs and lower lows on the charts.
Moreover, the price has tested the $16.6-$17.4 area multiple times to try and break above, but sellers have remained strong. This suggested that DOT’s move upward from $14.2 was likely only a move in search of liquidity before its next leg downward.
The Fibonacci retracement levels based on DOT’s move from $23.19 to $15.8 presented the 27.2% and 61.8% extension levels at $13.79 and $11.23. Also, the $15.86 has acted as support in the past few hours.
Rationale
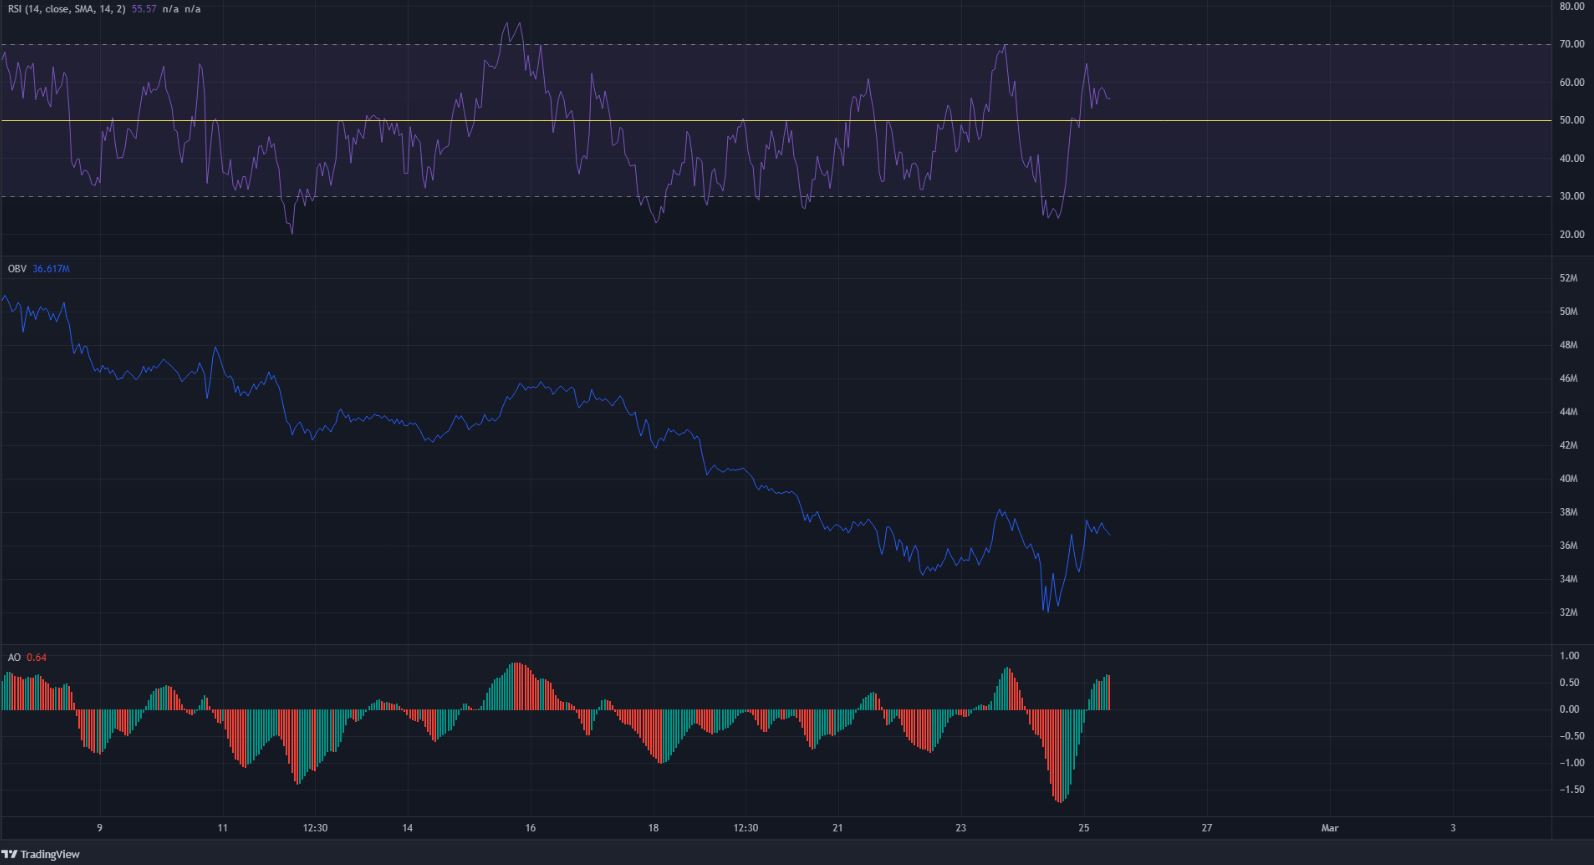
The RSI rose above neutral 50, while the Awesome Oscillator also surged above the zero line in the past few hours. This was in response to DOT’s nearly 15% gains in just over twelve hours. The OBV also saw a spike upward, but the downtrend on the OBV made it clear that selling volume has been dominant in recent weeks.
Conclusion
The indicators showed some response to the recent bounce for DOT, but the market structure remained bearish. A move to the $17.2 area could present a shorting opportunity. Similarly, if the price falls below $15.86 once again, entering short positions on DOT may be considered, targeting the $13.79 Fibonacci extension level. On the other hand, if DOT managed to reclaim $17.54 over the next few days, the possibility of a shift in momentum from bearish to bullish would arise.


