2.85M ASTER repurchased, but bearish structure keeps token trapped under $0.62
The local demand zone at $0.590 could be important for the Aster crypto price action in the coming days.



Aster [ASTER] was down 0.86% in the past 24 hours, while its daily trading volume rose by 16%. Over the past month, the DEX token has shed 5.29% in price.
The Aster buyback plan allocates 99% of the platform fees to ASTER token buybacks. The latest update showed that 2,851,653.28 ASTER has been purchased.
Scarcity is expected to drive prices higher. The wider staking narrative and negative spot netflows from exchanges reinforced this expectation.
However, ASTER has yet to turn bullish. Here’s what investors and swing traders will want to see happen on the price charts to shift their bias.
The long-term Aster crypto downtrend was unbroken
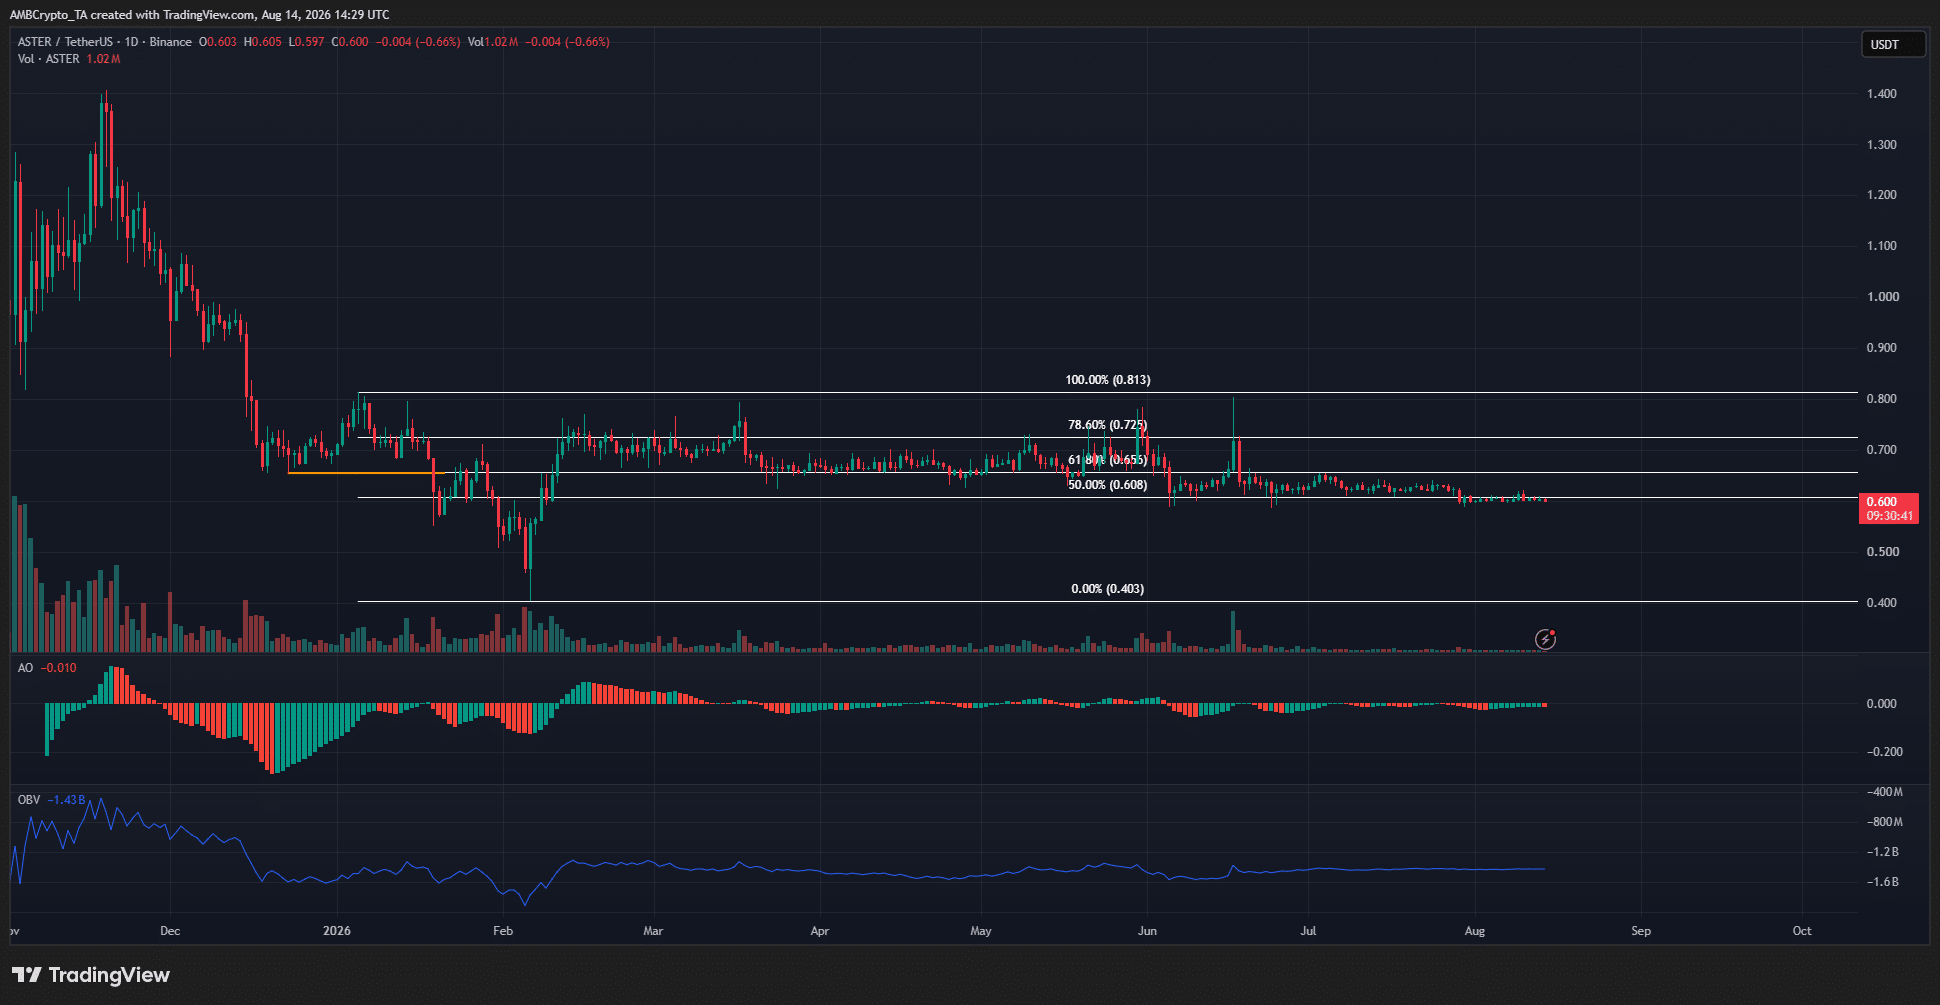
In early 2026, ASTER made a brief rally to $0.813, but sank to a low of $0.403 by February. Since then, the token has seen multiple price bounces into the $0.75-$0.80 supply zone.
These moves were only wicks on the 1-day timeframe. Aster crypto prices climbed toward the overhead supply zone during intraday trading but then faced a sell-off, which helped explain why the day’s close was much lower than the day’s bullish zenith.
In other words, the market has lacked bullish conviction throughout 2026. The price has hovered above the $0.60 support zone since late May, but over the past two weeks, it has fallen below this support, too.
At the time of writing, it tested this level as resistance.
The OBV has shown a slight uptrend since mid-June, but as the price action showed, the buying pressure has not been enough to break the bearish structure. The MACD showed slight bearish momentum underway.
Traders’ call to action- Watch out for a possible bounce
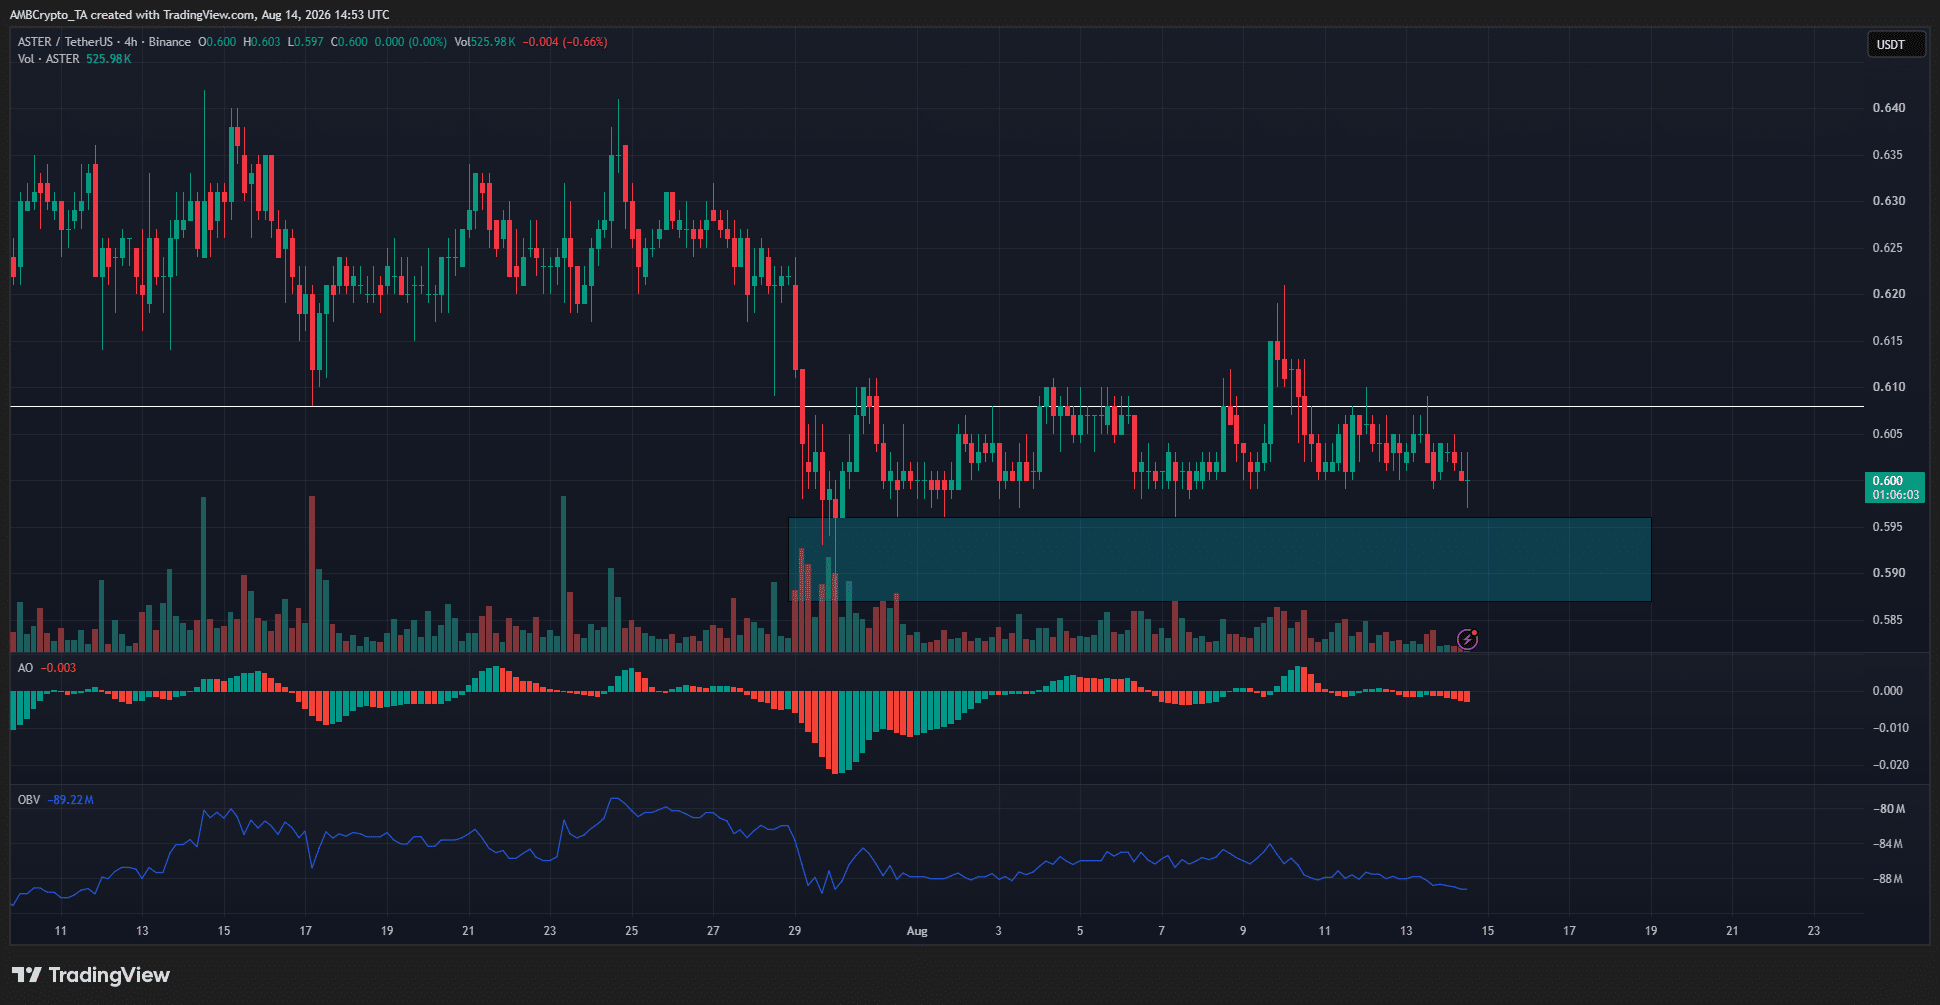
The $0.590-$0.595 is a local demand zone. At the same time, the $0.620 is a local supply. The Aster crypto price action has been sideways and unexciting in August. The OBV signaled increased selling pressure this week.
The momentum was also growing bearishly, the MACD showed.
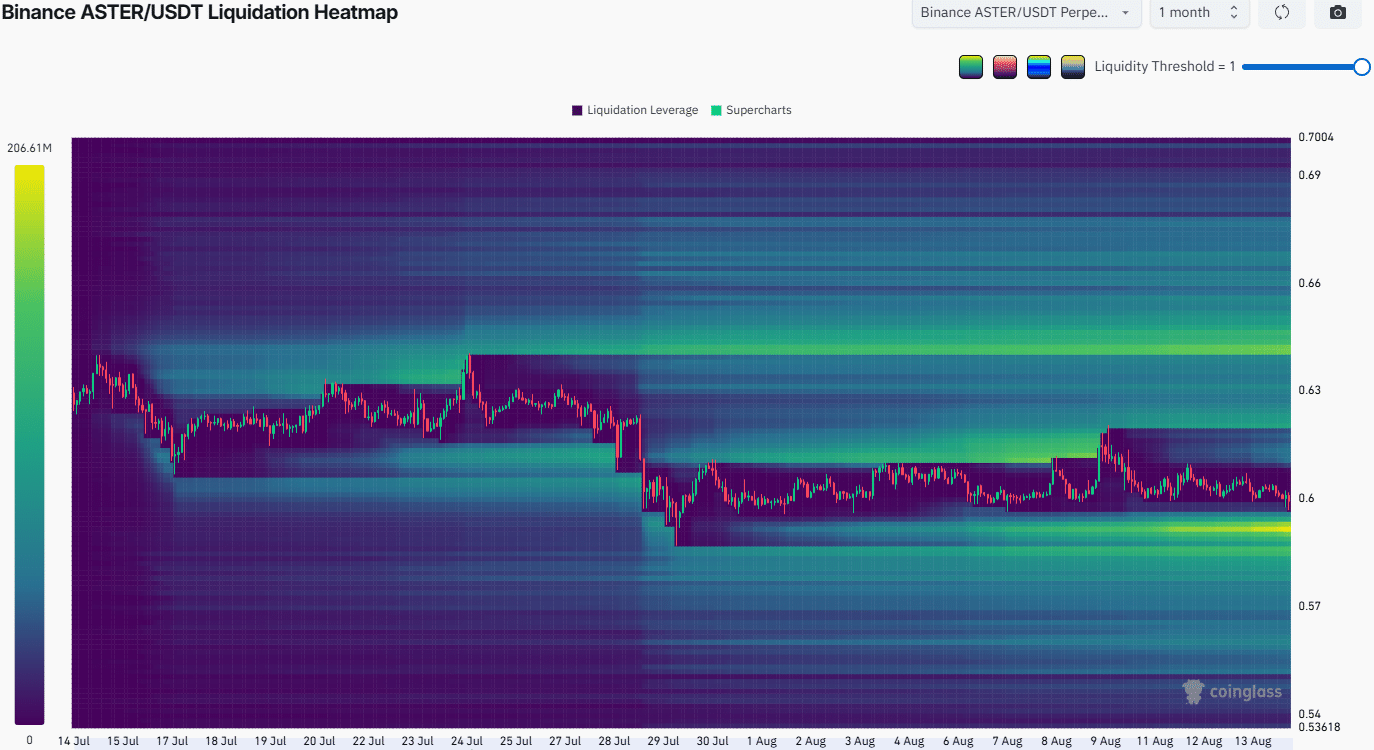
The cluster of long liquidations around $0.590 is likely to be targeted in the coming days. A liquidity sweep into this area, followed by a bounce, is a possibility.
However, if the spot buying remains weak, the move downward could transform into a bearish cascade and force ASTER into a new consolidation phase, with $0.60 as a local supply zone.
Final Summary
- The Aster crypto price action has tried and failed multiple times to enact a bullish breakout past the $0.80 supply zone throughout 2026.
- In the short-term, the $0.590 local demand zone and magnetic zone would be key in determining the next price move’s direction.