


- Shiba Inu’s burn mechanism continued to reduce inflationary pressure on the meme coin.
- The on-chain metrics spelled that holders were confident in SHIB once more.
Shibburn data showed that 52 million SHIB were burnt in the past 48 hours. This saw Shiba Inu’s [SHIB] 24-hour burn rate turn massively positive on the 18th of February, but the trend was quickly reversed.
At the time of writing, the daily burn rate was negative once again.
While the burn amount was an extremely tiny portion of the circulating supply, nevertheless, it highlighted the spirit of the Shiba Inu community. Other metrics also had a bullish tinge, as per AMBCrypto’s analysis.
Examining the supply scarcity and accumulation trends
The burn rate of a particular token is affected by various events, including donations, transactions, and burning events.
This is aimed at reducing inflationary pressure and increasing the token’s scarcity, and in turn, its value.
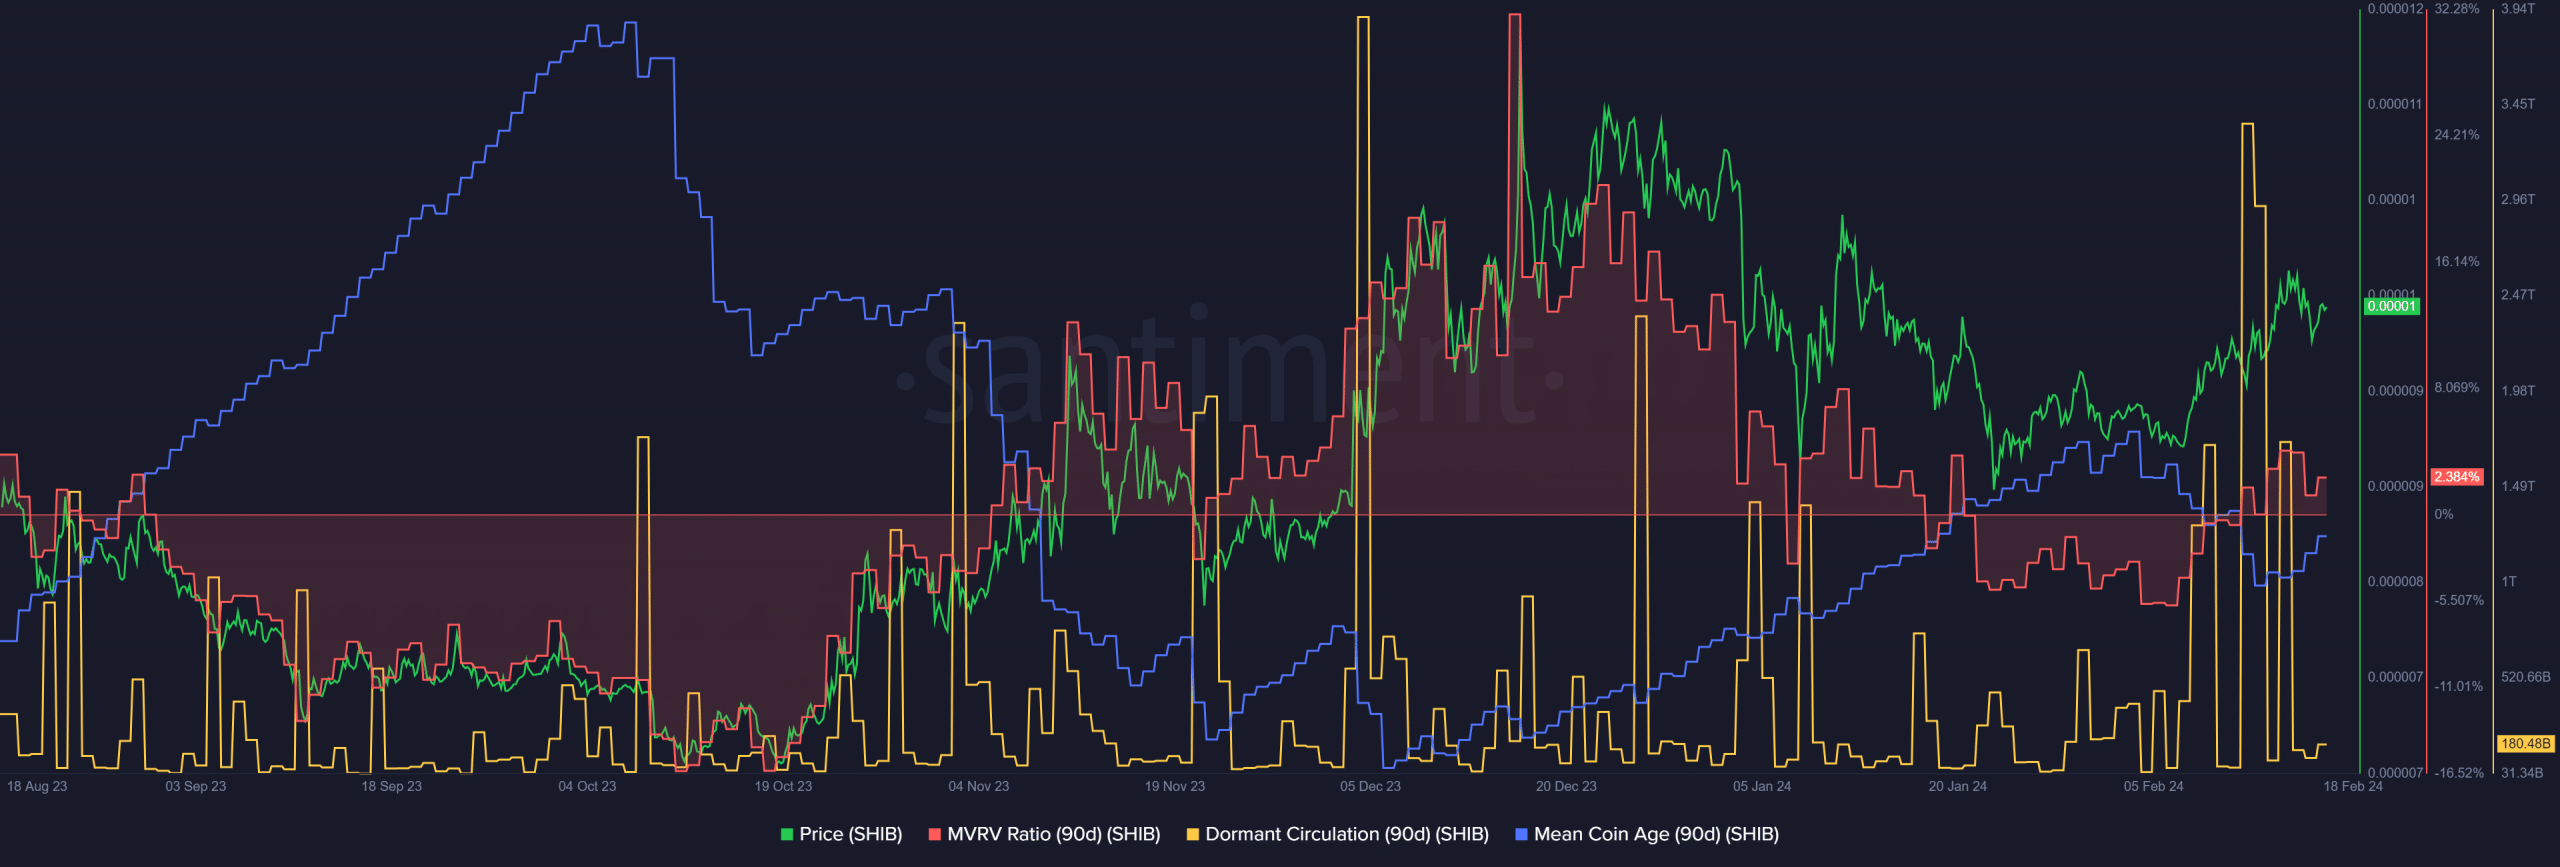
AMBCrypto also analyzed other relevant metrics on Santiment. The MVRV ratio climbed into positive territory over the past two weeks, reflecting the gains that SHIB witnessed.
The holders were at a profit once again, although it was nowhere close to the December highs.
The mean coin age saw a downtrend in early February, but the past few days saw this metric tick higher once again.
A continuation of this uptrend would be a strong sign of accumulation amongst holders, and would reinforce bullish expectations.
Moreover, the dormant circulation saw massive spikes on the 12th and 15th of February, which indicated that large amounts of the tokens were moved. This could precede a wave of selling.
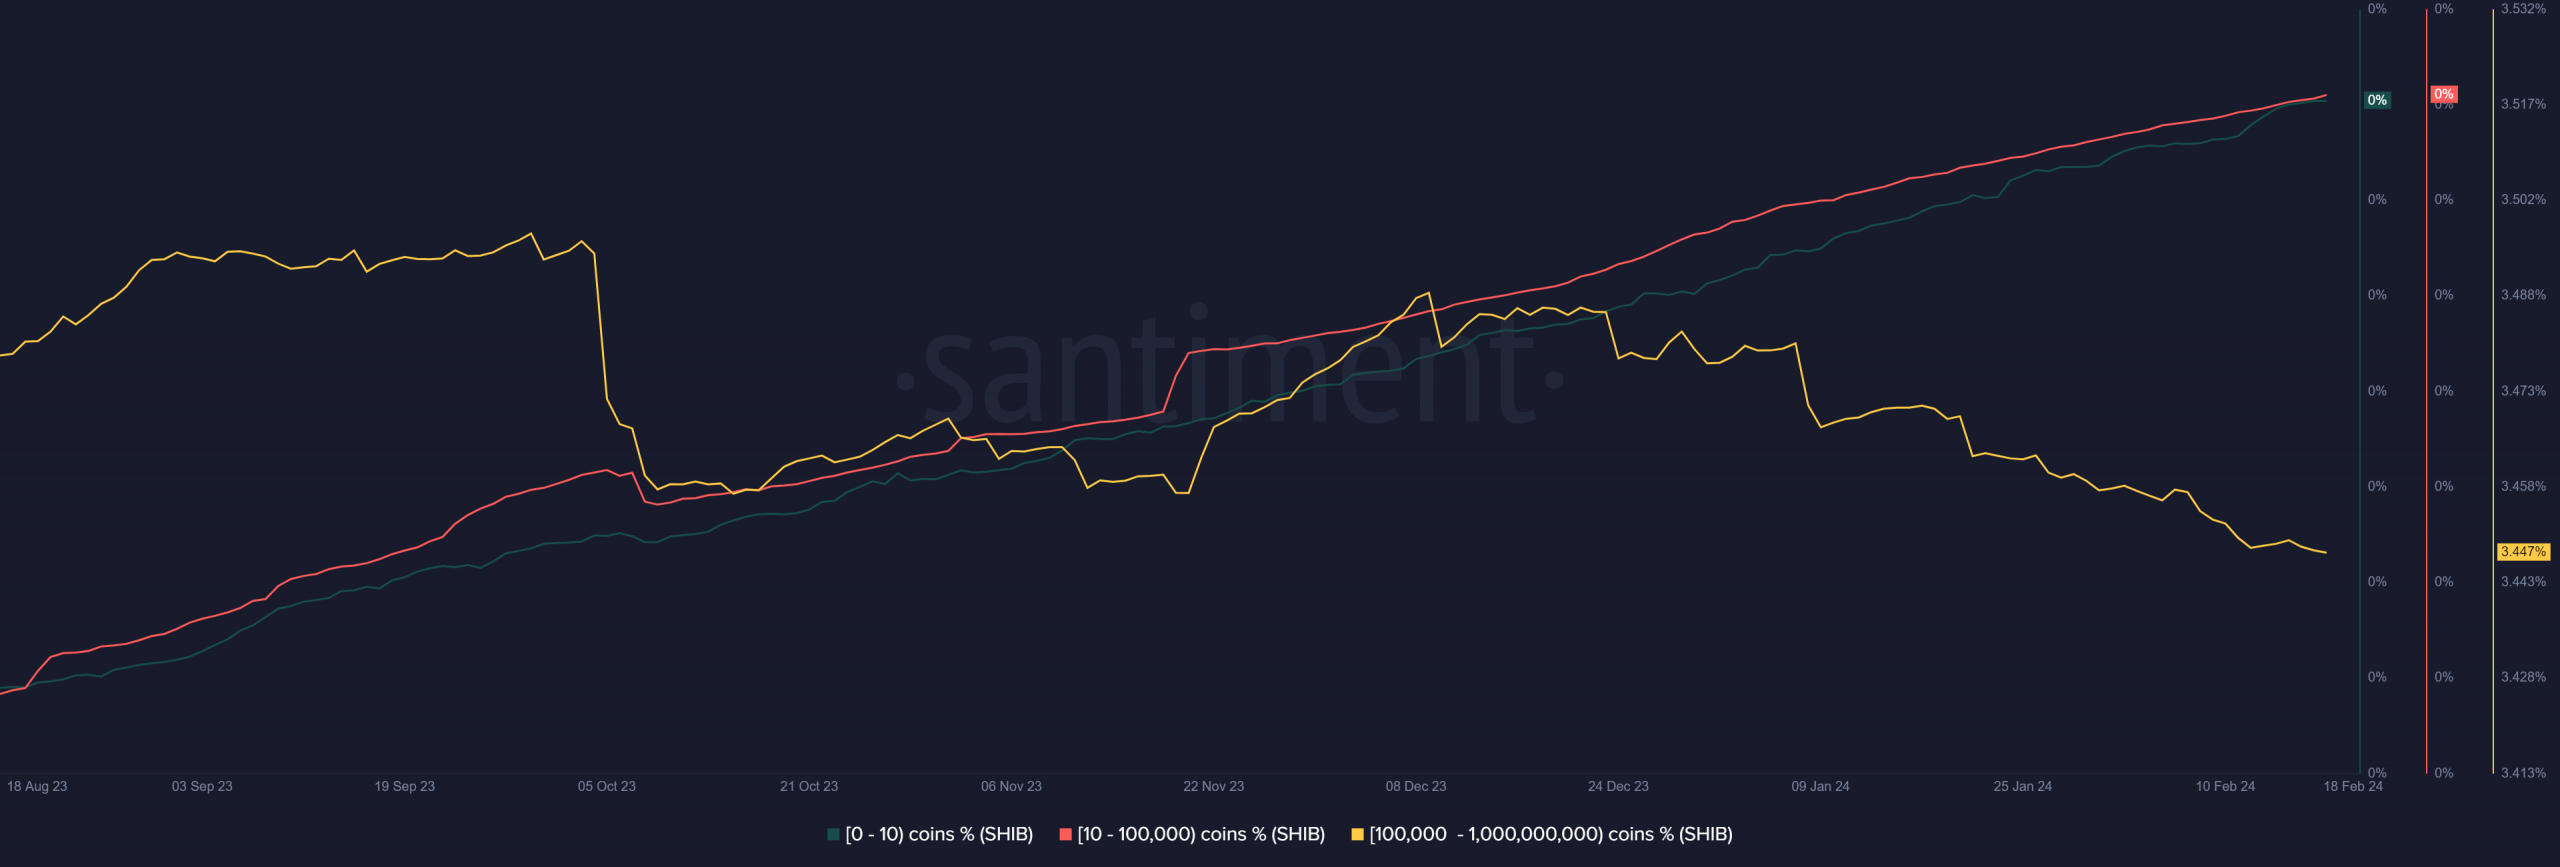
AMBCrypto’s analysis of the supply distribution added to the fears of continued selling. The 0-100k SHIB holders trended higher, but the 100k-1B holders trended downward since December.
The lack of accumulation in the past two months could be touted as a slight concern.
Takeaways from the price action
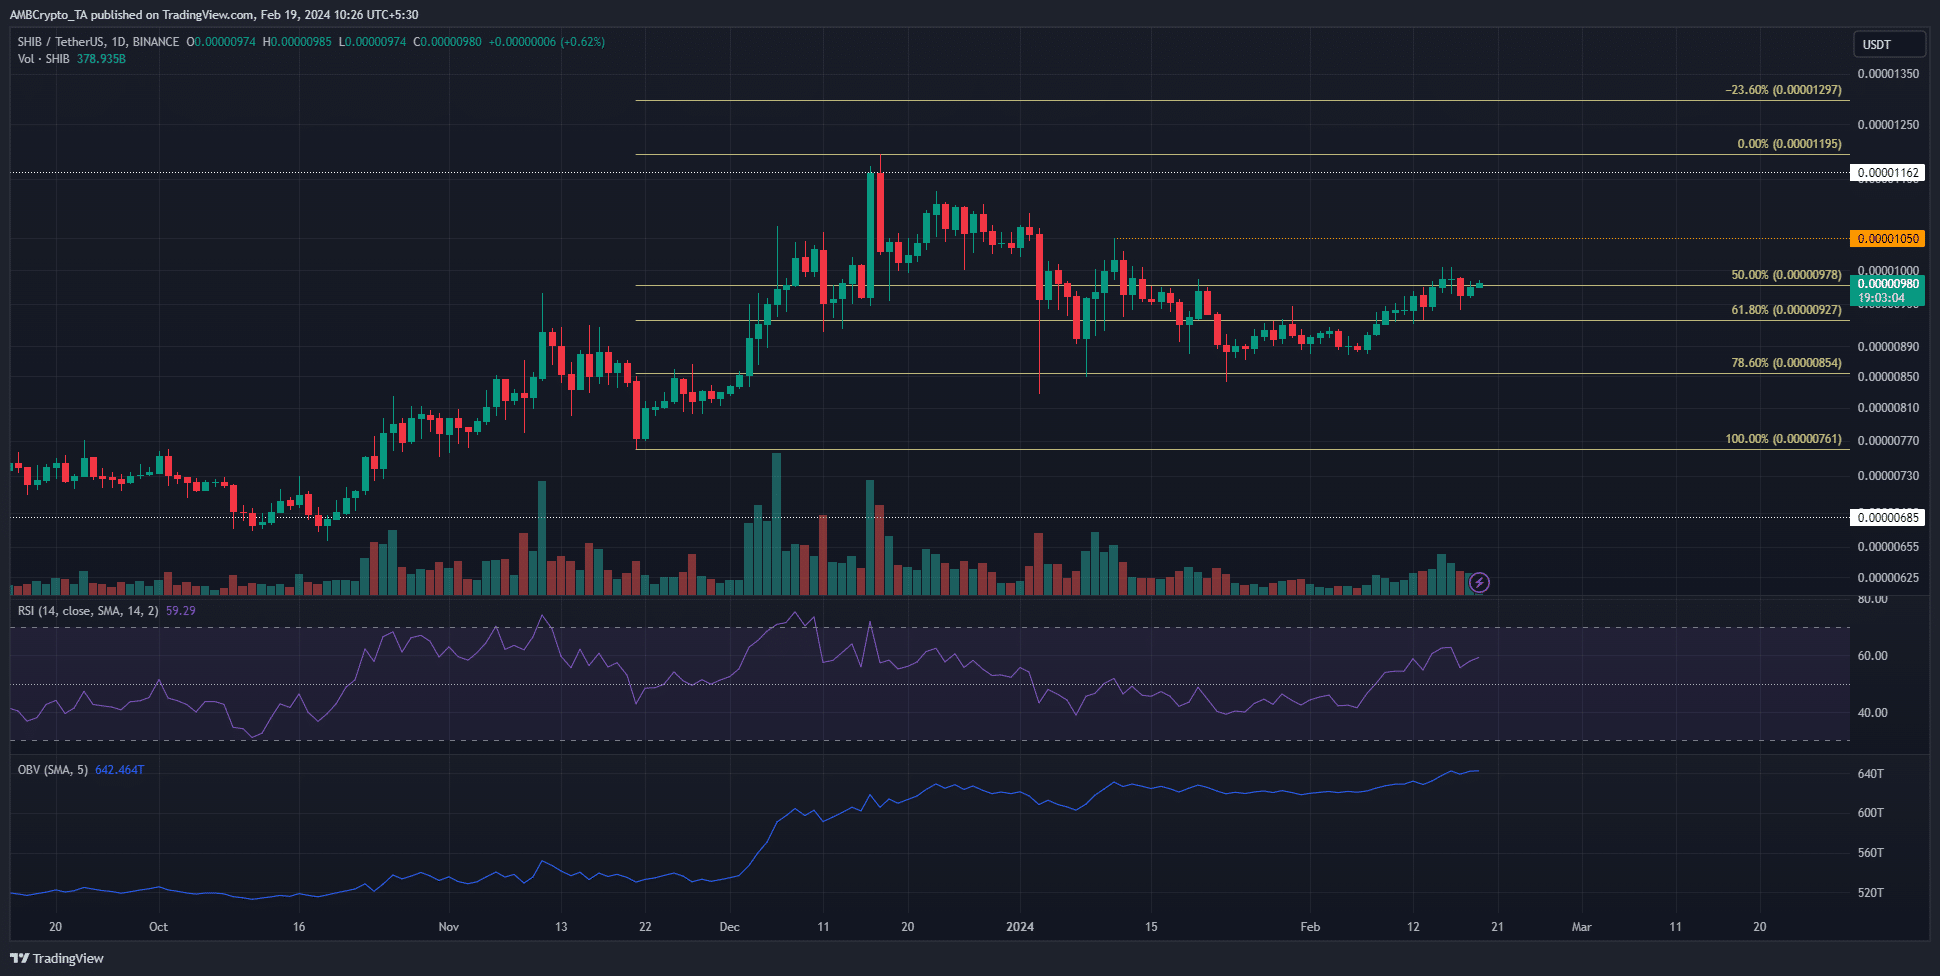
The one-day chart of Shiba Inu inspired some bullish confidence. The market structure and the RSI showed the buyers were in control. At the same time, the OBV also trended slowly higher over the past two weeks.
Realistic or not, here’s SHIB’s market cap in BTC’s terms
This signaled greater buying pressure, which could spur SHIB prices higher. As long as the token remains above the $0.00000927 mark, it is expected to climb past the local highs at $0.00001195.
This inference is based on the Fibonacci retracement levels (pale yellow).