

How U.S trade deals could shake up crypto prices!
Bitcoin
$68K or $74K: How Bitcoin’s next move depends on this key level
The coin’s next movement will rely on what happens at $69,330. But Bitcoin looks ready to favor bulls.


- The 1-hour chart showed that BTC formed an asymmetric triangle, suggesting a breakout
- If the price closes above the resistance, it could hit an all-time high soon.
Bitcoin’s [BTC] price seemed to have displayed two opposing signals. If one goes through, it could make way for a higher value. However, if the other comes first, holders of the coin would have to deal with a price decrease.
Analyst Ali Martinez made this known in two different posts on X. In his first post, Martinez mentioned that Bitcoin had formed an asymmetrical triangle on the 4-hour chart, indicating that the price could jump to $74,400.
It’s a breakout or breakdown
But there was one condition attached to it. The prediction might only come to pass if Bitcoin closes above the $69,330 resistance.
An asymmetrical triangle occurs when two trendlines with opposing slopes converge. A close above the upper resistance in this instance brings about breakout.
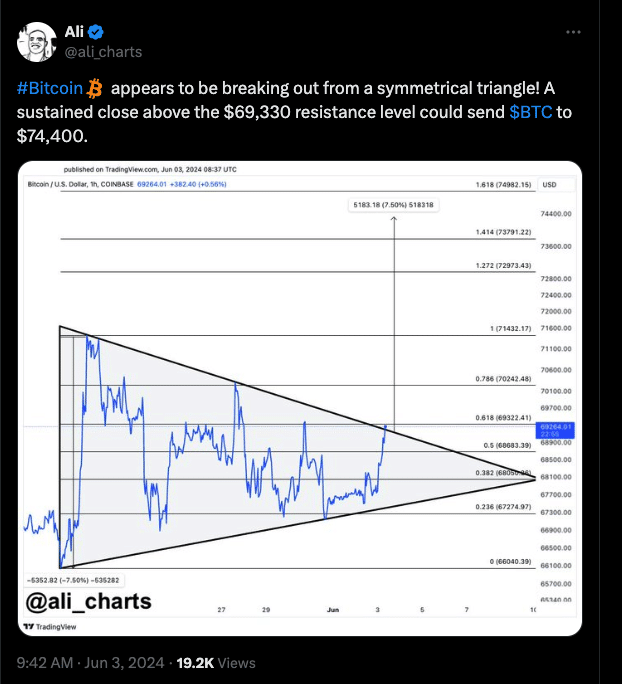
Source: X
On the other hand, if the price dumps into the support, a notable correction could be next. At press time, Bitcoin changed hands at $69,031, meaning it was close to the resistance point.
However, the analyst’s second post focused on the Tom DeMark (TD) Sequential. According to him, this indicator had flashed a sell signal which could send BTC down to $68,050.
Again, he mentioned that the next direction for the coin depends on the resistance as mentioned earlier. Beyond this technical data, it is also important to look at Bitcoin’s price action from an on-chain perspective.
One of the metrics AMBCrypto examined was the Coin Days Destroyed (CDD). This metric how far long-term coins are moving in large amounts.
HODLing continues as liquidity hunt begins
If the CDD is high, BTC might become extremely volatile, and selling pressure could cause a price decrease. This was the situation with Bitcoin on the 28th of May.
However, press time data showed that the CDD was down to 4.55 million. In this instance, long-term coins are not moving around as participants are sticking to holding.
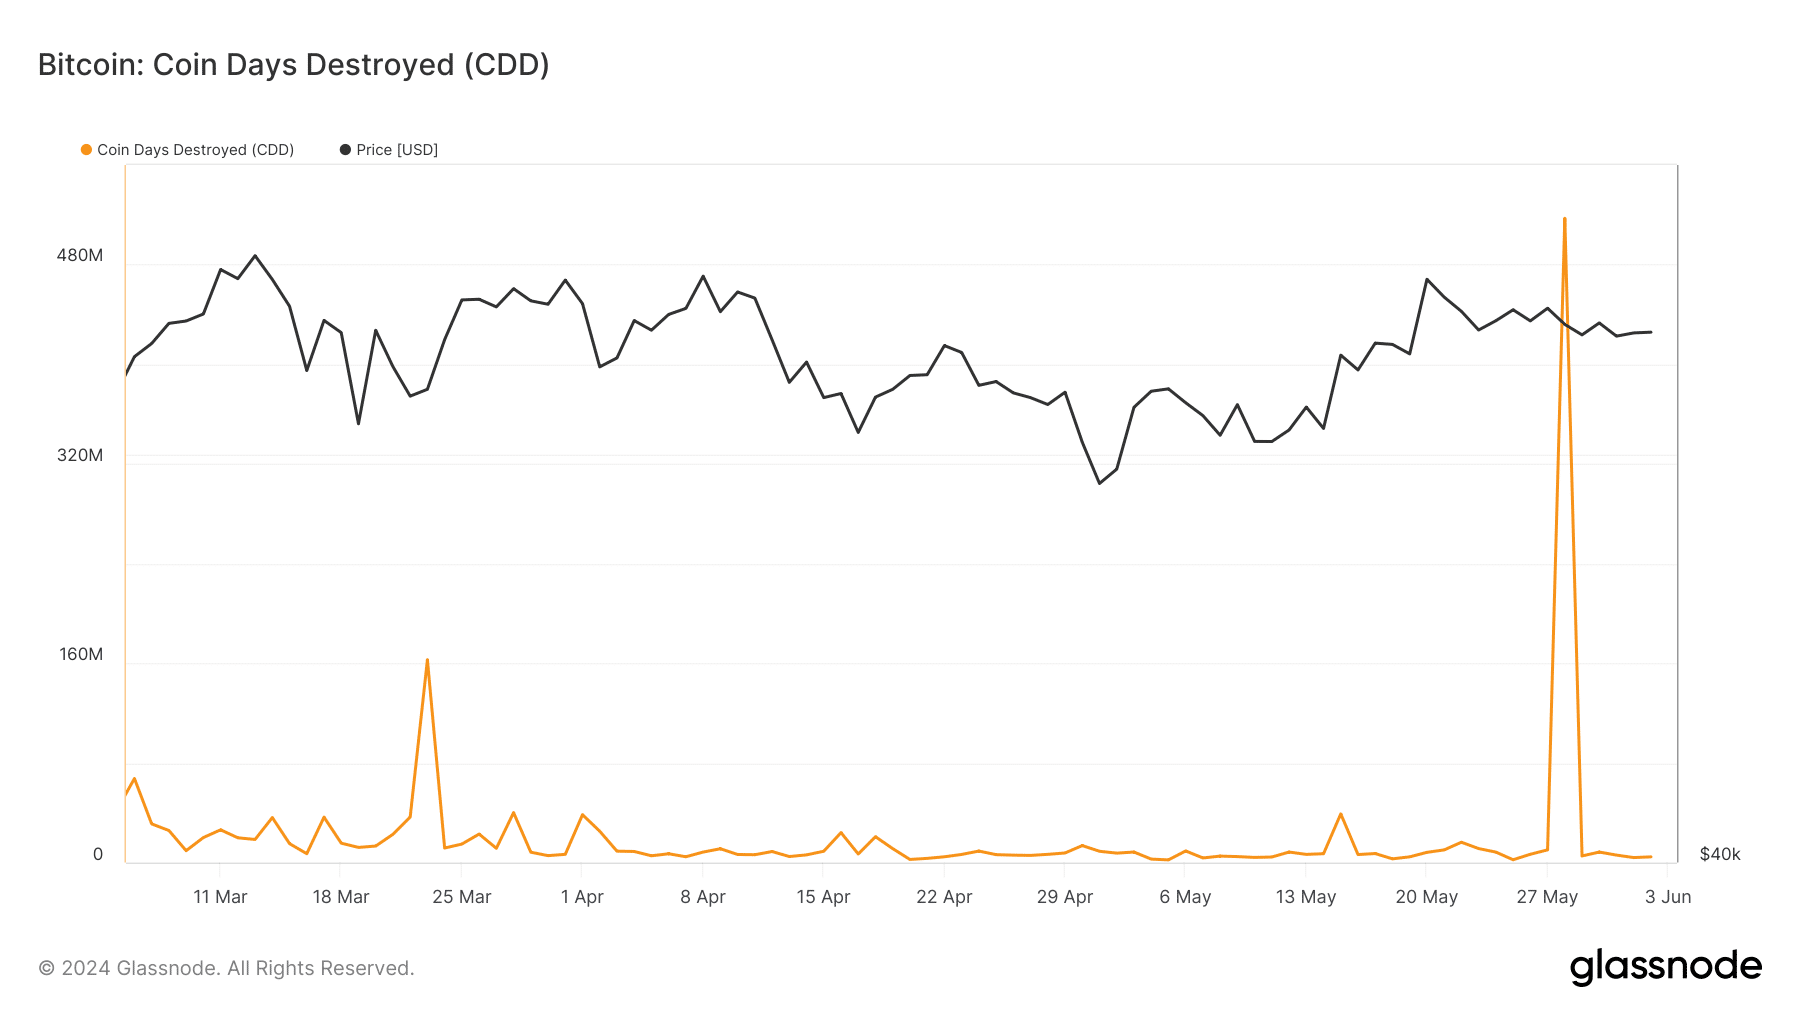
Source: Glassnode
If this continues, then the bullish prediction of $74,400 might triumph over the potential decline to $68,050. To buttress this point, AMBCrypto also looked at the liquidation heatmap.
The heatmap can help traders identify high areas of liquidity. And if there is a magnetic area, the price can rise in that direction. At press time, there was a high level of liquidity at $70,300, suggesting that Bitcoin could hit the price.
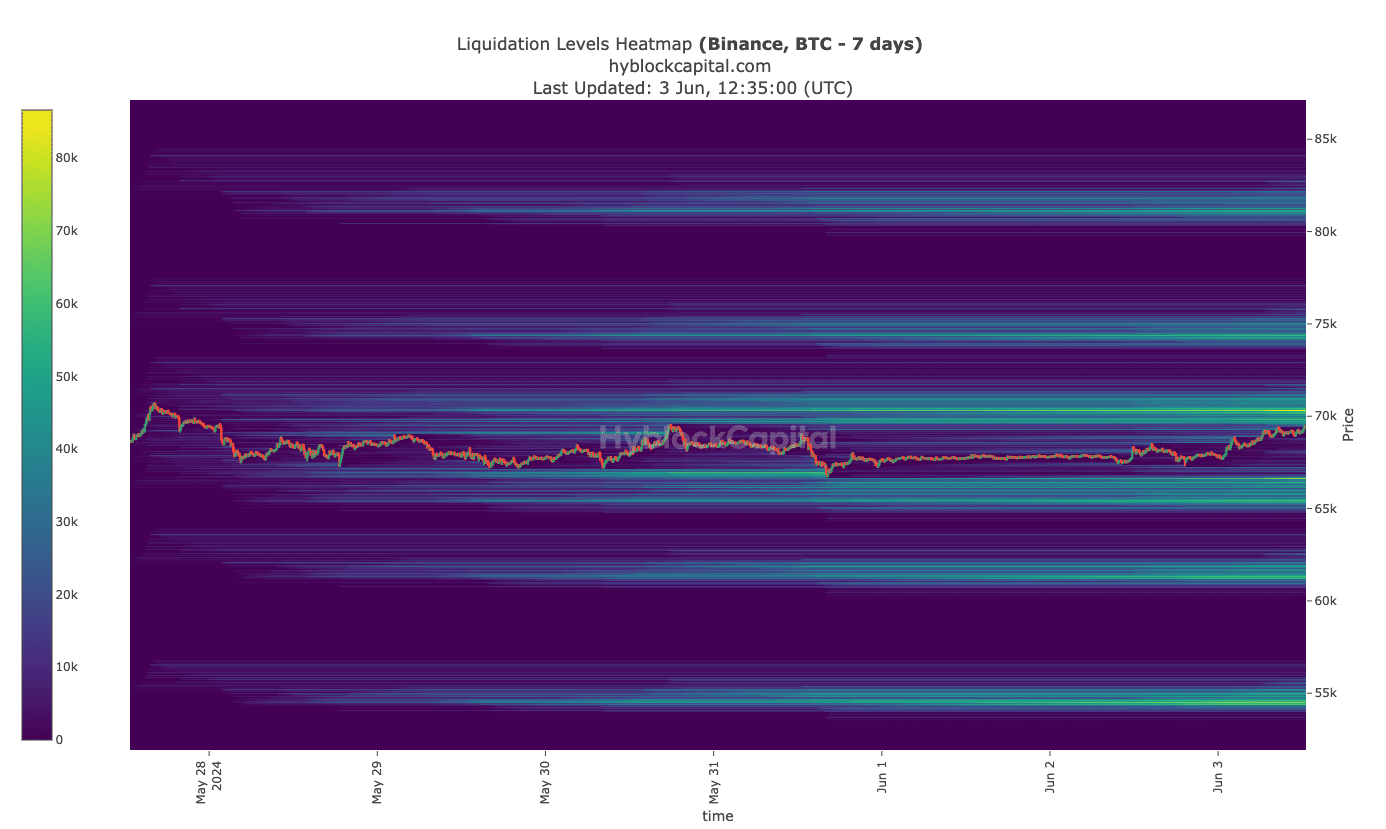
Source: Hyblock
Read Bitcoin’s [BTC] Price Prediction 2024-2025
If attained, this could lead to a breakout to $74,500 where another magnetic zone existed. However, if the uptrend gets rejected, Bitcoin could slump as low as $65,050.
But by the look of things and metrics analyzed, BTC looks set to climb above $74,000.


