83 days since Bitcoin halving – Why BTC’s price hasn’t surged yet!

- Even though the price has decreased, data showed BTC has not yet hit its bottom.
- A deep-dive showed that the coin can reach $64,688 as long as demand increases.
It’s been 83 days since the prestigious Bitcoin [BTC] halving event, yet the coin has not displayed any glimpse of its traditional post-halving rally. This year, the halving, which reduces the coins created and miners’ rewards, took place on the 19th of April.
During that period, Bitcoin’s price changed hands around $63,976. This was after it hit an all-time high of $73,750 in March. As expected, the broader market took the event as a crucial one to drive higher BTC prices.
Patience is the name of the game
About a month later, BTC retested $71,000. But it did not take long for the price to retrace. 83 days since the Bitcoin halving, the price of the crypto has undergone notable corrections, and lose about 12.76% of its value.
While Bitcoin historically goes through a downturn after the halving, this one seems to be extraordinary. Notably, this is because the price action has been underwhelming for about three months.
At press time, BTC’s price was $57,908. According to AMBCrypto’s analysis of the Puell Multiple, the anticipated bull run might not be here yet.
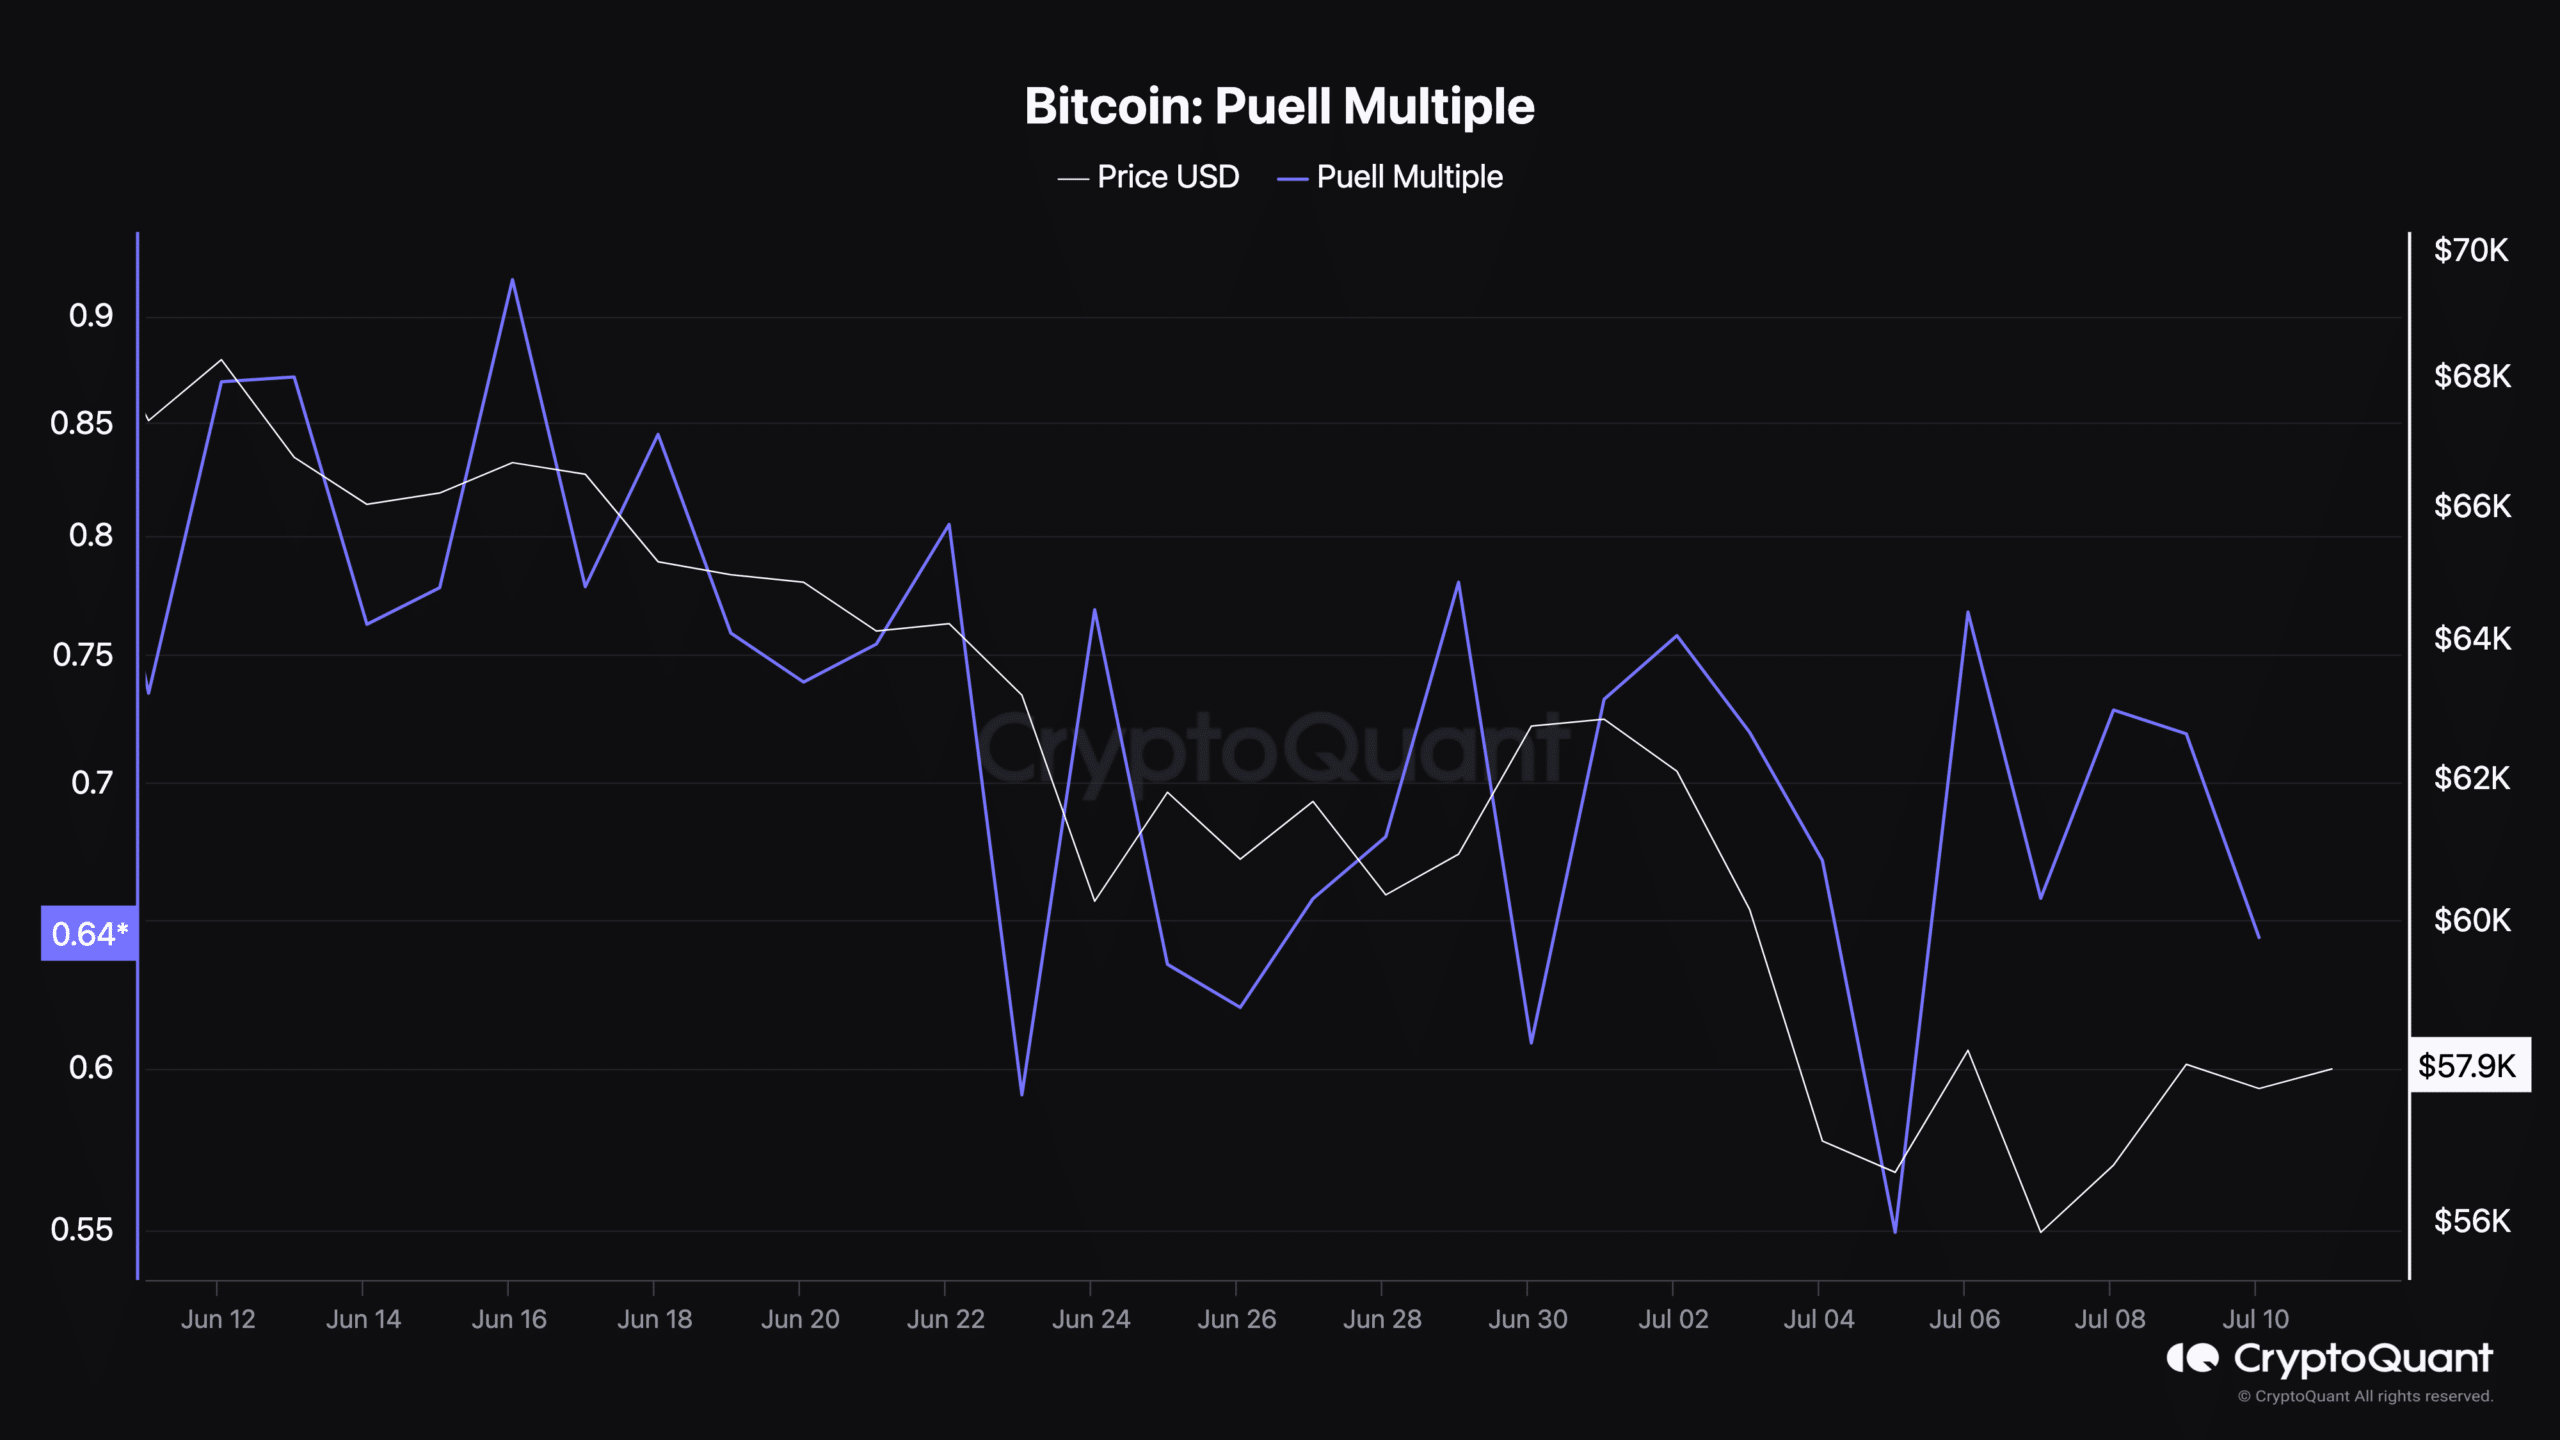
Puell Multiple shows the difference between the short-term Bitcoin miners revenue and that of the long term. It does this by dividing the daily issuance of BTC by the 365-day issuance.
Typically, if the ratio is between 1 and 6, it means that prices are higher. Values over 6 indicate that the price might have hit the top.
On the other hand, if the Puell Multiple is lower than 1, it indicates that prices are down with values lower than 0.40 suggesting the bottom.
According to CryptoQuant, Bitcoin’s Puell Multiple was 0.64, indicating that correction is still ongoing. However, if the ratio reaches 0.40, it could indicate a bottom for Bitcoin, and a rebound could be next.
However, it is noteworthy to mention that it could take another month or so for Bitcoin to reach its bottom. If this is the case, the bull run might not happen until the start of the fourth quarter (Q4) or close to the end of Q3.
HODLers won’t just give up
But it is also important to note that things can change quickly. Should this happen and demand increases, AMBCrypto’s prediction of $75,000 by the end of July could come to pass.
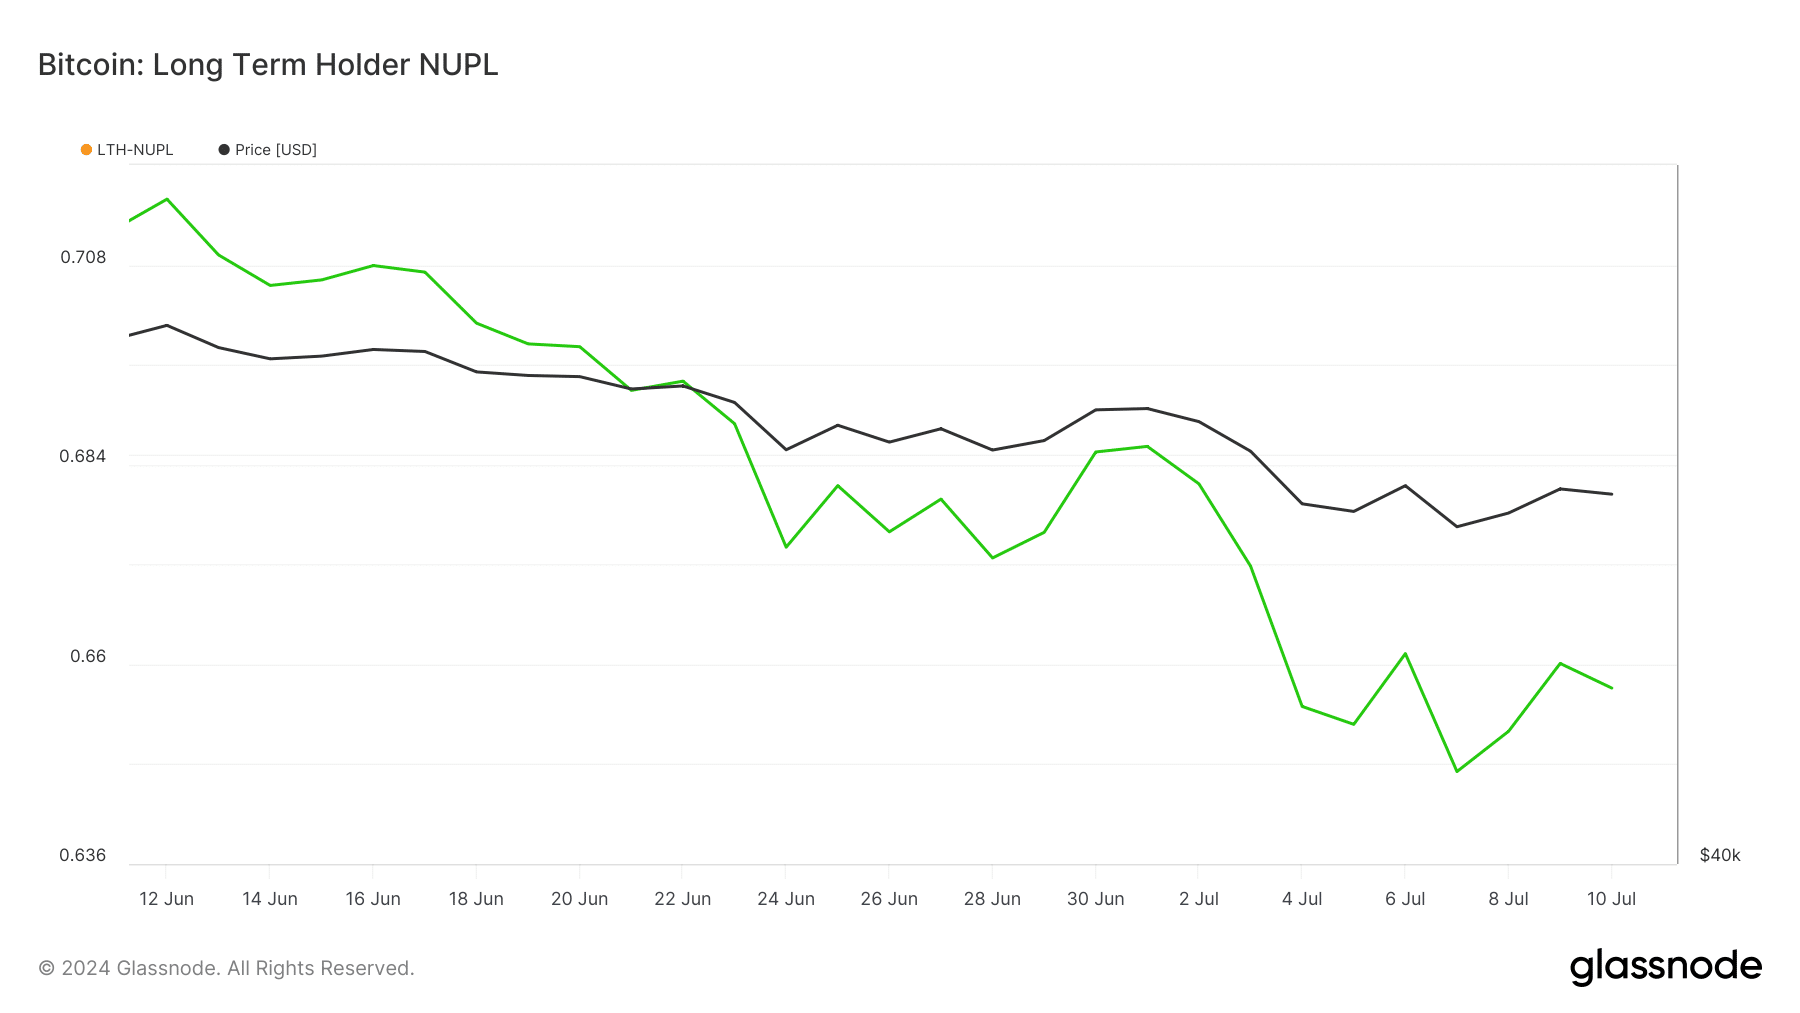
Despite the unimpressive price action since the halving, long-term holders are showing confidence in the coin’s potential. We observed this after examining the LTH-NUPL.
LTH-NUPL stands for Long Term Holder- Net Unrealized Profit/Loss. This on-chain metric analyzes the behavior of Bitcoin holders who have owned the coin for at least 155 days.
According to Glassnode, the LTH-NUPL was in the green zone, indicating belief in the long-term potential of BTC. Should this remain the same going forward, demand for Bitcoin might increase, possibly pushing the price higher.
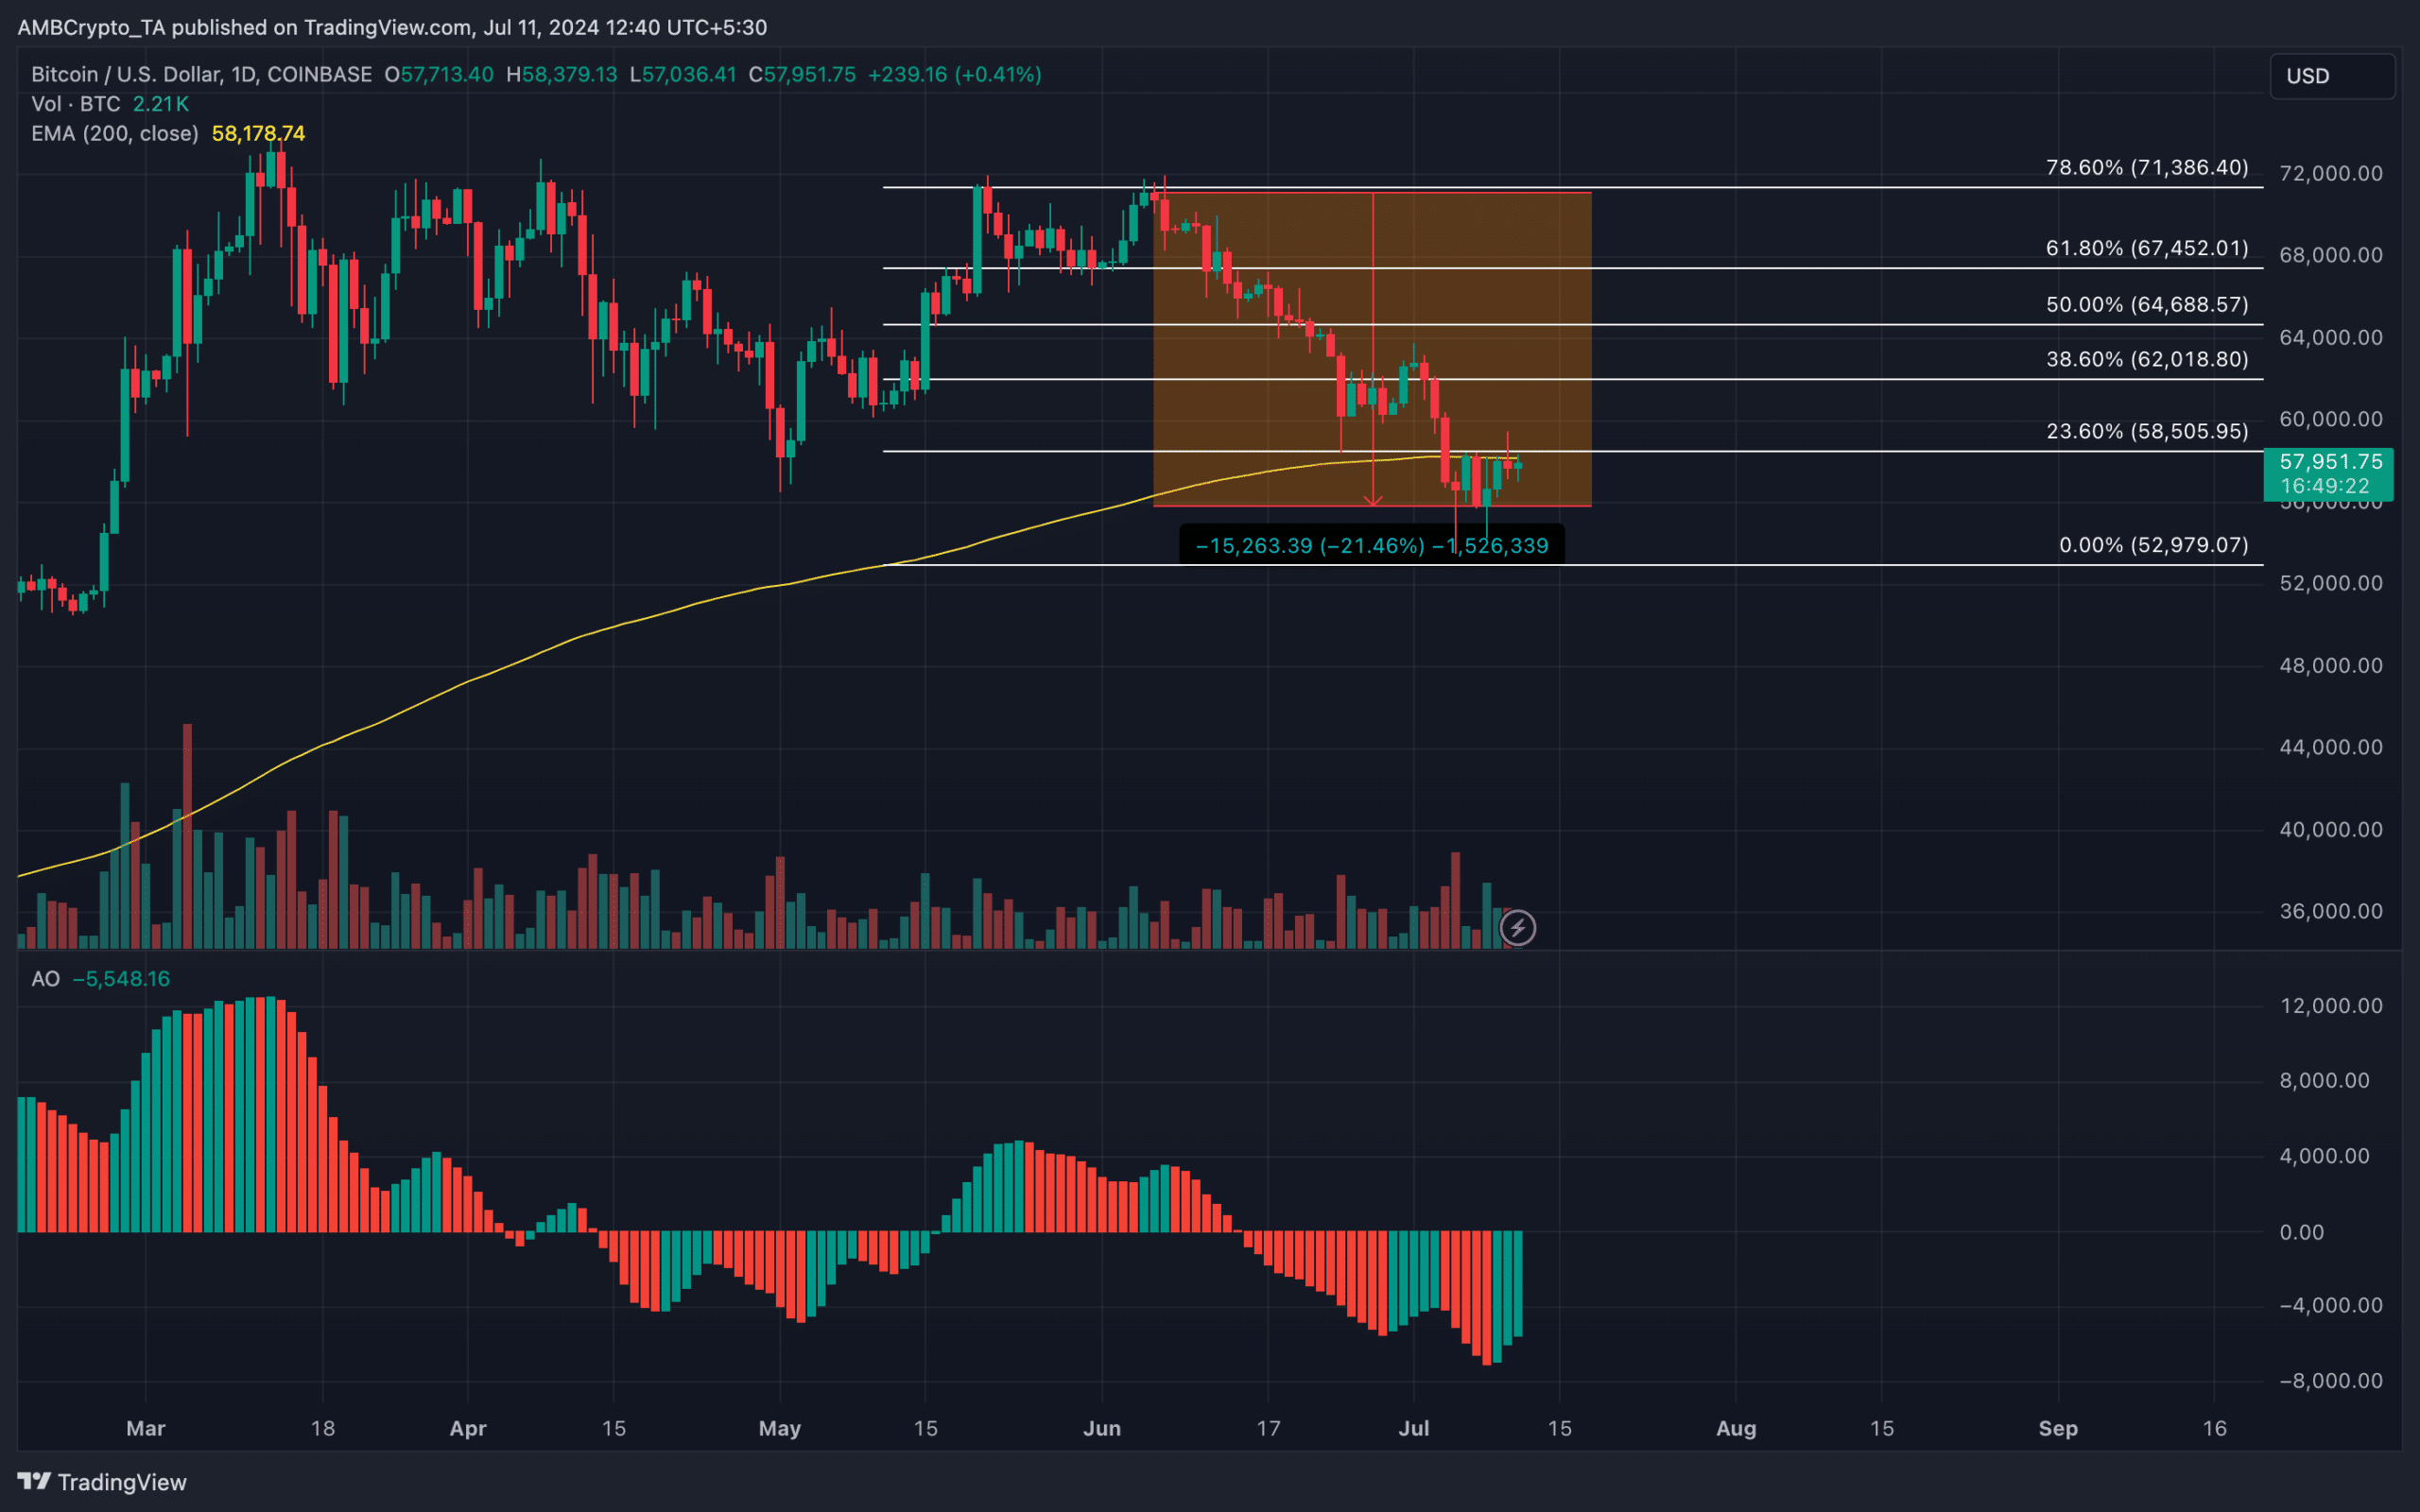
However, if it retraces to the optimism or fear level, Bitcoin’s momentum might slow down. Between the 6th of June and 7th of July, Bitcoin’s price has decreased 21.46%.
Is a retest of $71,000 possible soon?
While the price was close to retesting $58,000, it still trades below the 200 EMA (yellow). EMA stands for Exponential Moving Average (EMA). This indicator measures trend direction over a given period.
If the price trades above it, it means the trend is bullish. But if it is below it, it indicates a bearish trend. But it was different for Bitcoin considering that the price was close to flipping the zone
Should this happen, accompanied with signs of increasing upward momentum from the Awesome Oscillator (AO), Bitcoin might return to its bull phase.
Specifically, this could drive Bitcoin to retest its halving and possible trade around $64,688.
In a highly bullish case, the price might jump to $71,386, potentially setting the stage for a bull run that takes the price toward $80,000.
Is your portfolio green? Check the Bitcoin Profit Calculator
Meanwhile, there has been comments from analysts per Bitcoin’s price action. One of them was from pseudonymous handle on X Rekt Capital. According to Rekt Capital, it might take a while before the bull run begins as he mentioned that,
“Bitcoin is not ready to break the downtrend just yet”


