Cardano headed for another downward spiral after descending triangle closure

Despite signs of recovery at the beginning of the month, Cardano has been trading at a yearly low due to renewed downward pressure. As ADA closely trades near its support, chances of the much-needed rally appeared faint. At press time, the coin was trading at $0.036 after a decline of 1.33% over the last 24-hours. Additionally, ADA recorded a market cap of $939 million according to data on CoinMarketCap.

Source: CoinStats
Cardano 1-Day Chart:

Source: ADA/USD on TradingView
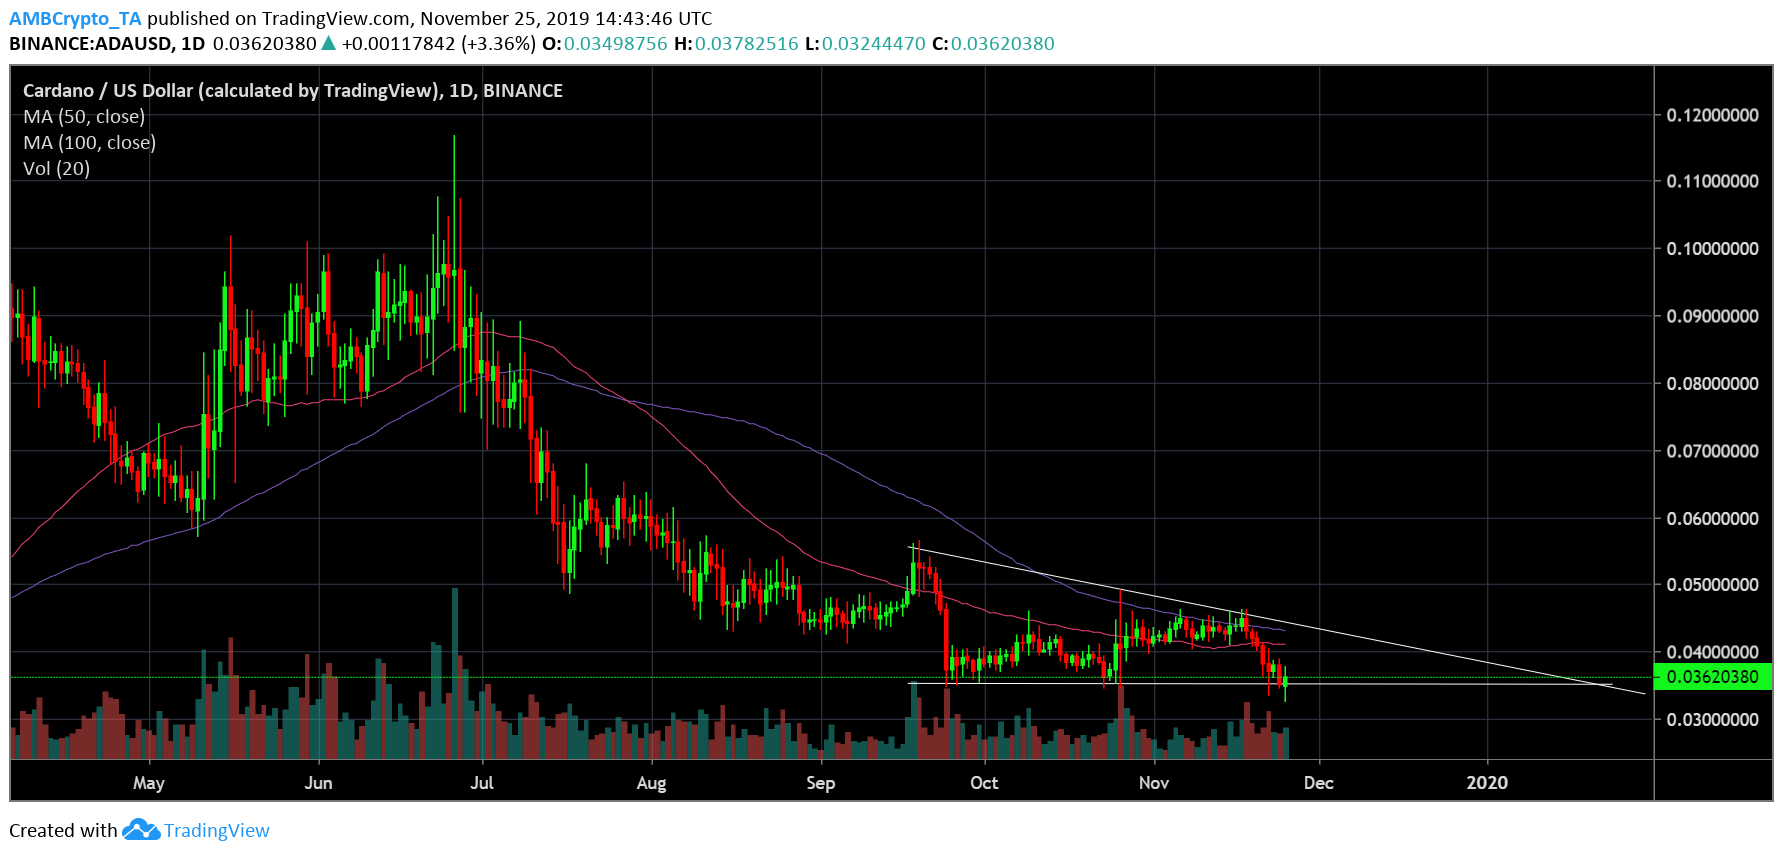
Cardano’s daily chart exhibited formation of descending triangle pattern. This was indicative of a potential bearish breakout despite inconsistent trade volume in the near-term. Even as the moving averages appeared to converge, they were well above the candles.
The converging moving averages could possibly mean a brief recovery in coin’s price nearing its immediate resistance at $0.040. However, 100 moving averages continued to hover above 50 moving average which suggested a bearish phase for the coin, which could imply a subsequent decline and a breakout to the negative side.
ADA could find itself testing support at a low of $0.030 if the downtrend persists.
Bearish Projections:

Source: ADA/USD on TradingView
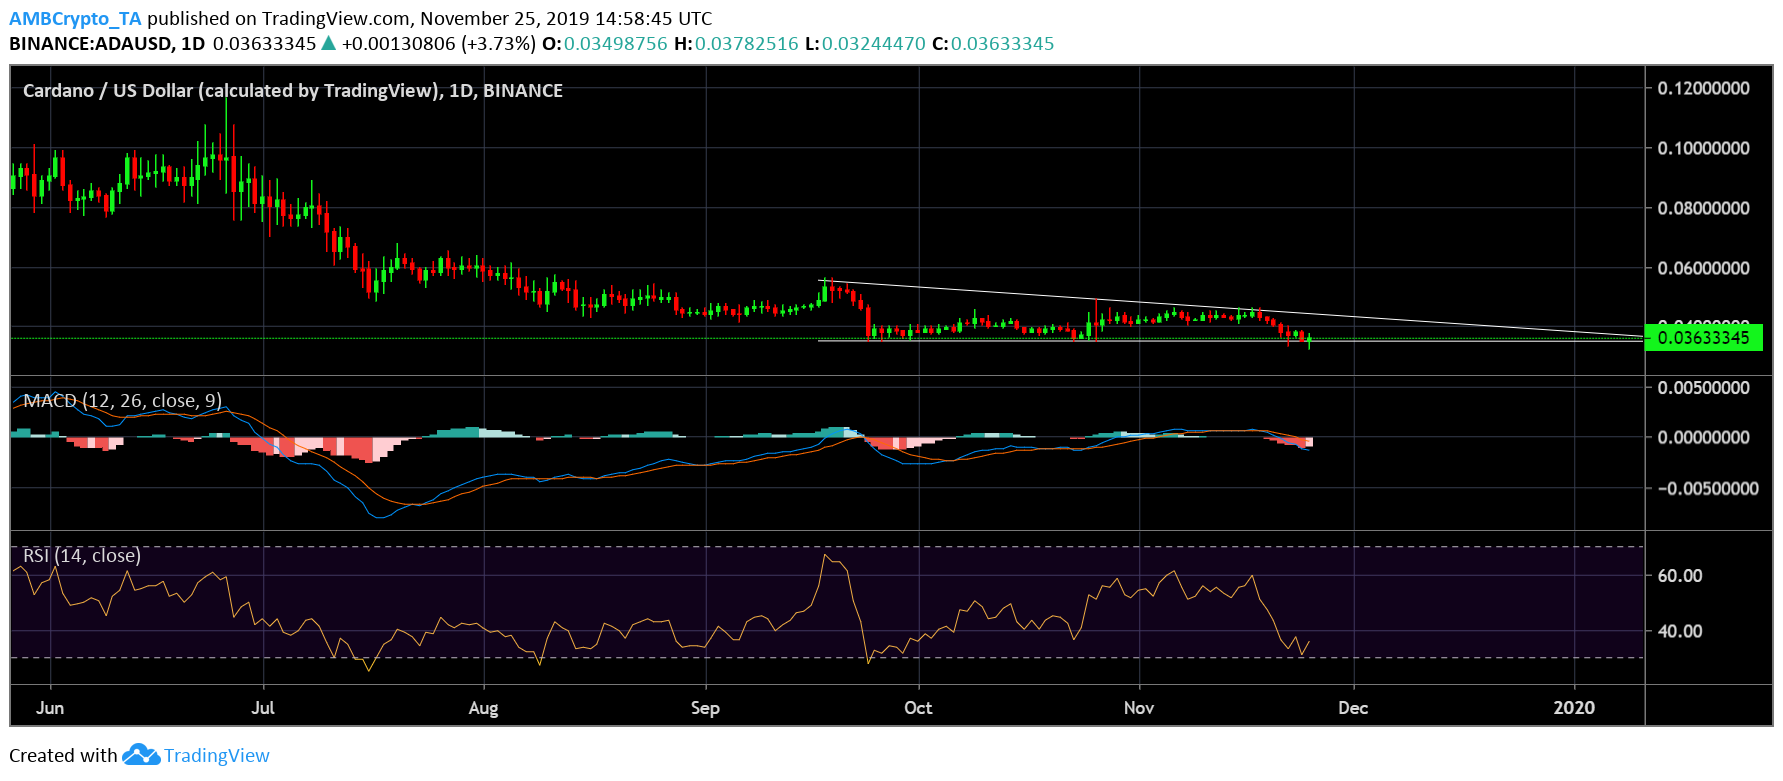
MACD was below the signal line. This suggested a bearish phase for the coin. Additionally, RSI depicted high selling pressure among the ADA investors.
Conclusion:
Cardano [ADA] has been in the bears’ realm for quite some time now despite numerous upgrades in the ecosystem’s technological front. A breakout to the upside appears to have stalled again with the formation of descending triangle pattern and the strong bearish signal from the indicators. This could potentially lead to the coin fall to its immediate support low of $0.030 in the near term.


