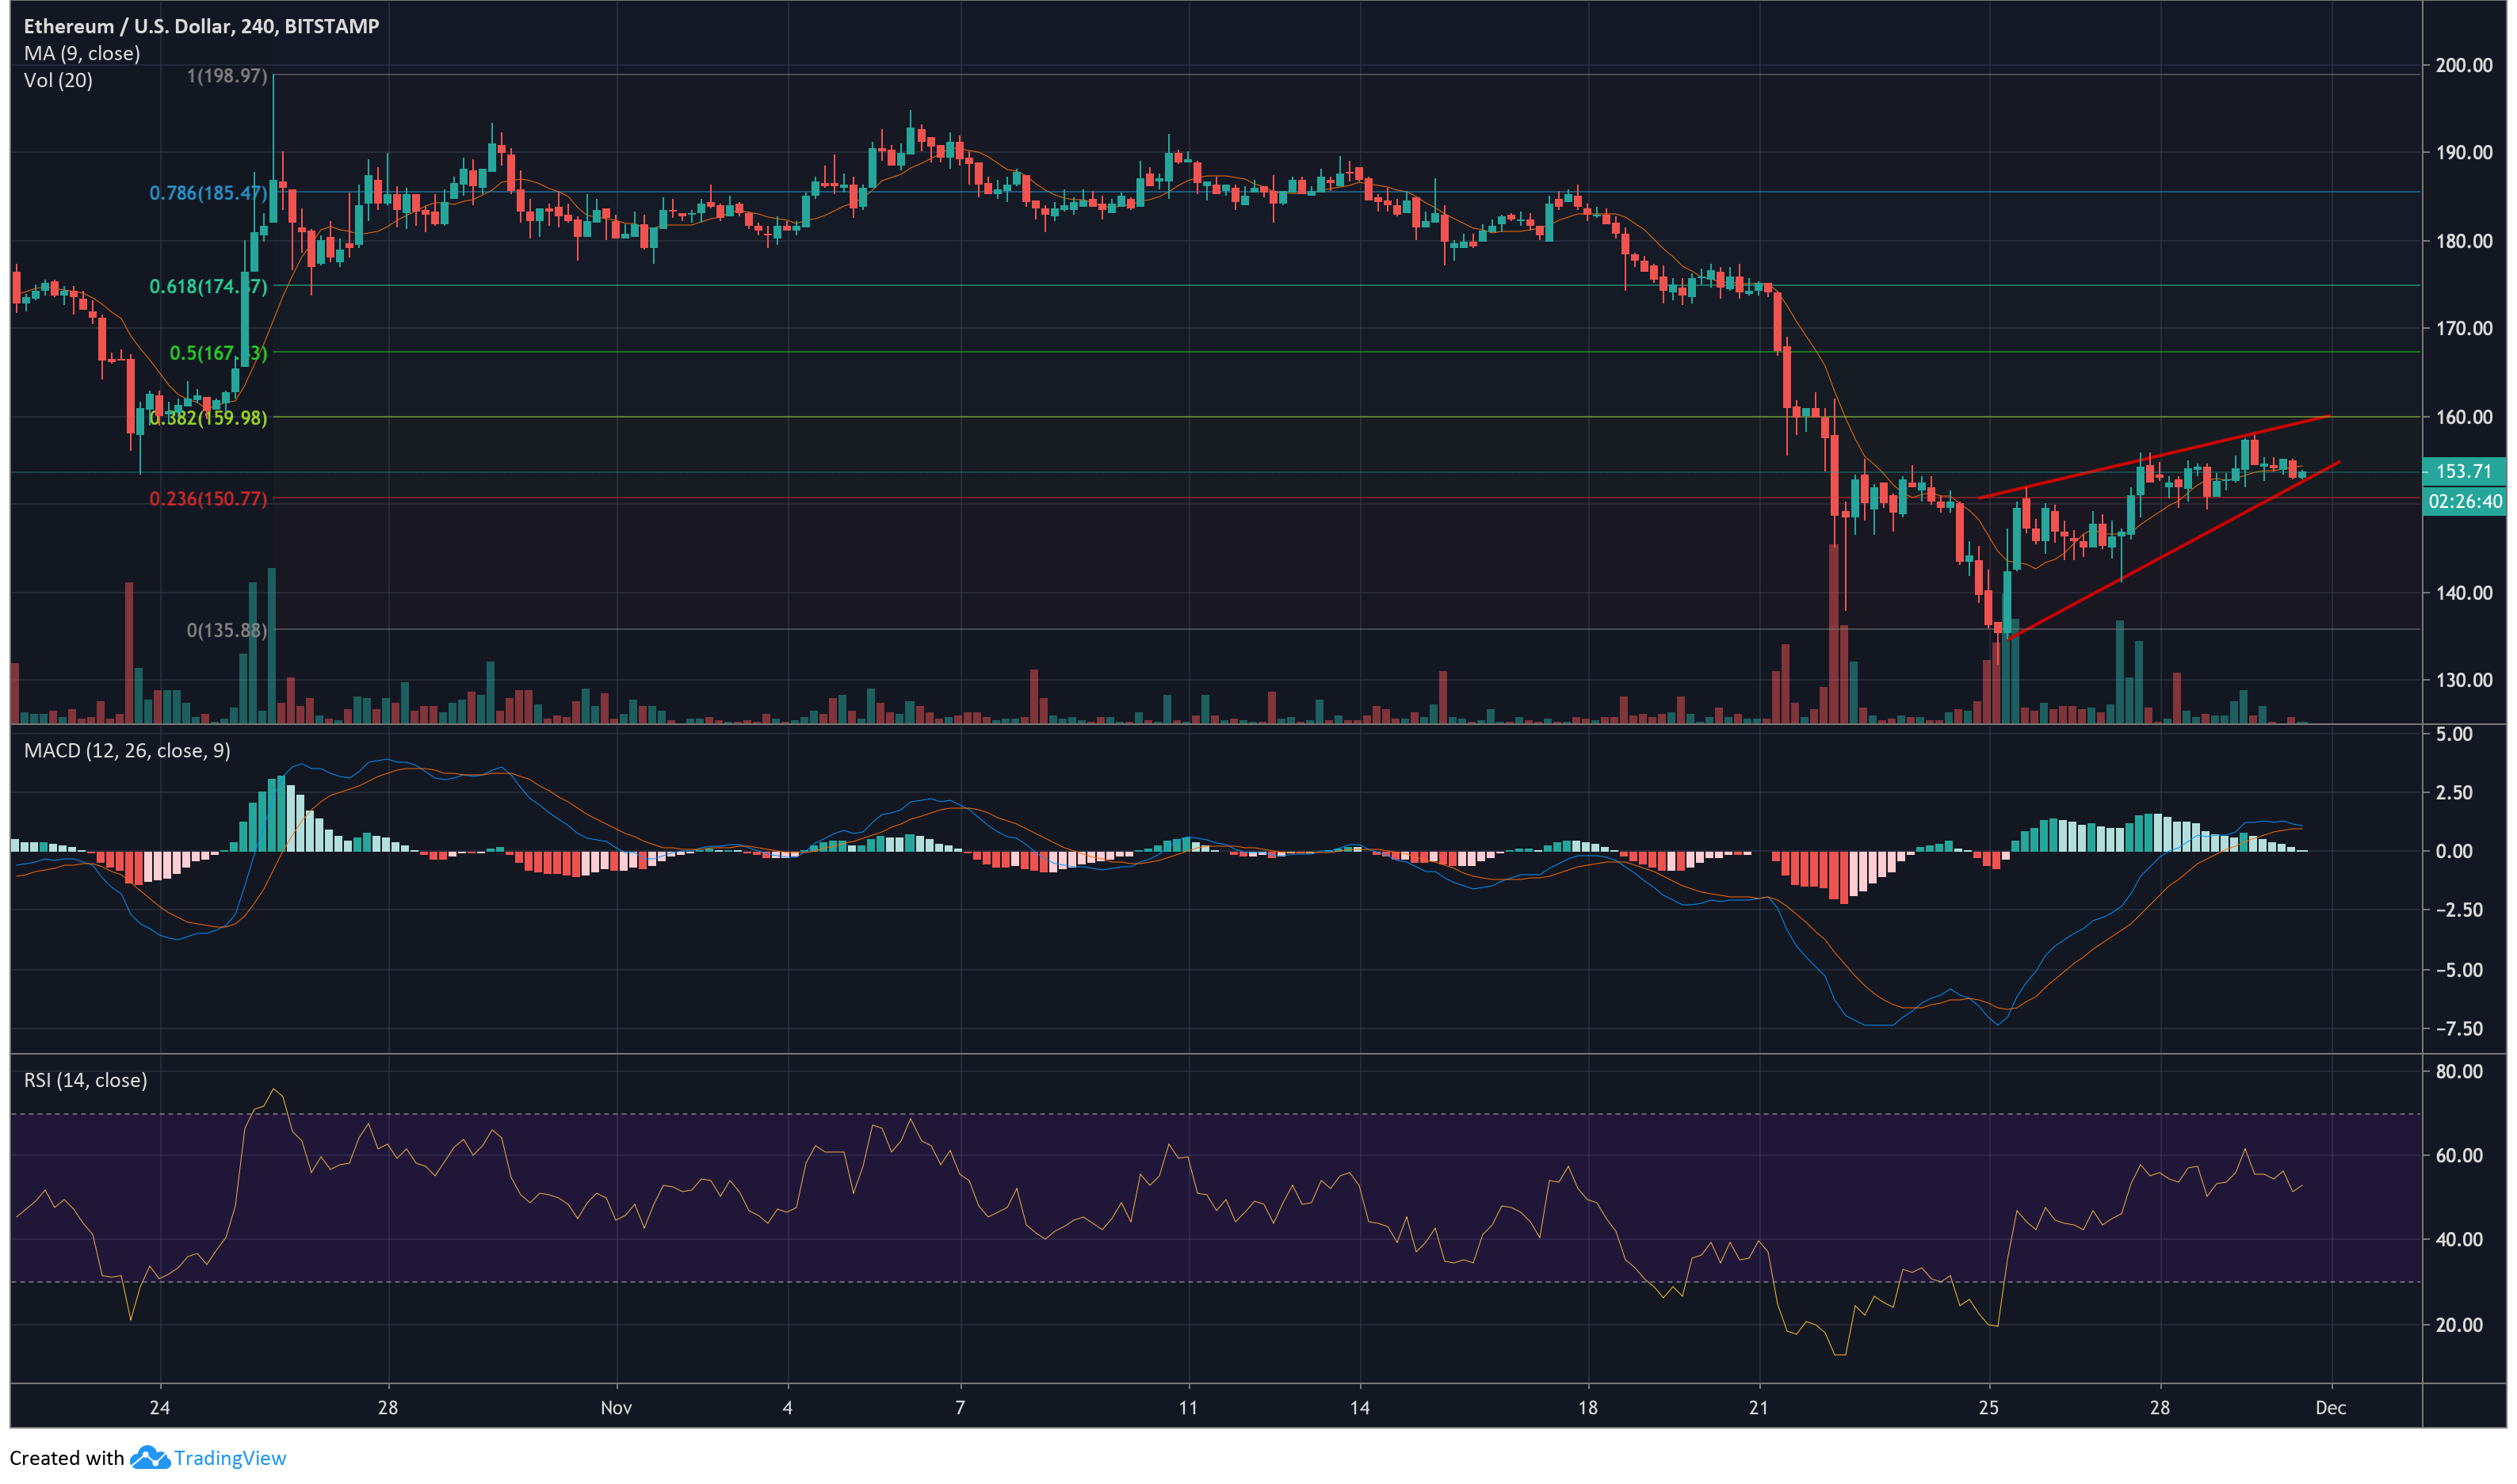
Ethereum could drop down from rising wedge to $146 next week

Less than a week ago, ETH tested a support line for the first time since December 2018. It has since recovered slightly, valued at around $153 at the time of writing. According to CoinMarketCap, the flagship Ethereum coin had a market capitalization of over $16.6 billion and more than $7 billion worth of ETH was traded over the day. ETH was traded most on the Bilaxy exchange, which accounted for around 3.5% of the trading volume over the 24-hour period.

Source: CoinStats
Ethereum 4-hour chart

Source: ETH/USD on TradingView
The 4-hour chart showed that ETH had entered into a rising wedge pattern less than a week ago, and has been oscillating between the converging trend lines since. This pattern is accompanied by a decreasing volume trend, as can be seen in the above chart. Rising wedges tend to breakout downward 60% of the time, making it more likely that ETH will fall in the short-term.
The 9-MA could be seen moving over the price line, marking a further likelihood that the Ethereum coin will drop as it begins to apply bearish pressure on the price. The Relative Strength Index (RSI) indicator could be seen moving closer to being overbought than oversold, moving at around the 50 mark in the neutral region. The MACD indicator looked to be in position for a bearish crossover, as the signal and MACD lines appeared to be converging near the 1.00 mark.
ETH could bounce off the lower trend line it is testing at the time of writing, and continue through the pattern for some time. However, it will likely eventually breakout downward from the pattern, possibly to as low as $146 before the end of next week.


