Chainlink, Aave, Compound Price Analysis: 28 February

Bitcoin’s bullish movement in the month of February propelled some altcoins to record levels of their own as billions of dollars pumped into the crypto-market. However, the altcoins also followed the king coin lower on the charts after a period of correction. Such was the case with Chainlink, Aave, and Compound, which failed to sustain their highs, especially after BTC retraced from record levels.
Chainlink [LINK]
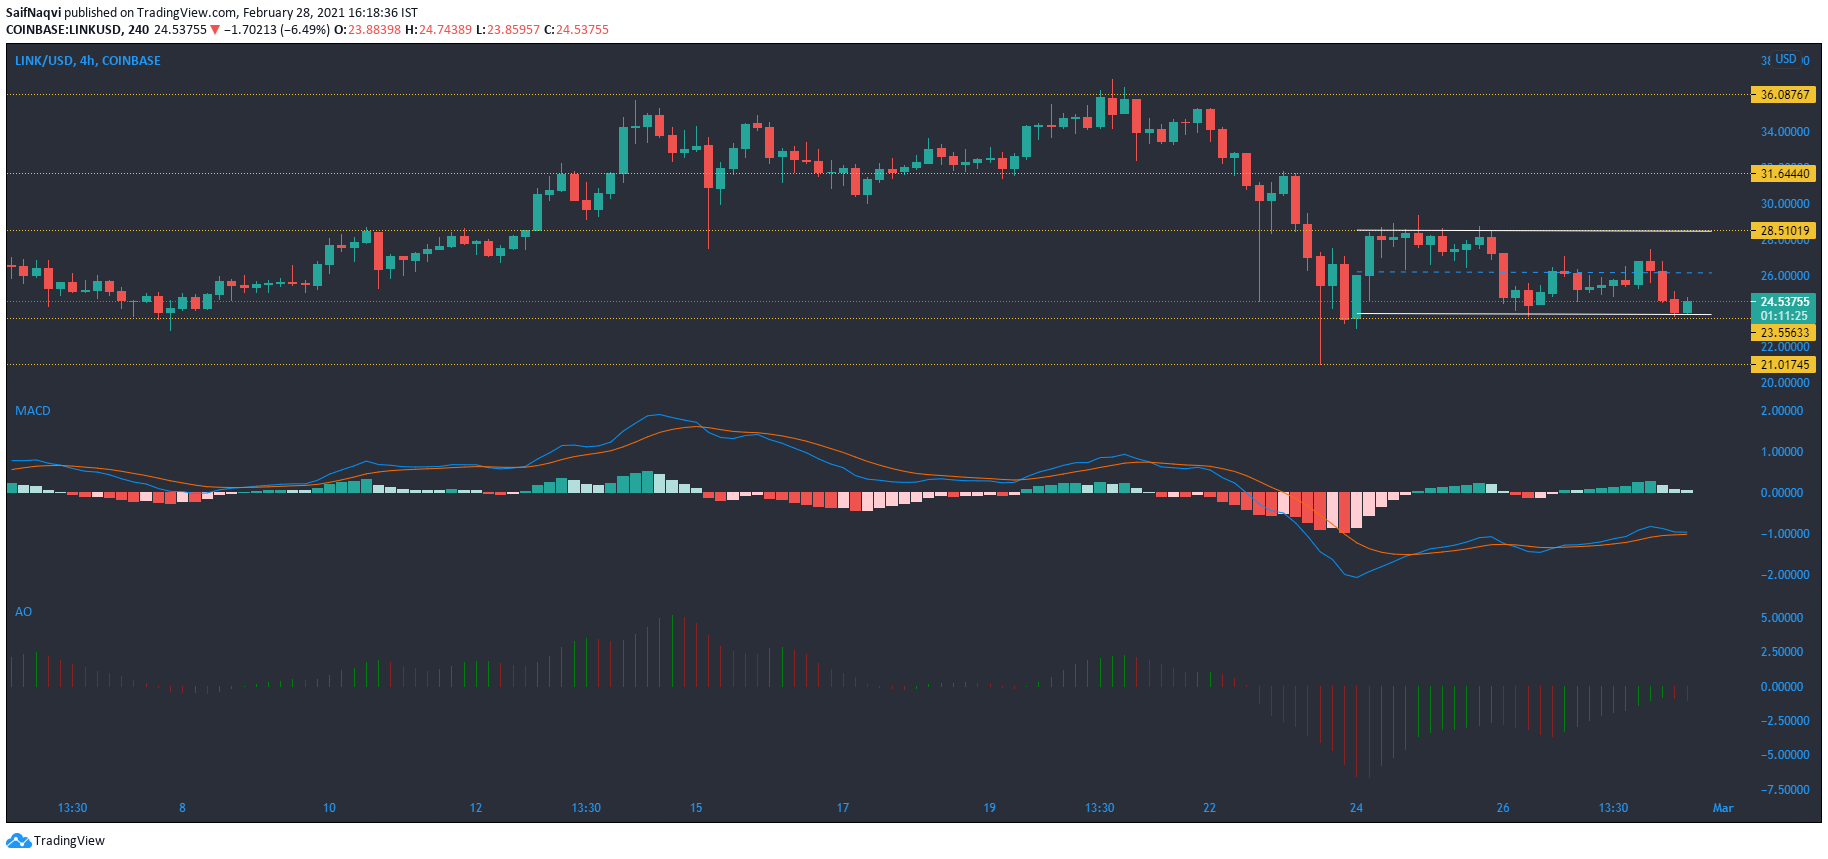
Chainlink fell from record levels and found support at $23.5 following a correction in the broader market. Since then, the price mostly traded in a parallel channel as both sides lacked the strength for a breakout in either direction.
However, if LINK was to continue its downtrend before the emergence of the pattern, then the price would breach the lower trendline. In fact, the indicators tipped in favor of the bears and a move below the current support line could lead to an extended sell-off. The MACD closed in on a bearish crossover, while the Awesome Oscillator invalidated a bullish twin peak setup and switched to red. The next level of support resides at $21.
Aave [AAVE]
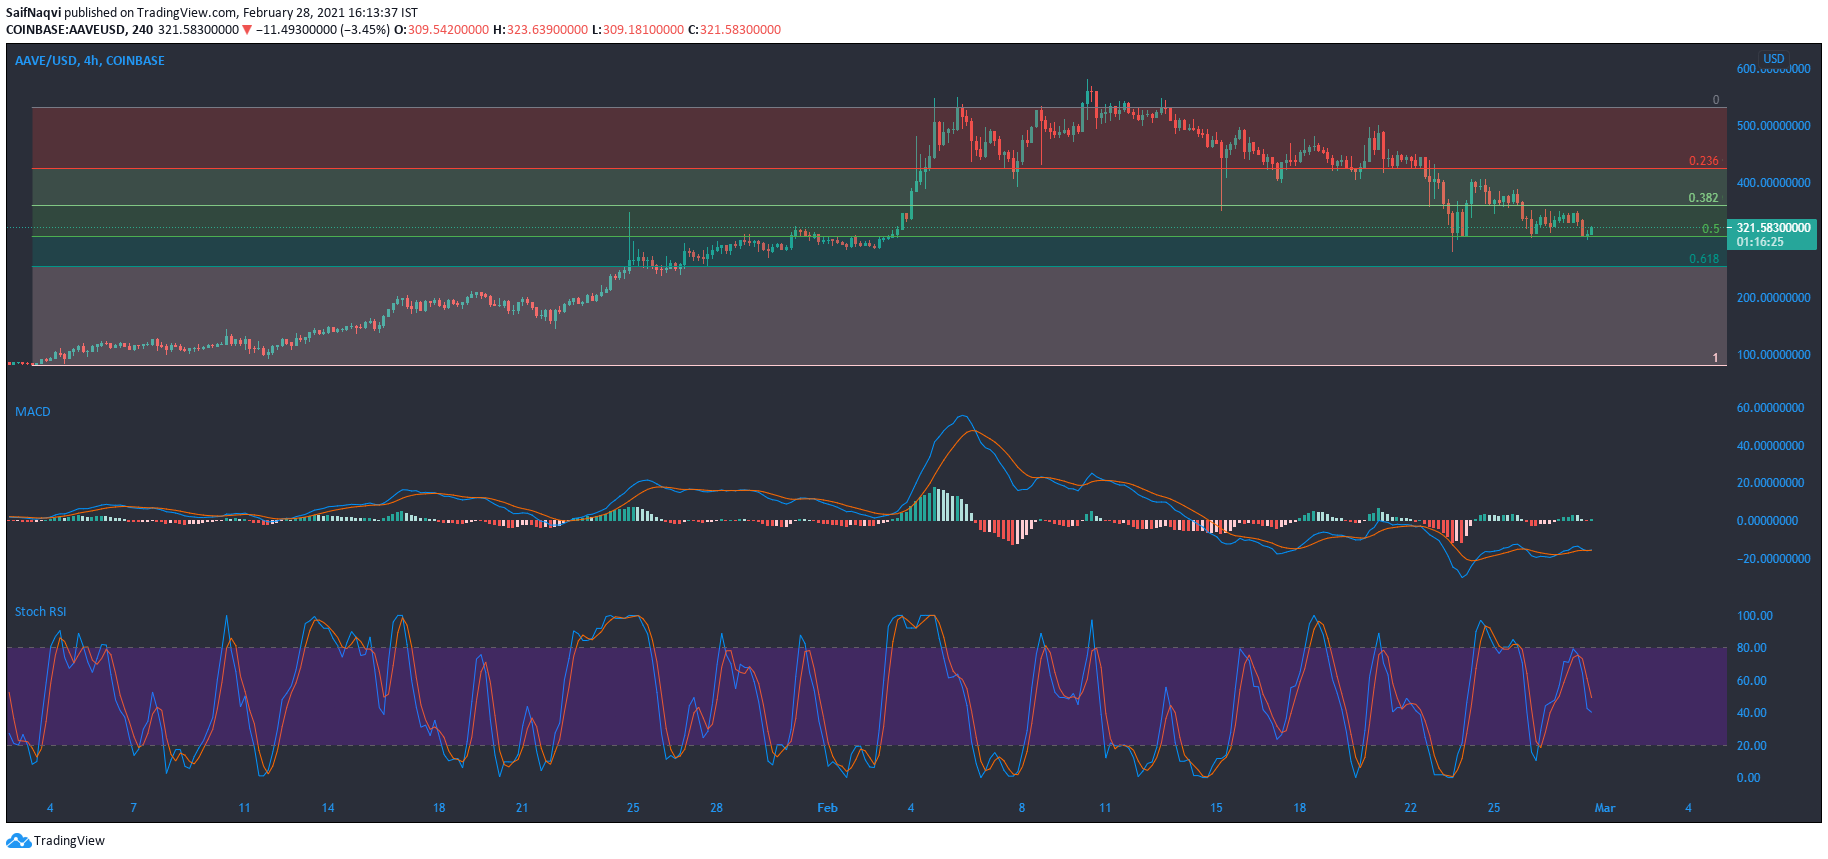
Using the low of $87.1 and the high of $531.6, some important fibonacci retracement levels were highlighted on Aave’s 4-hour chart. At the time of writing, the price traded at a critical 50% support level. A move below the current level could lead to a further sell-off towards the 61.8% retracement level. Traders could opt to short the cryptocurrency to capitalize on the southbound move.
The indicators were bearish-neutral and it was not clear whether the breakdown would take place in the near term. The MACD line moved alongside the signal line, while the Stochastic RSI pointed south from the 40-mark. Conversely, a move above the 38.2% retracement level could lead to an extended bullish scenario.
Compound [COMP]
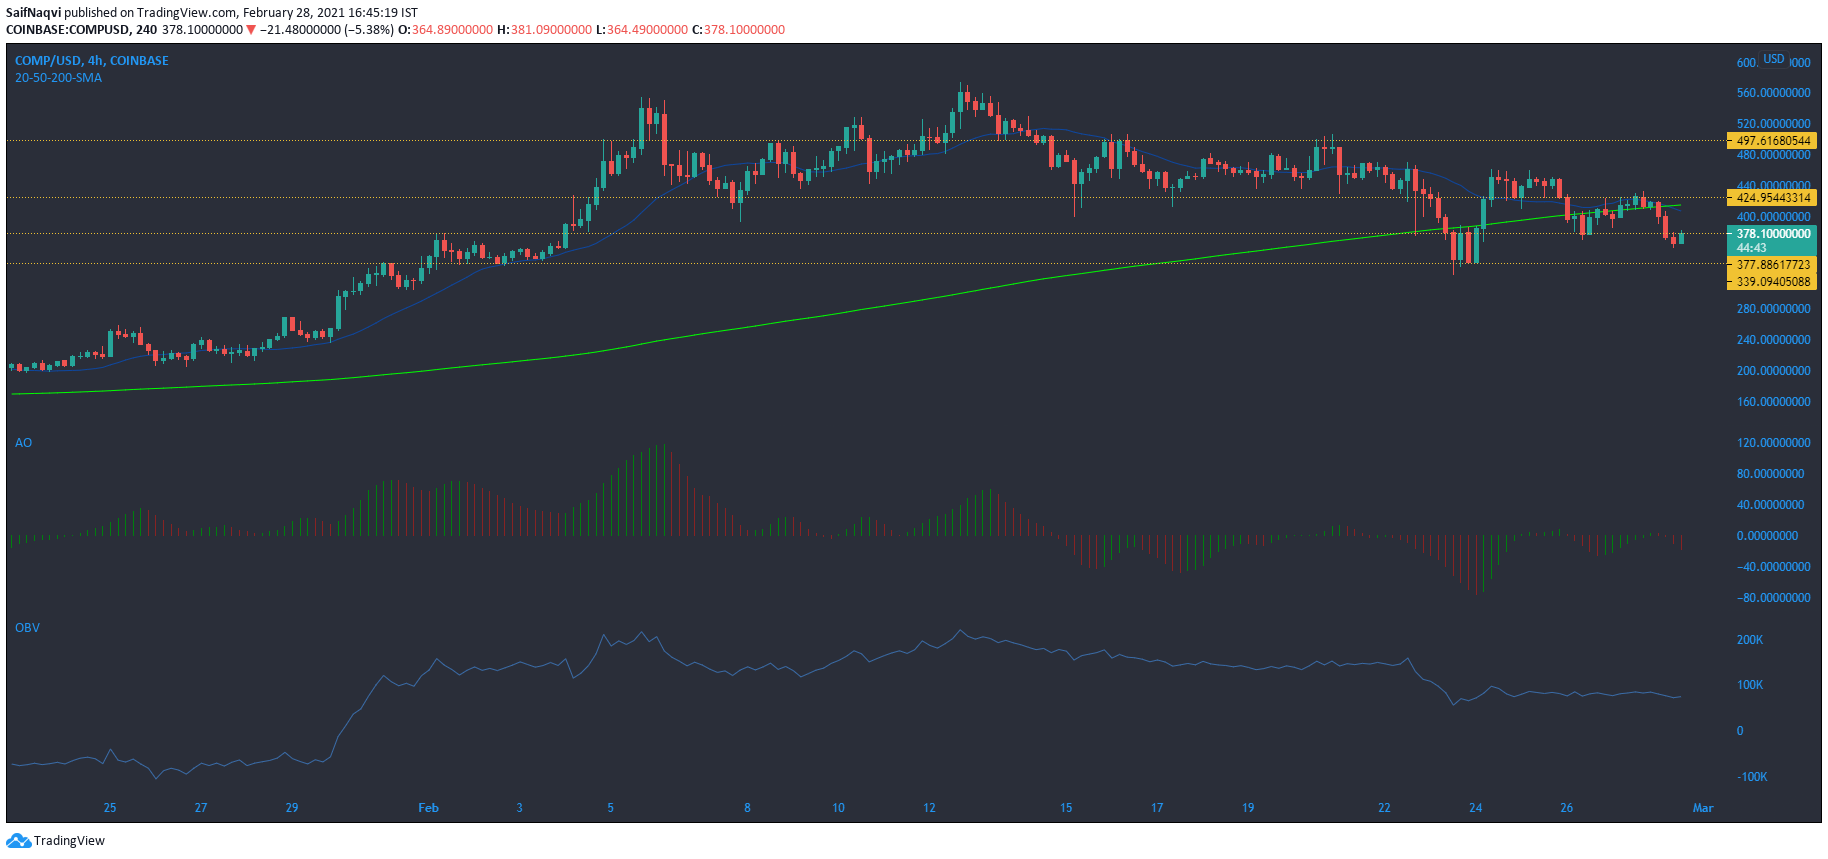
Since snapping an all-time high of over $560, Compound formed lower lows on its 4-hour chart as the price fell below multiple support levels. The bearishness was emphasized at the time of writing as the 200-SMA (green) crossed over the 20-SMA (blue). The Awesome Oscillator highlighted the strong selling momentum since COMP touched record levels. The index moved below the half-line after each attempt by the bulls to recover prices at various levels.
The On Balance Volume also outlined the selling pressure as the index moved southbound along with the price. If the bulls fail to hold on to the current support line, the next line of defense resides at $339.


