Lessons to learn from the Bitcoin rallies of 2013 and 2017

Bitcoin is close to registering its largest weekly dip in 2021 and at press time, BTC has dropped 21% over the past 7-day period, creating a little bit of panic among some investors. Many were suggestive that this may kick off a prolonged bearish period, after Janet Yellen, U.S Treasury Secretary yelled at Bitcoin for being “extremely inefficient”.
Taking the attention away from external sentiments, key on-chain data suggested that a majority of investors were hardly affected by the crash, and there is an immediate leg up expected by the market.
Decreasing Liquidity Supply Indicate Hodler Strength

Liquid Bitcoin supply has continued to dry up in the market over the past few months. During recent corrections, long-term hodlers failed to indicate major change as they continued to hold their positions like in mid-January; i.e during the $42k to $29k dump. As indicated earlier, the weekly drop is currently a 21% correction, whereas a 30% is also relatively acceptable during a long-term bullish rally.
However, the short-term hodlers are more important in 2021 than in 2017, because they would be bringing in the retail volume as the market progresses for its next bullish leg-up. Institutions have already accumulated in high quantities, which is currently slowing down, as demonstrated by Grayscale.
Bitcoin Macro-level Comparison: 2013 vs 2017 vs 2021
To understand the cyclic nature of the current rally, Glassnode’s recent report indicated that the position of Bitcoin Reserve Risk in the previous bullish-period.
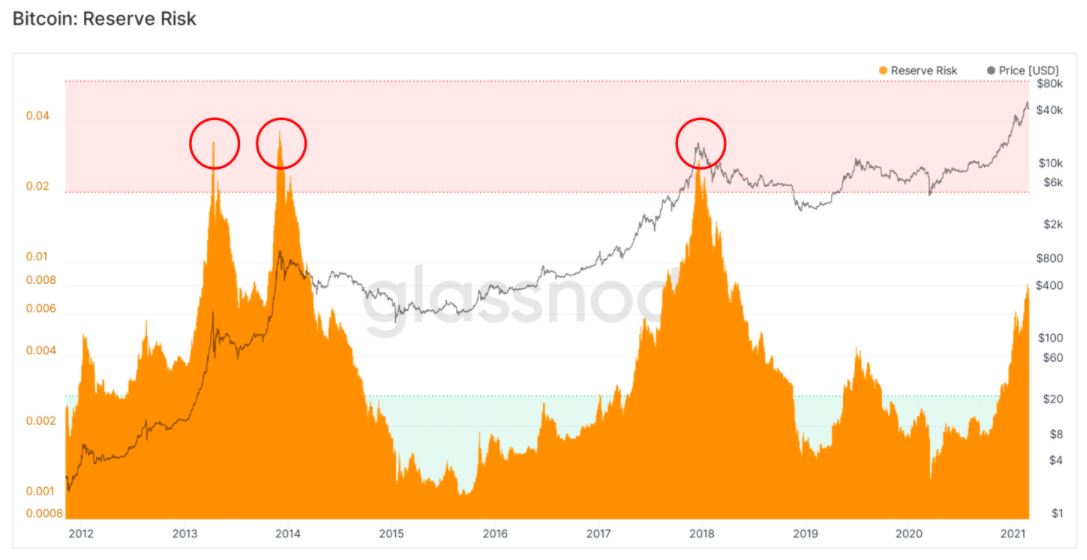
As identified in the chart, in terms of Bitcoin Reserve Risk, the current RR index is nowhere near the peak of the 2013 and 2017 rallies, following which BTC underwent a strong bearish period. The above comparison clearly indicates a wide room for growth in the present market from a historical position.
The comparison is also insightful when the past action of short-term Bitcoin holders is compared. Whenever BTC, that is 1 month or younger make up more than 60% of the realized cap, we have arrived at an arm’s length away from the global top.
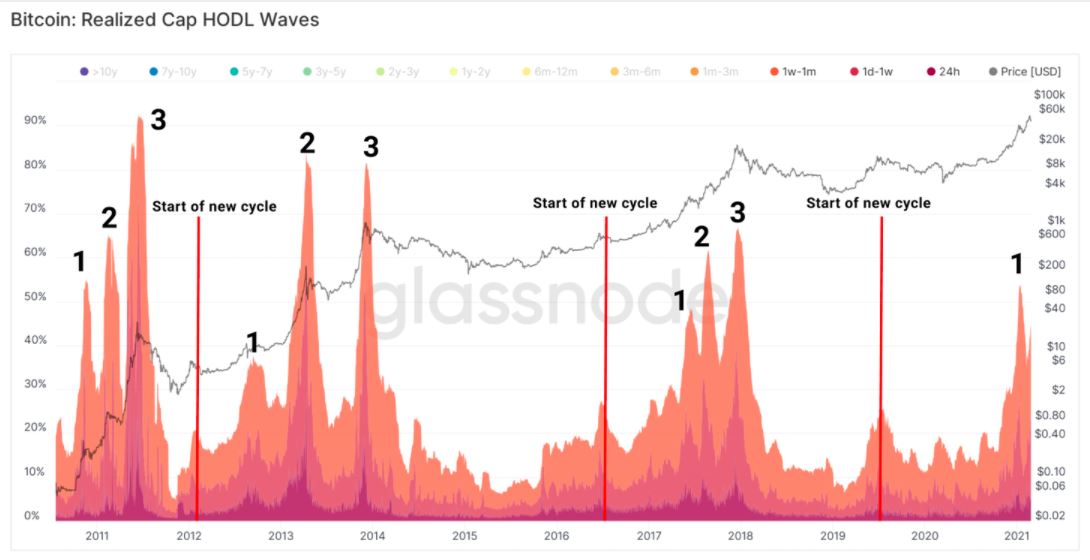
What is conclusive from the above chart is that we are still early with tokens that are above 6 months old continuing to drive the price rather than tokens that have a shorter life span in terms of holding period.
The room for growth is specific and somewhat identical but it is important to account for a variable change in 2021.
There might be historical similarities between 2013 vs 2017 vs 2021, but fundamentally there are other factors that dictate the value of Bitcoin. Whether it is institutional sentiment, or the growing concern surrounding the de-stability of the U.S dollar, such socio-economic factors may impact Bitcoin’s move as well. The market going forward can still be considered uncertain in terms of reaching a global top, as we may reach higher than expected or drop lower than what was imagined.