Bitcoin Cash, Uniswap, Zcash Price Analysis: 28 February

Bitcoin Cash looked uncertain to flip its press time resistance as the indicators gave mixed signals regarding its future trajectory. Uniswap could move southbound from its descending triangle pattern as momentum rose on the selling side. Zcash showed some indecision in its market as the price continued to trade within a range, with a breakout unlikely over the coming sessions.
Bitcoin Cash [BCH]
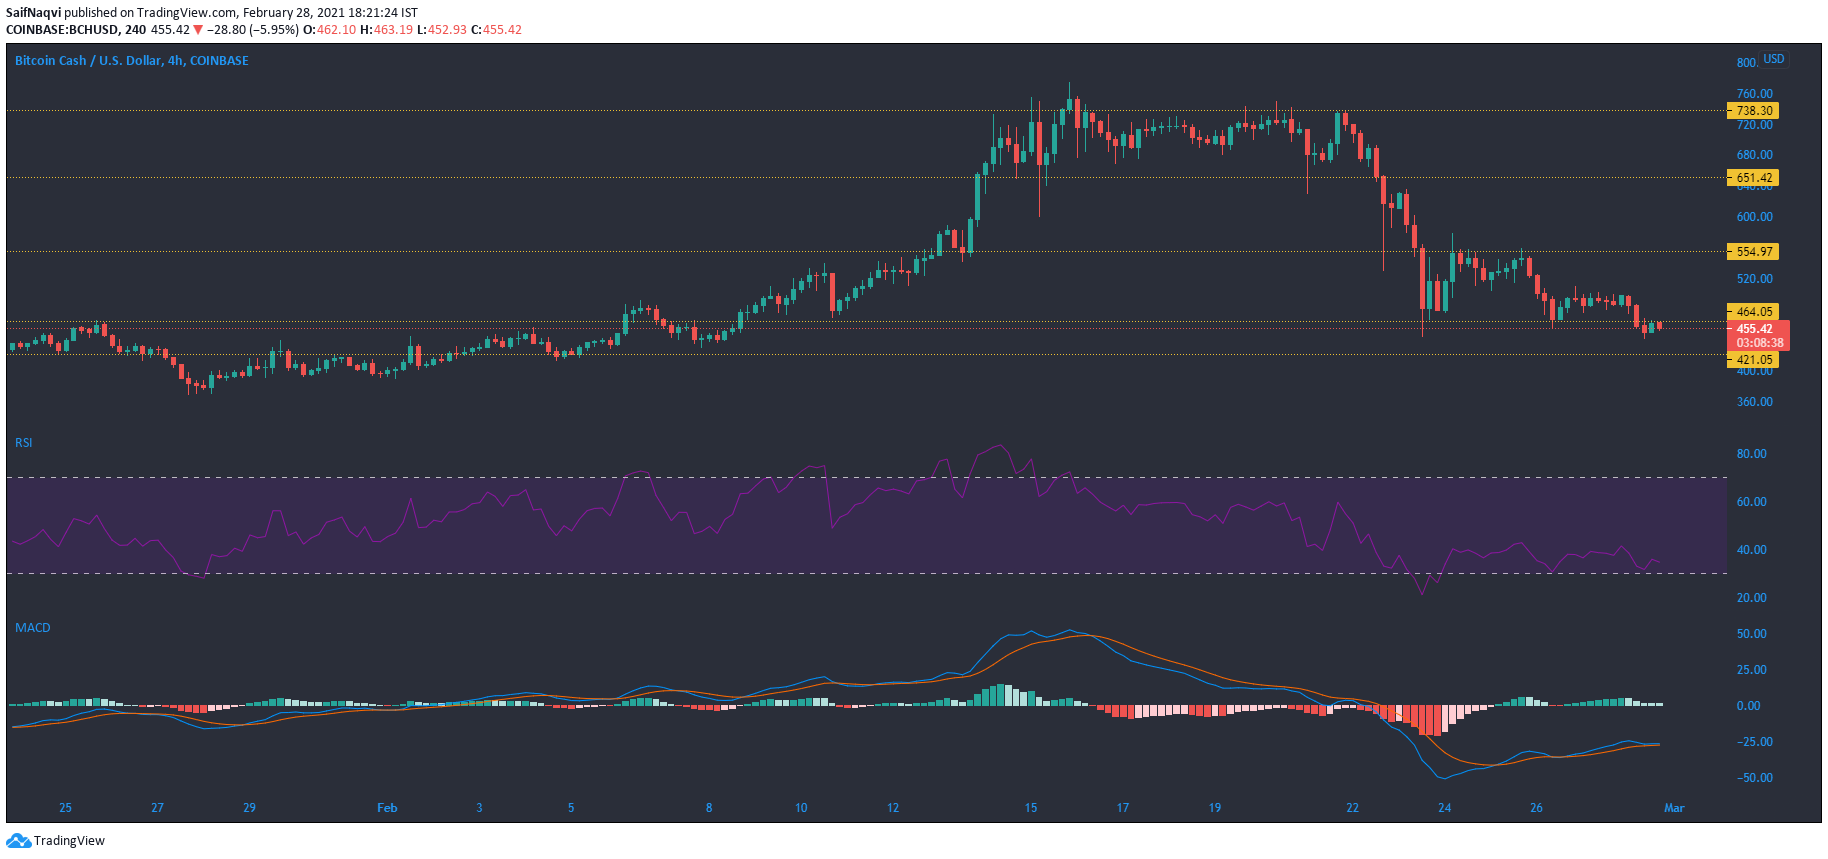
With weekly losses of over 33%, Bitcoin Cash slipped to the 12th position on the crypto-rankings with a market cap of $8.6 billion. On the 4-hour timeframe, the price slipped below $464 support but the bulls eyed a comeback on the charts. The RSI avoided the oversold territory but pointed lower from the 35-mark at the time of writing. The MACD was bullish-neutral as the fast-moving line floated just above the Signal line.
It was doubtful whether the aforementioned resistance mark could be flipped over the next few sessions as trading volumes and buying activity remained muted.
Uniswap [UNI]
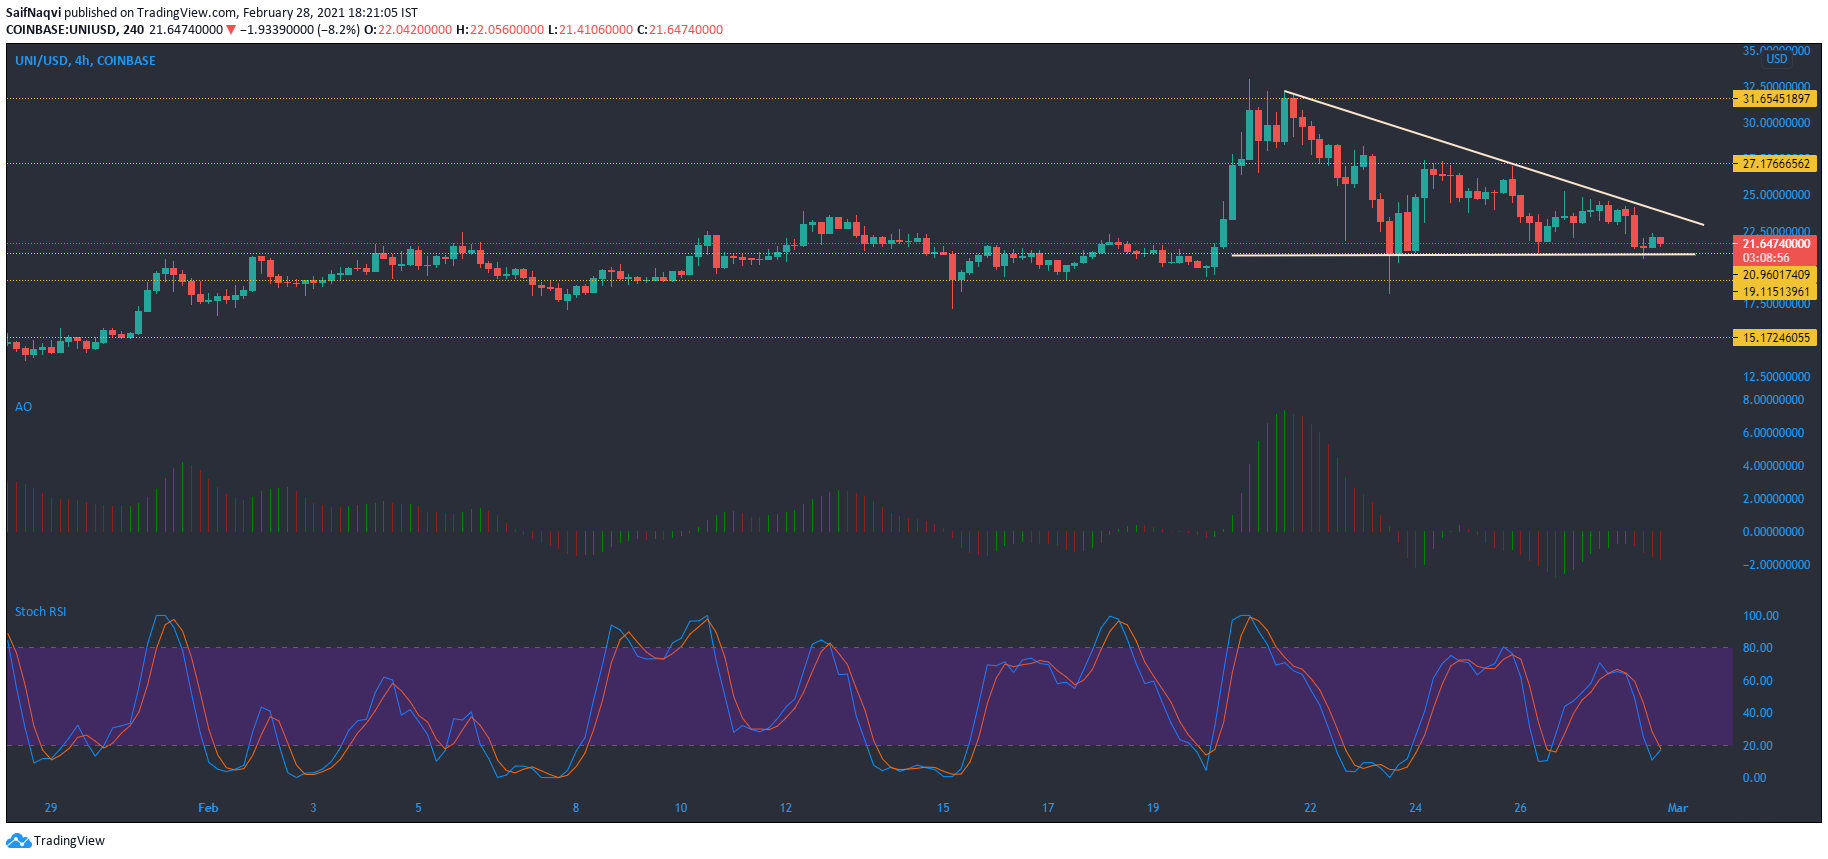
A descending triangle formed on Uniswap’s 4-hour chart after the price formed lower highs post record levels. Prices usually tend to break downwards from this pattern on low trading volumes. The Awesome Oscillator showed that momentum rested with the selling side as the red bars rose below the half-line. A fall below the lower trendline could see UNI move towards the $15 mark.
The Stochastic RSI disagreed with the AO and suggested that UNI could be up for some gains after a bullish crossover in the oversold zone. However, a move above the upper trendline was unlikely considering the state of the broader market.
Zcash [ZEC]
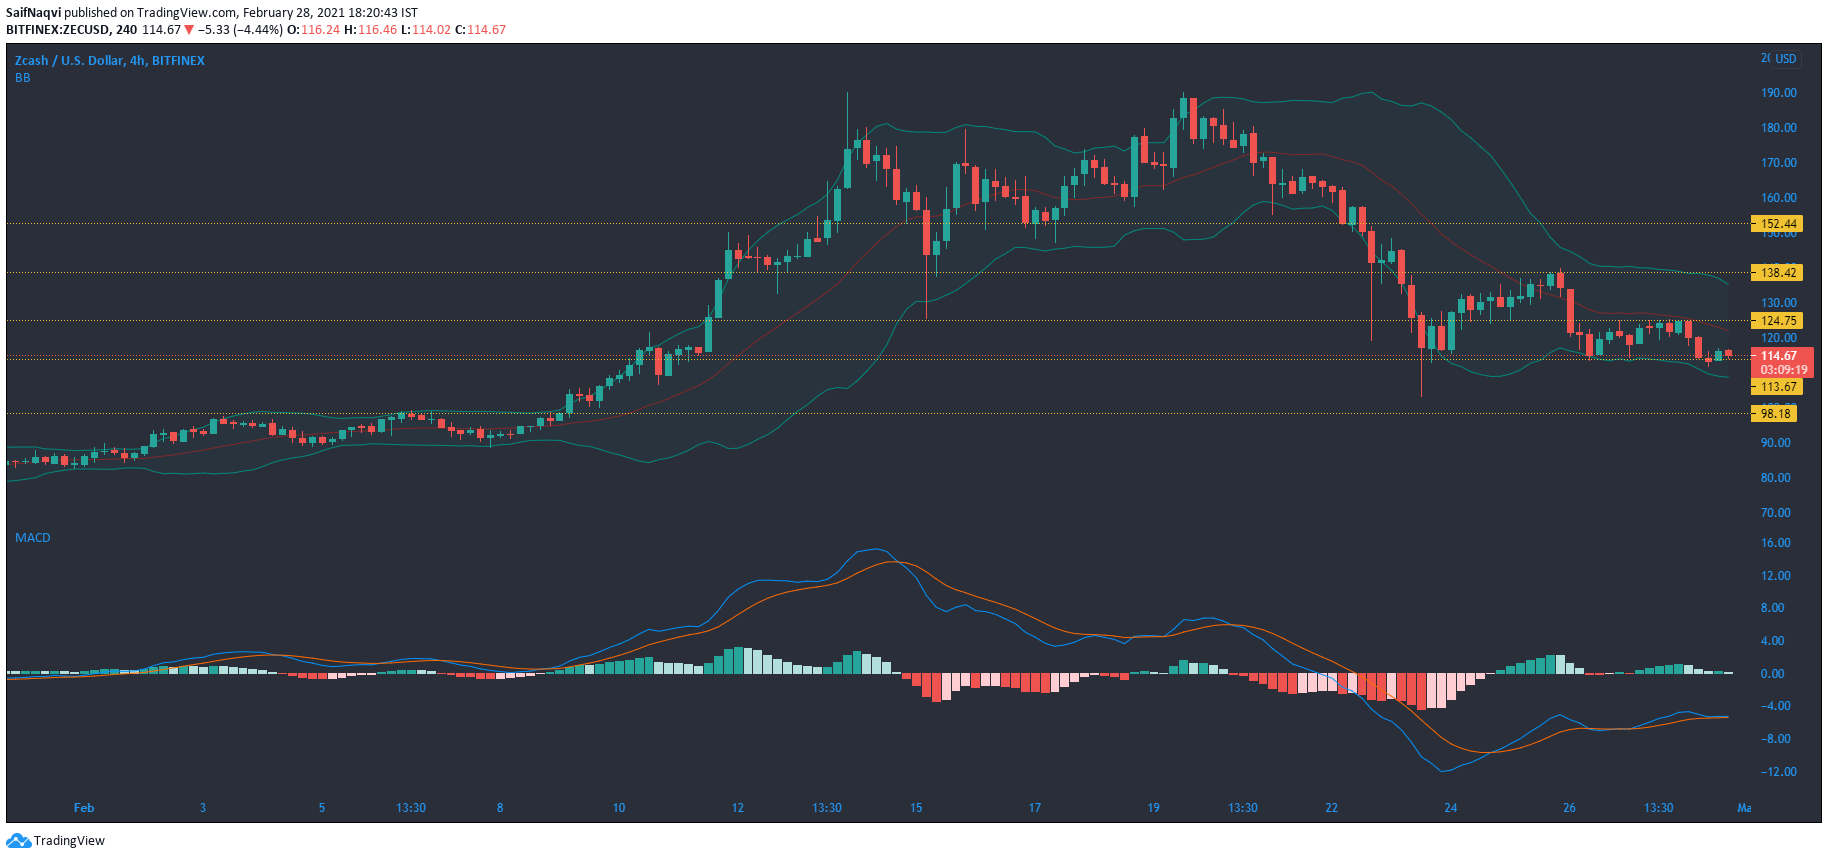
Zcash continued to move within a fixed channel on the 4-hour chart as equilibrium was maintained between the buyers and sellers. The Bollinger Bands also reflected the consolidation as volatility remained low in the market. The MACD line was superimposed on the signal line, reflecting the indecision in the market.
However, a sharp move in either direction could see the market tilt strongly in the favor of the side that enforces the breakout. A bullish scenario could see ZEC move towards the next resistance mark at $138.4. Conversely, a fall could see the price move towards $98.1 support.