Tezos, Augur, Compound Price Analysis: 06 March

Augur appeared to be in a short-term consolidation phase on the price charts. Tezos appeared to break out of its rectangle pattern, but the requisite volume was not yet available, while Compound’s market bulls were able to effect a recovery over the past week t0 to trade at $496, at the time of writing.
Tezos [XTZ]
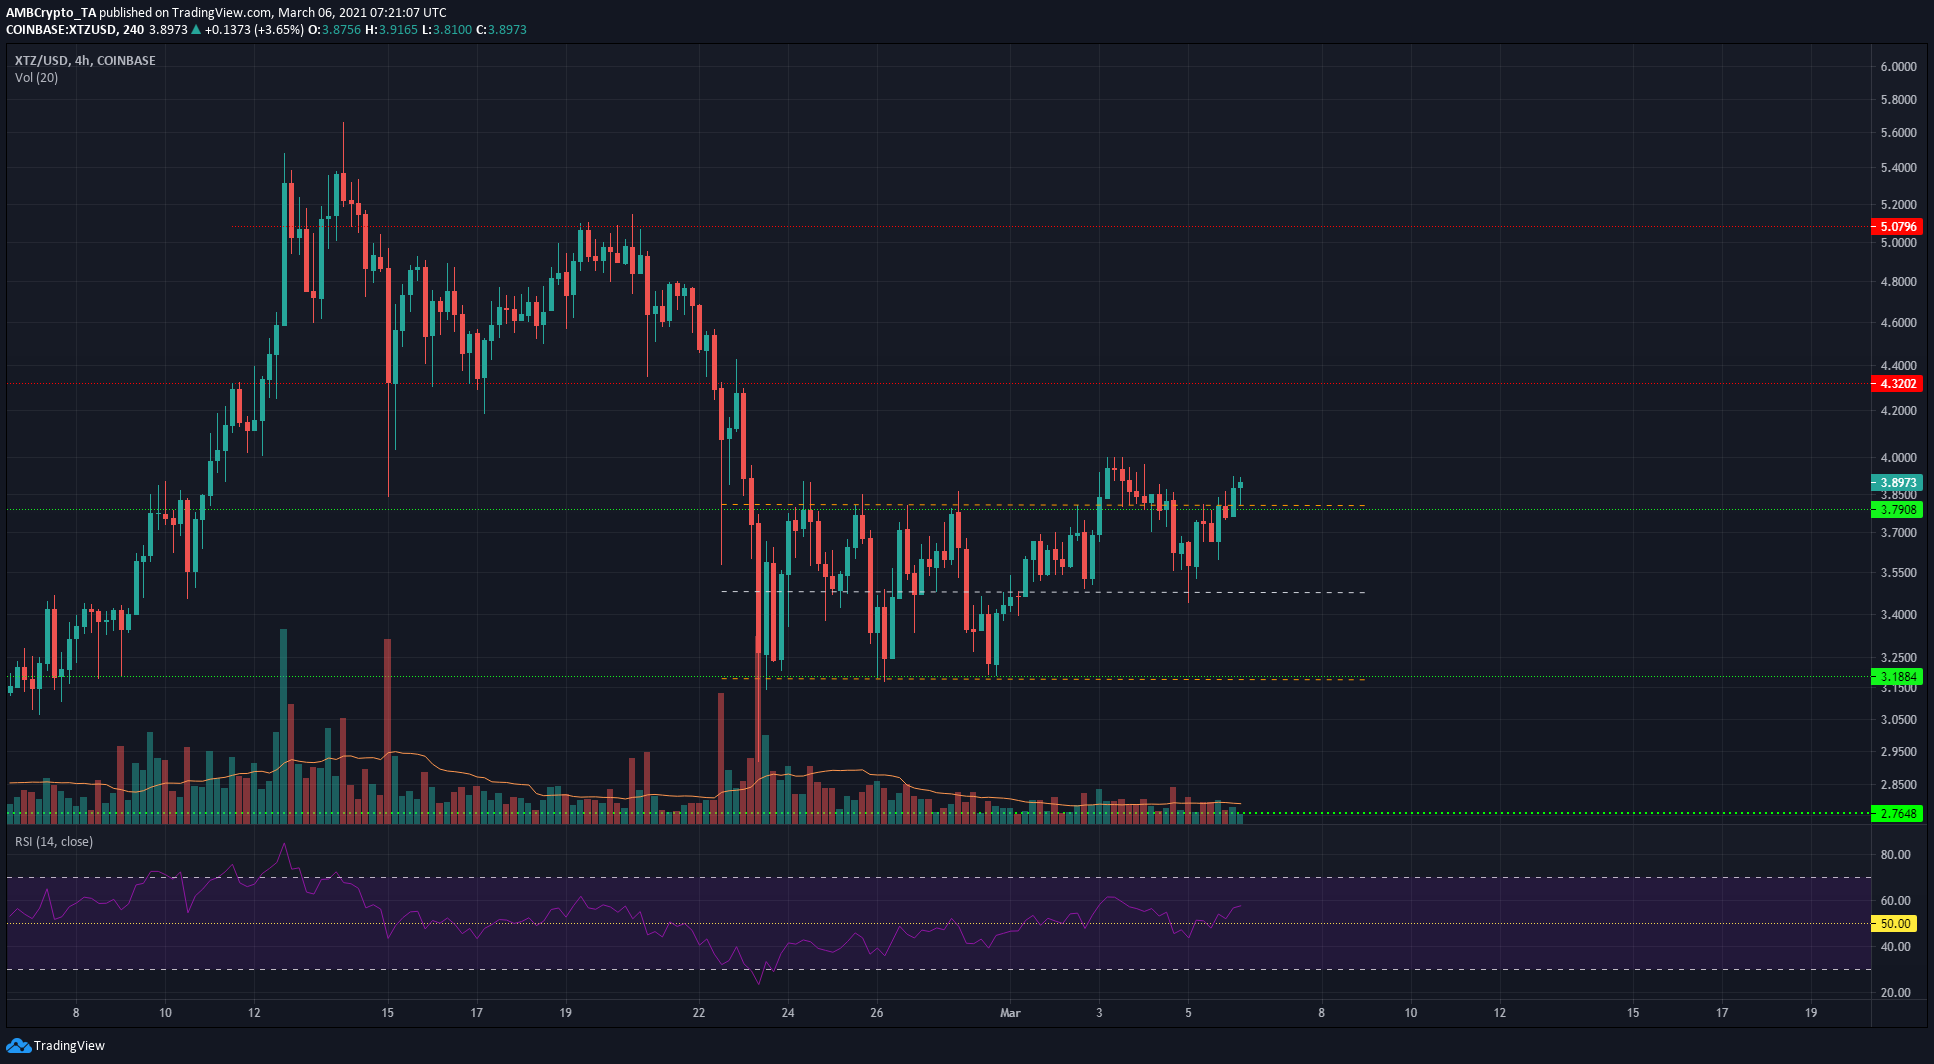
XTZ corrected strongly from its $5.8-ATH in mid-February. At that time, the $4.5-$4.75 zone had acted as an area of demand, but it has been flipped to an area of supply due to strong selling since.
The $3.18-level repulsed sellers multiple times as XTZ formed a rectangle bottom pattern, with recent hours seeing the price climb above the pattern’s upper boundary at $3.79. The RSI also climbed above 50 to show that momentum was swaying in favor of the market’s bulls.
Tezos’s trading volume had not yet validated this move, and XTZ still appeared to be in a short-term phase of consolidation. The $4 and $3.8-levels can be expected to act as resistance and support, and a drop back under $3.8 would likely see XTZ move towards $3.5.
Augur [REP]
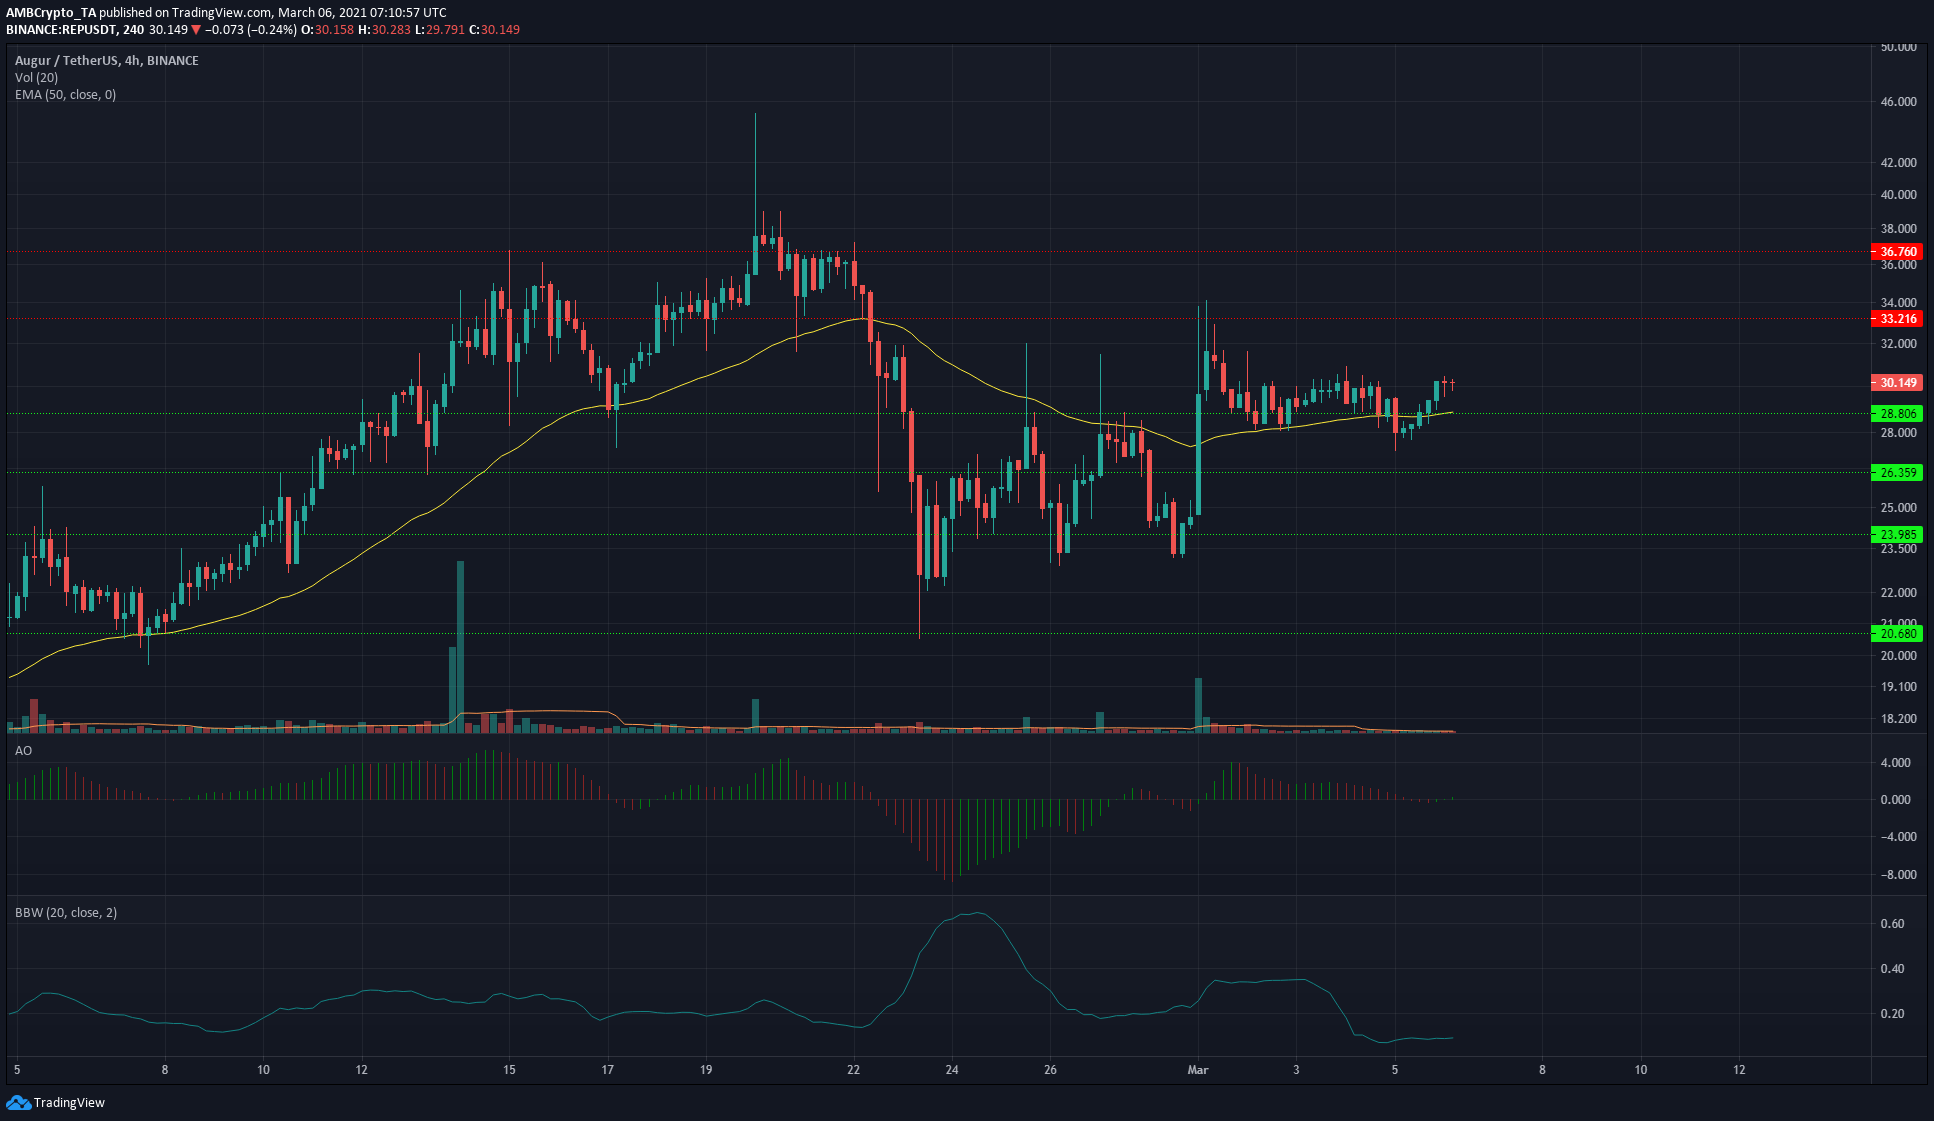
REP climbed above its 50-period EMA (yellow) and the Awesome Oscillator noted a faint move back above zero. However, this was not an indication of strong northbound momentum.
Over the past few days, the Bollinger Bands width indicator has been falling, with the price bouncing between $28 and $30.5. Over the same time period, any dips under the $28.8-support level have been bought up, showing that buyers are still present in force.
However, a move below the $28-zone would be a signal that bears are gaining strength.
Compound [COMP]
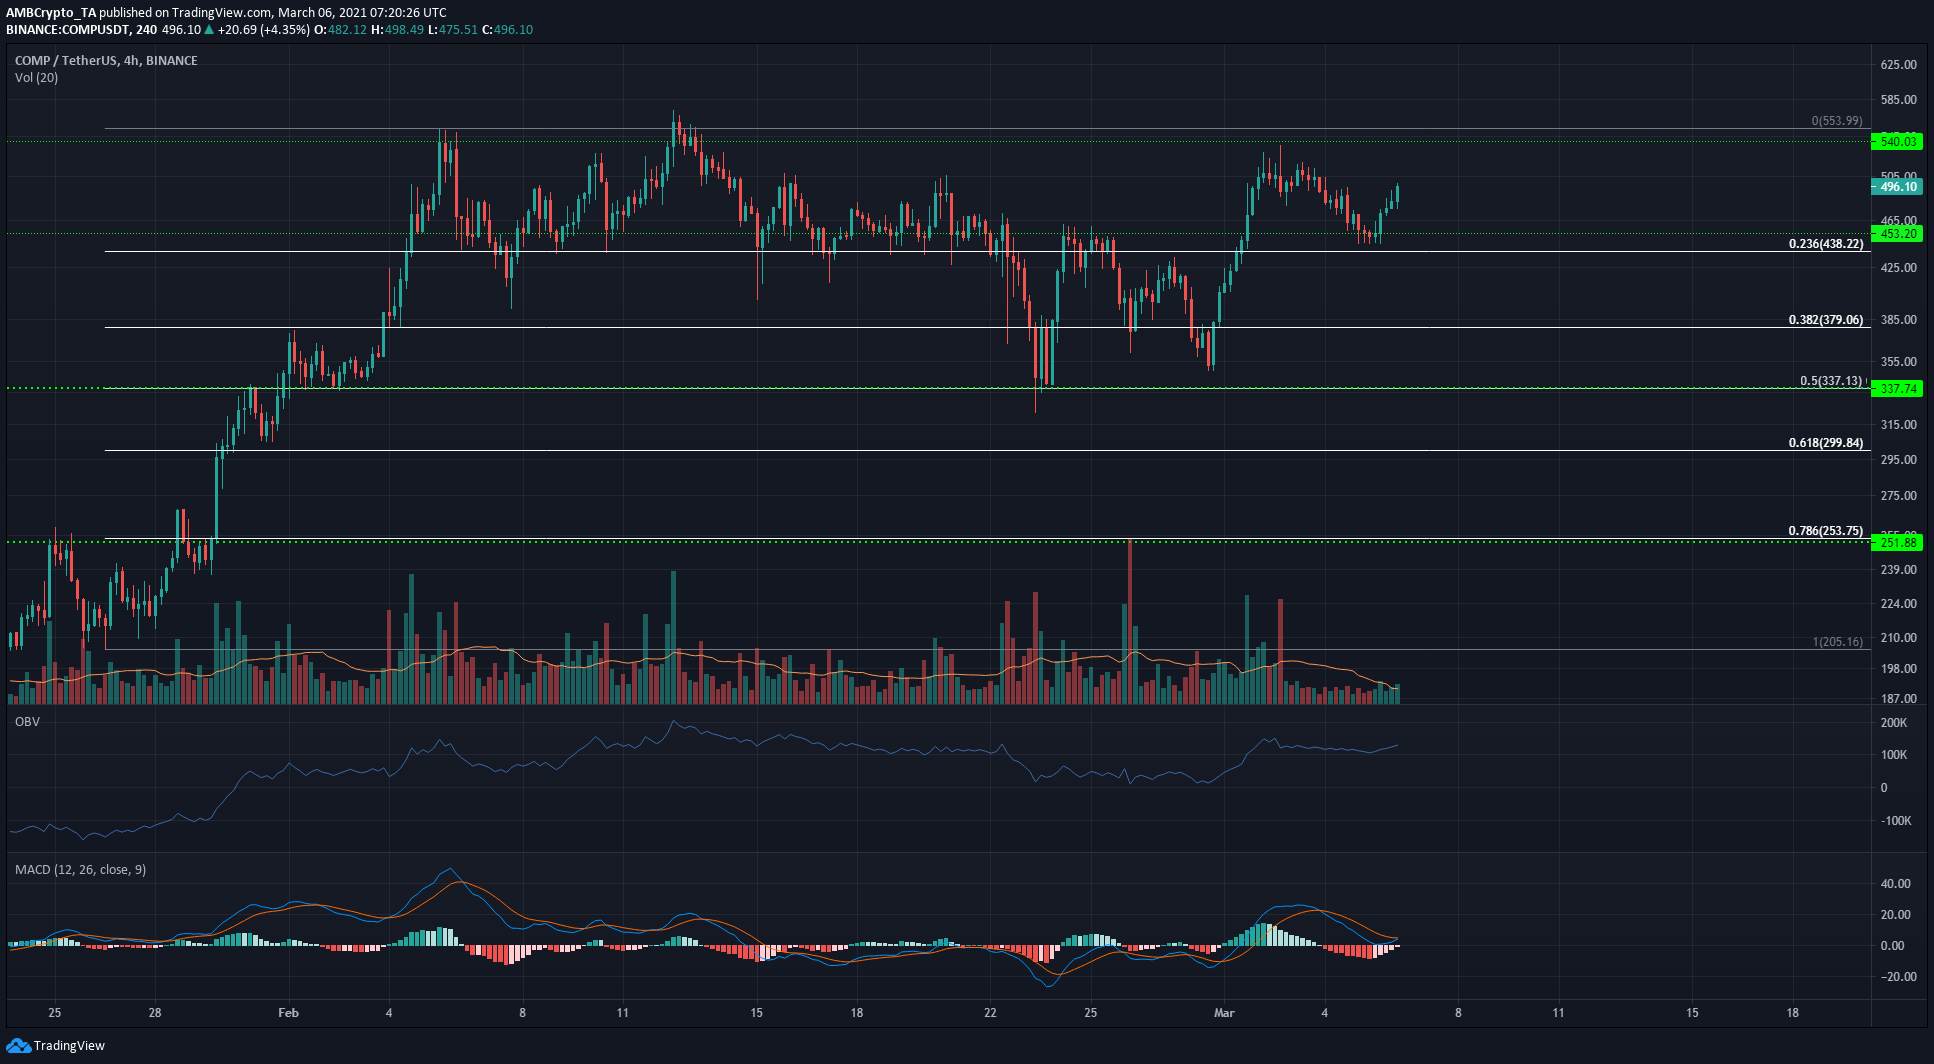
The Fibonacci retracement tool highlighted some levels of support for COMP based on its surge from $205 to $553 The 50% retracement level halted the strong selling pressure, and the 23.6% level at $438 was flipped to support recently as COMP posted some gains before a subsequent pullback.
The OBV did not note any sharp spike in selling volume as COMP dipped from the $500-mark to retest the $440-area as support. The MACD appeared on the verge of forming a bullish crossover once more, and COMP bulls would target the $500 and $540-levels over the next few days.


