Cardano Price Analysis: 21 March

Cardano’s price came very close to establishing a new ATH but fell prey to yet another trend reversal. In the past day’s time, the coin has seen a downtrend materialize and in the past 24-hours, ADA saw its price depreciate by over 5 percent.
At the time of writing, ADA was being traded at $1.19 and had a market cap of $38.4 billion.
Cardano 4-hour chart

Source: ADA/USD, TradingView
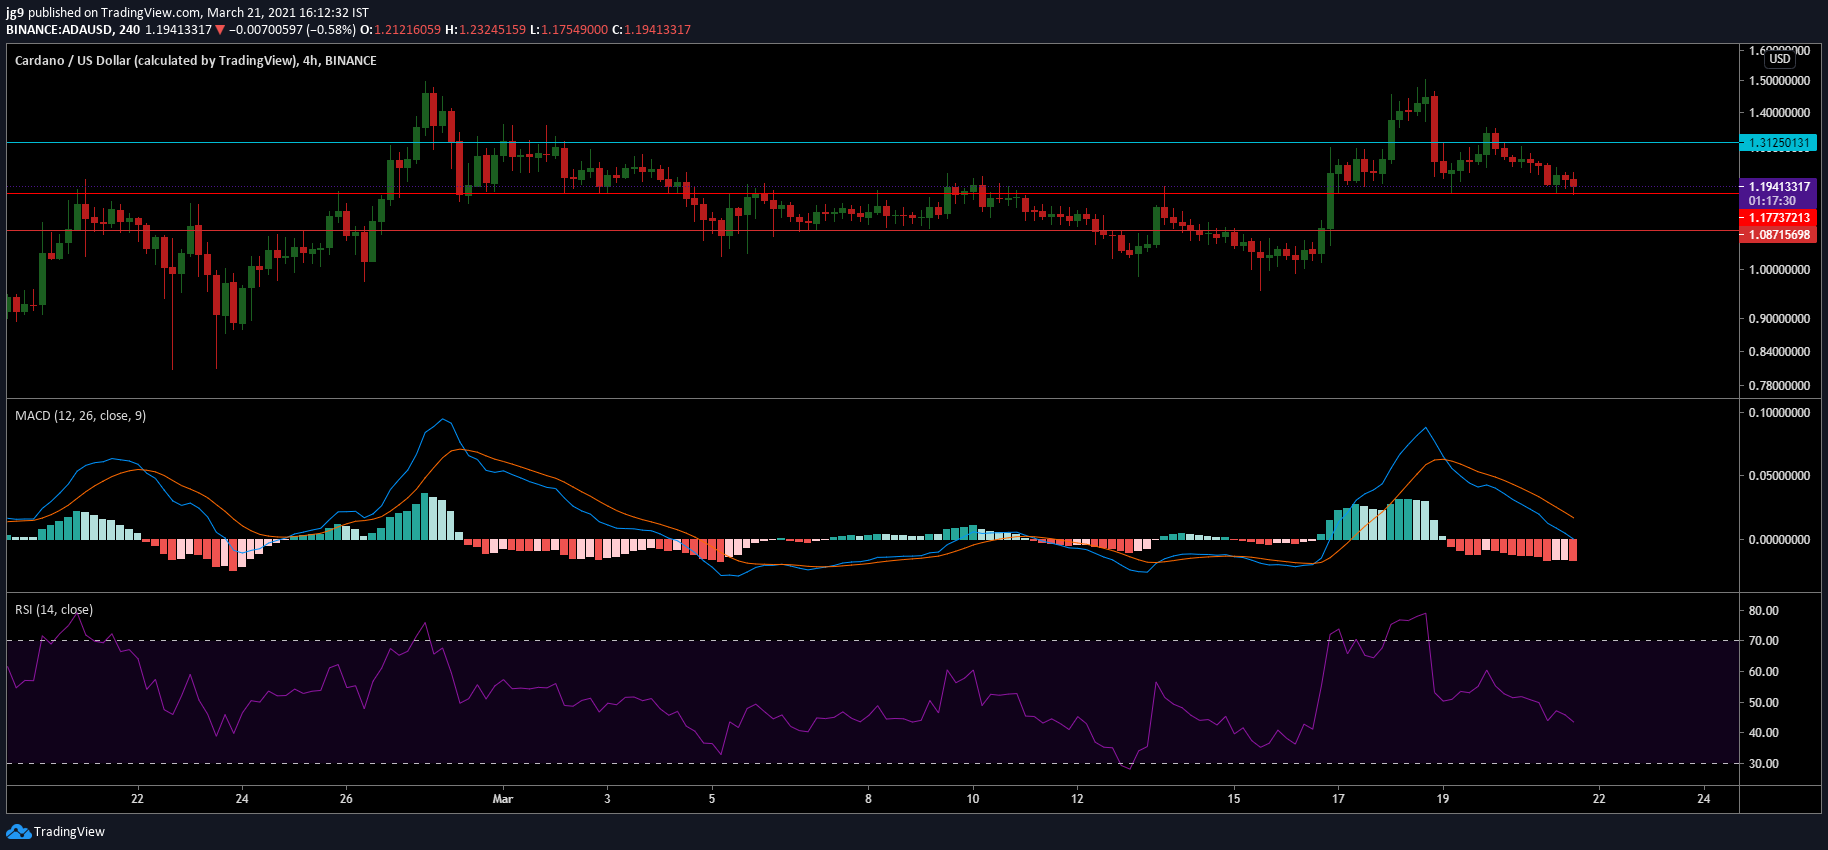
Cardano’s price action has seen a steady downtrend in the past 24-hours and in the past few hours, the coin’s support level at $1.17 has been able to arrest the fall and stabilize the price. However, in the short term, the bears seem to be in control of the ADA market and traders can expect a further drop in the coming 24-48 hours. Such a scenario is likely to take place if the present support fails, making ADA’s next short-term target, the price range around $1.08.
If the coin were to see a trend reversal and move upwards, ADA has to deal with the strong resistance range around the $1.31 level.
Rationale
The technical indicators for the coin support this point of view. Both the MACD indicator and the RSI show strong bearish sentiment in the market. The MACD indicator underwent a bearish crossover with its signal line going past the MACD line. At the moment there seem to be no signs of a trend reversal. The RSI indicator echoes a similar outlook as it has fallen from the overbought zone and gone deep into the oversold zone at the time of writing.
Conclusion
ADA’s price has seen a steady drop in the past 24-hours. While the price drop seems to have been stabilized by its immediate support, the coin still exhibits significant bearish pressure and is likely to see its price endure yet another drop in the short term before traders can expect a trend reversal. This may take the price closer to its second support $1.08 in the coming 24-48 timeframe.


