Stellar Lumens, VeChain, Zcash Price Analysis: 21 March

After market-leaders Bitcoin and Ethereum moved deeper into the red zone, the broader altcoin market followed suit and registered losses on their respective charts. Similarly, VET and XLM projected additional losses in the coming sessions, but ZEC showed some resurgence at the 50% Fibonacci retracement level. At the time of writing, Bitcoin traded at $56,306, while Ethereum touched $1,770.
Stellar Lumens [XLM]

Source: XLM/USD, TradingView
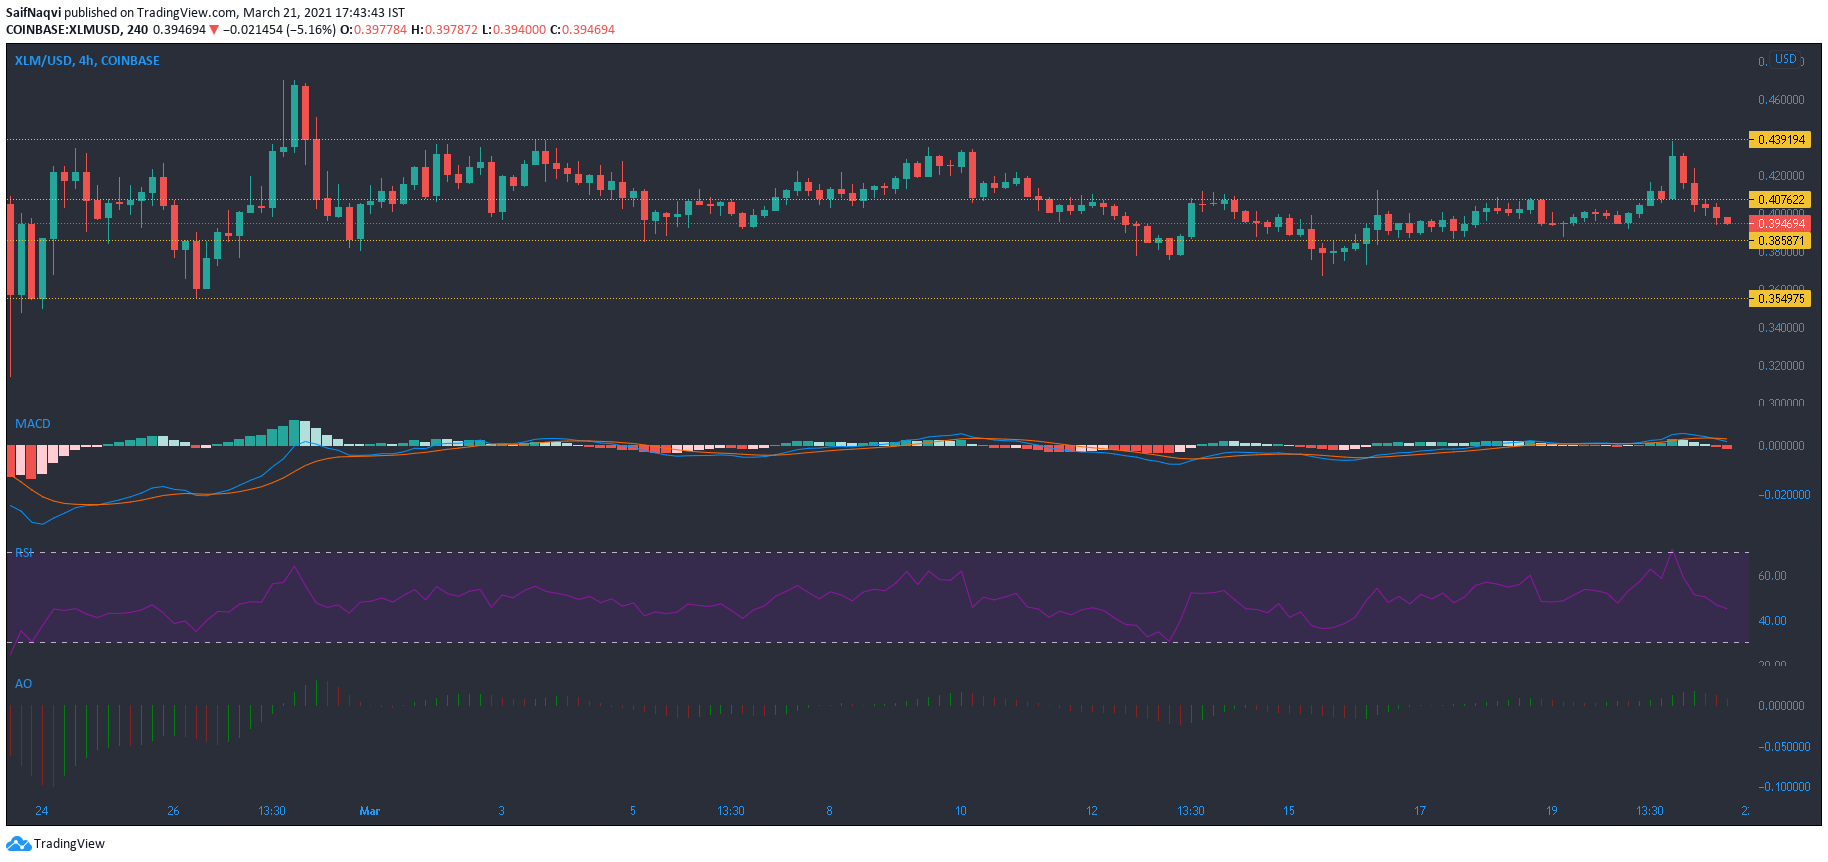
Stellar Lumens traded at $0.394, down by 4% in the last 24 hours. The former top 10 cryptocurrency lost out to $0.0407 support at the time of writing, and the technicals signaled more short-term losses.
The Awesome Oscillator noted momentum on the bearish side, and if the same moved below the half-line, XLM would likely break below its press-time support as well. The RSI was yet to reach its tipping point in the oversold territory and showed bearish strength in the market.
VeChain [VET]

Source: VET/USD, TradingView
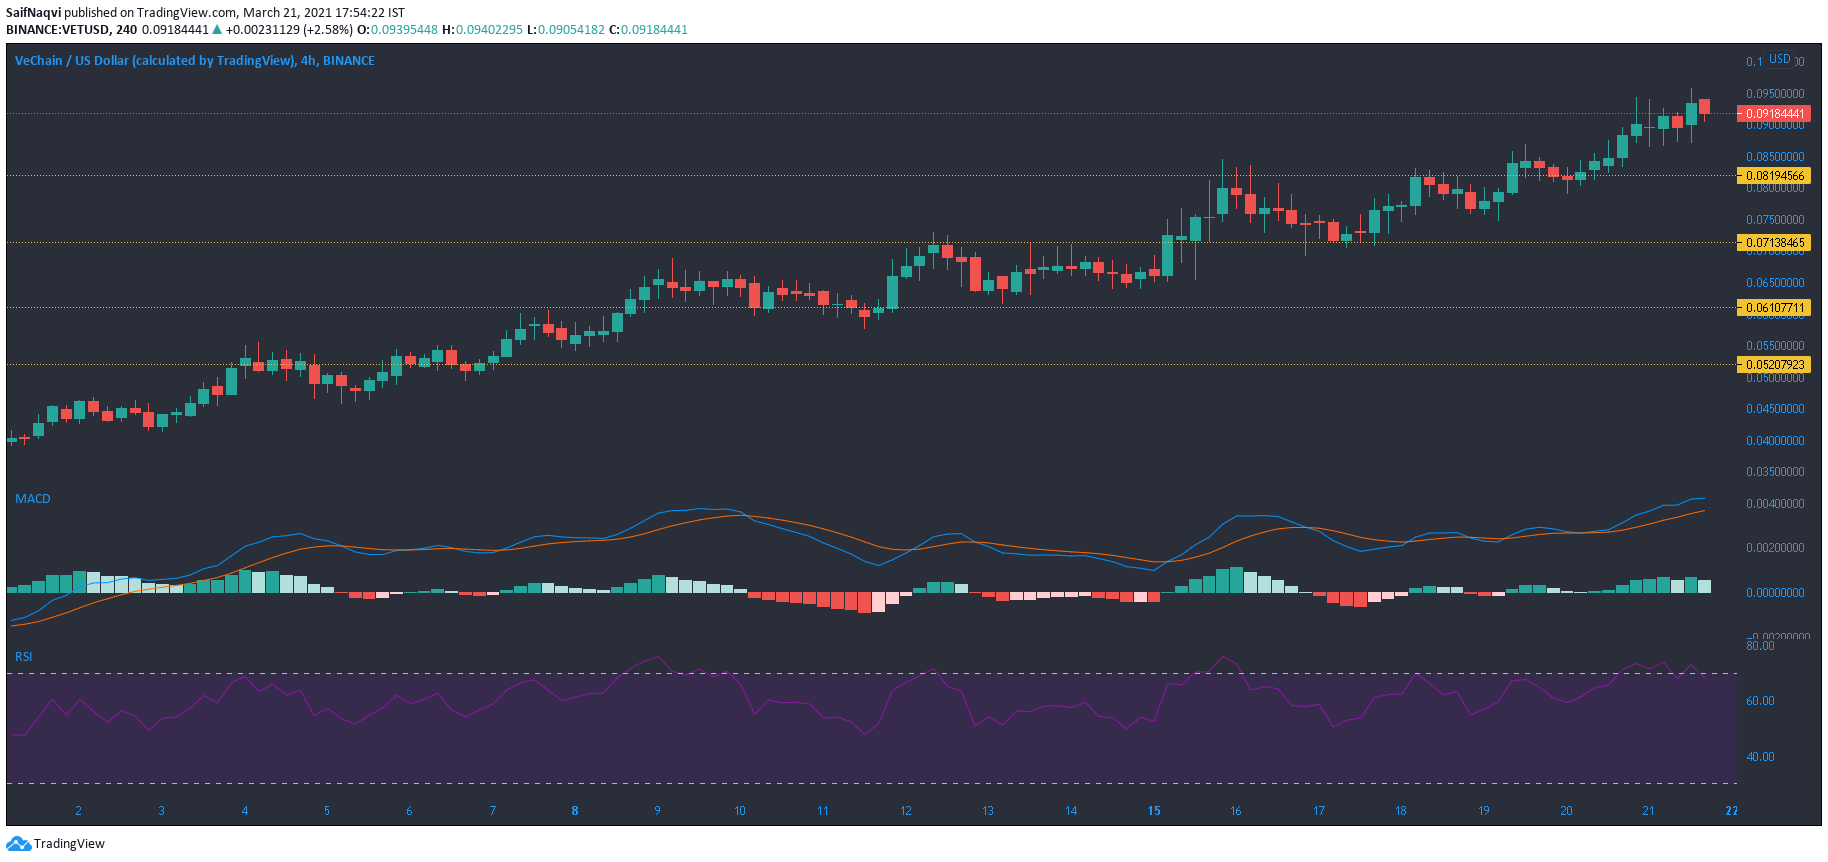
Even though VeChain surged by over 8% in the last 24-hours, a potential reversal was on the cards, considering the bearish nature of the broader market. The RSI showed an oversaturation of buyers and pointed lower from the oversold region as a red candlestick appeared on the 4-hour chart.
The MACD line did move above the Signal line, but the histogram noted weakening momentum on the buying side. However, healthy trading volumes worked against a bearish outcome and the next few sessions would add more clarity in terms of a correction from record levels.
Zcash [ZEC]

Source: ZEC/USD, TradingView
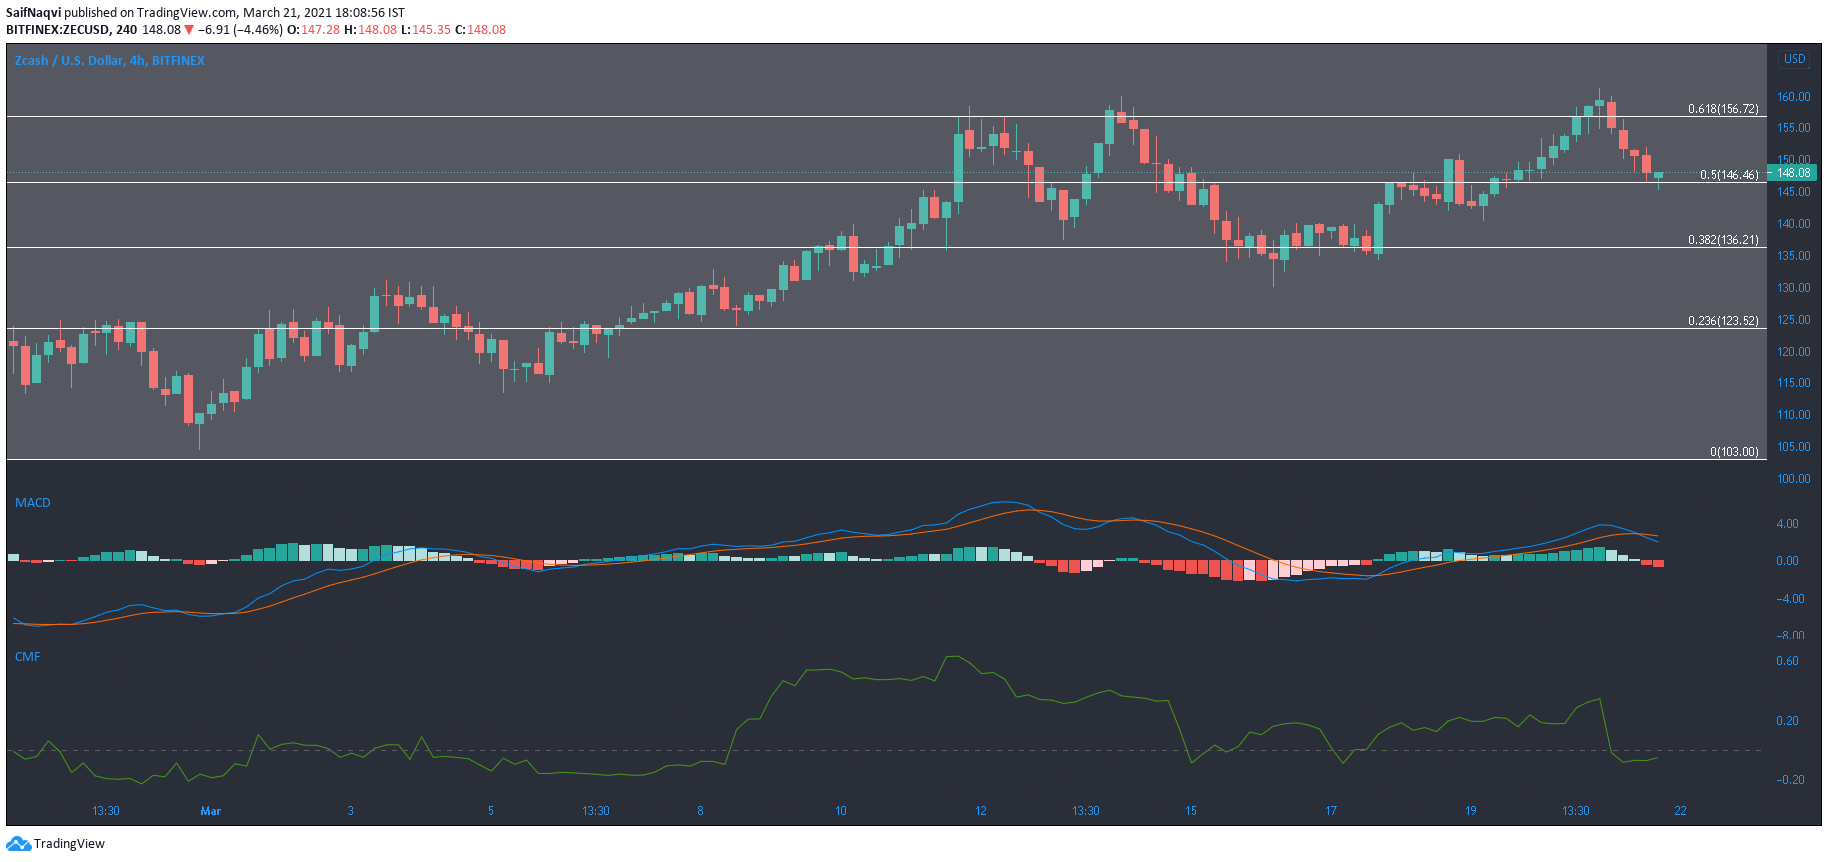
Zcash was in danger of losing out to the important 50% Fibonacci retracement level, which is usually considered a continuation level. A fall below the aforementioned mark could signal the continuation of a downtrend for ZEC. The 38.2% level rested at $136.21, and further bearish cues from the broader market would likely see the price move closer to that point.
A bearish crossover in the MACD signaled incoming losses, especially if the red bars on the histogram increase in length. The Chaikin Money Flow showed strong capital outflows as the index slipped below the half-mark.


