Uniswap, Monero, Ethereum Classic Price Analysis: 10 April

Uniswap could dip back towards $26.2 support if the price is unable to flip the $32-resistance. Monero’s bullish movement was confined within an ascending triangle and a breakdown was still likely over the long term. Finally, Ethereum Classic was projected to go against the norm and break below its symmetrical triangle.
Uniswap [UNI]
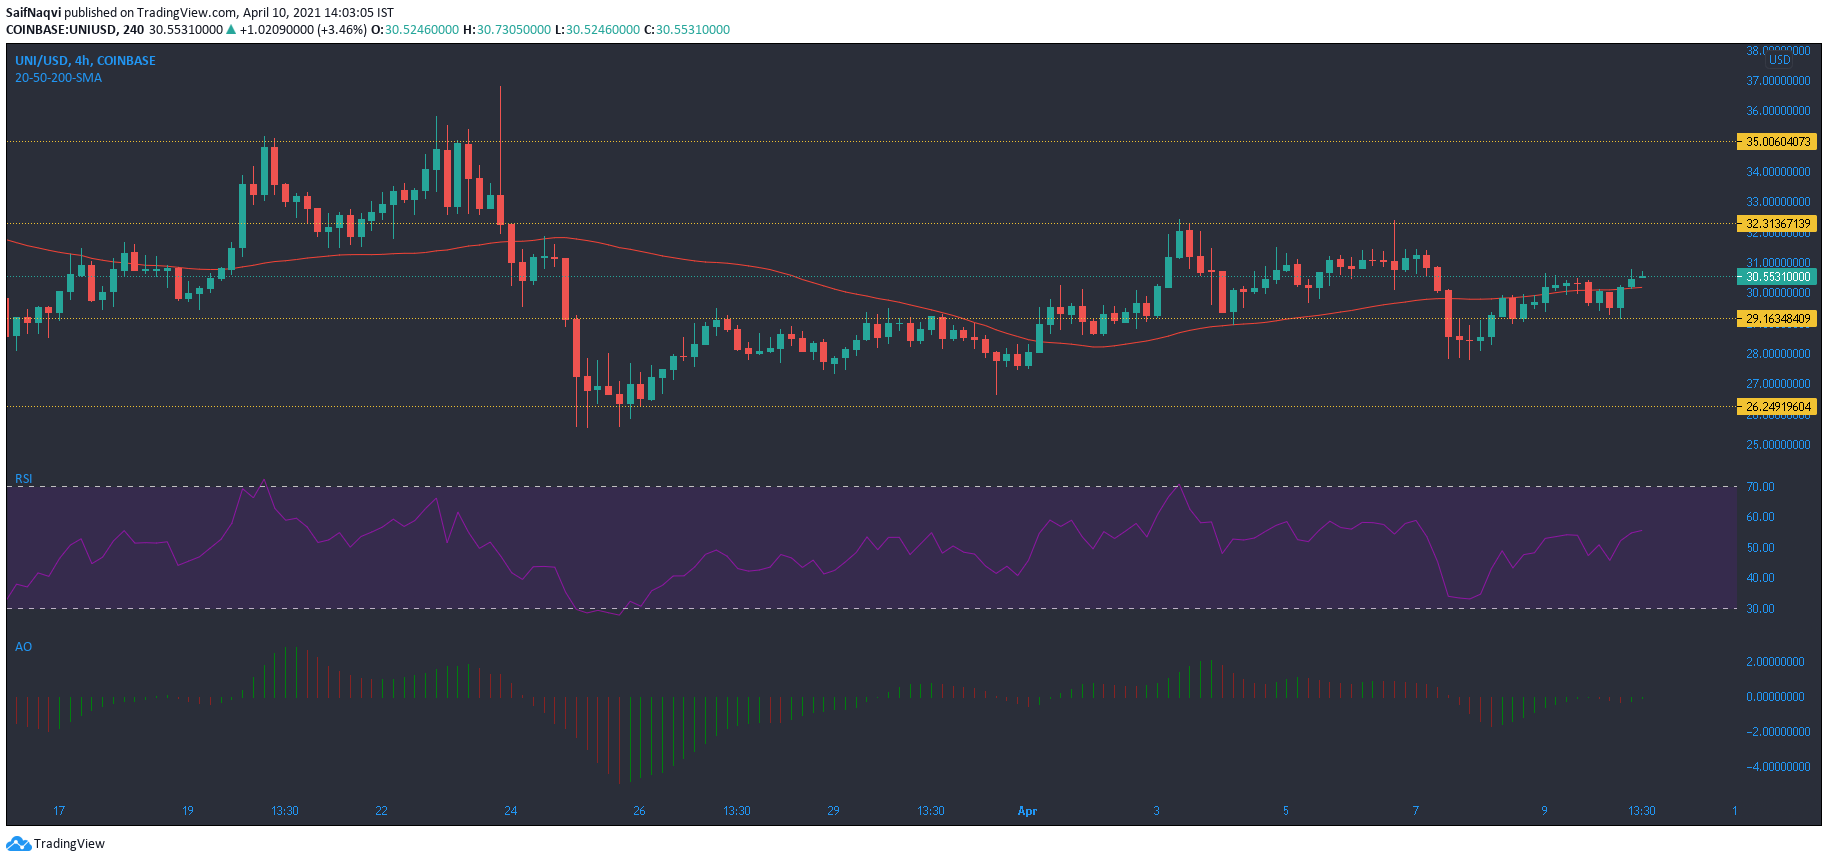
Uniswap formed three peaks above the $35-mark during early March but failed to break above the aforementioned level, which eventually led to a breakdown. Although UNI picked up from $26.2-support, resistance at $32 capped gains over the last few days. If the price does peak at $32 but fails to move higher, then another breakdown can be expected over the long term.
Some optimism arose from the fact that a couple of candlesticks closed above the 50-SMA (red) during the last couple of sessions. The RSI also pointed north from near 60 and showed a degree of bullish strength in the market. However, trading volumes had not picked up enough to support a large price swing. The Awesome Oscillator reflected a bullish-neutral market but the same was below the half-mark.
Monero [XMR]
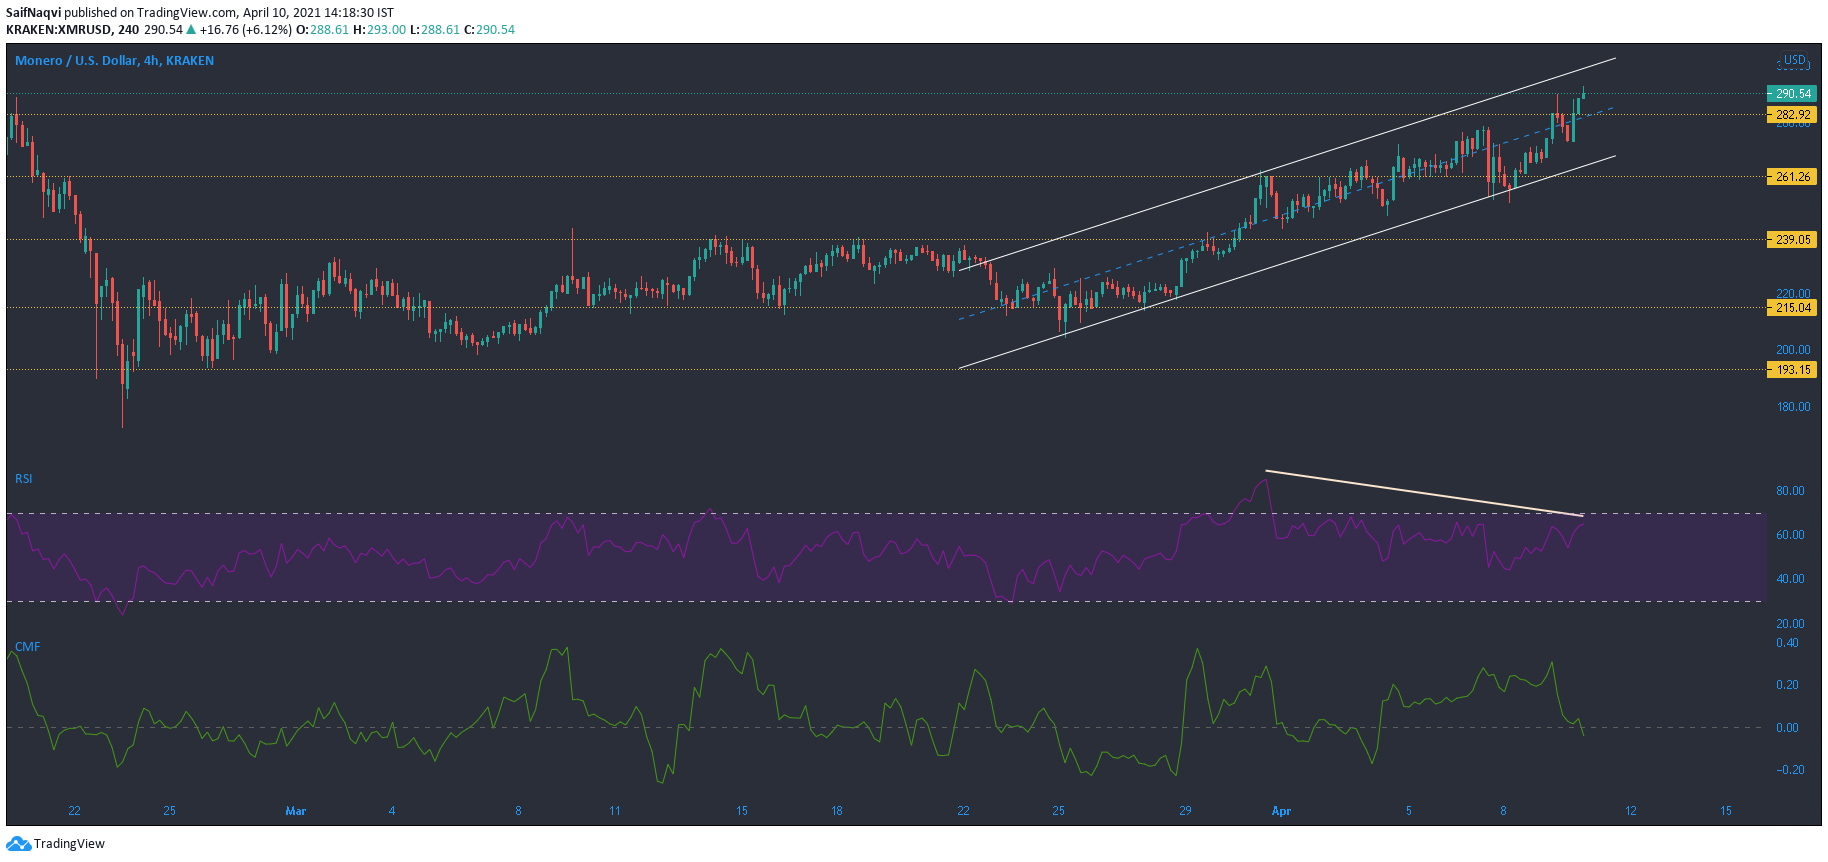
Monero was on the move over the last 24 hours as consecutive bullish candlesticks appeared on its 4-hour chart. However, the movement was still well within its ascending channel- a pattern that usually sees a breakdown from the bottom sloping trendline.
While the RSI has generally enjoyed a bullish position over the last 10 days, a bearish divergence was spotted after it formed lower highs. This reiterated a breakdown prediction. Meanwhile, the CMF fell below the half-line as capital moved away from XMR. While this was not particularly concerning, capital outflows have restricted XMR’s upward movement. A break below the bottom trendline could be cushioned at a support line of $239.05.
Ethereum Classic [ETC]
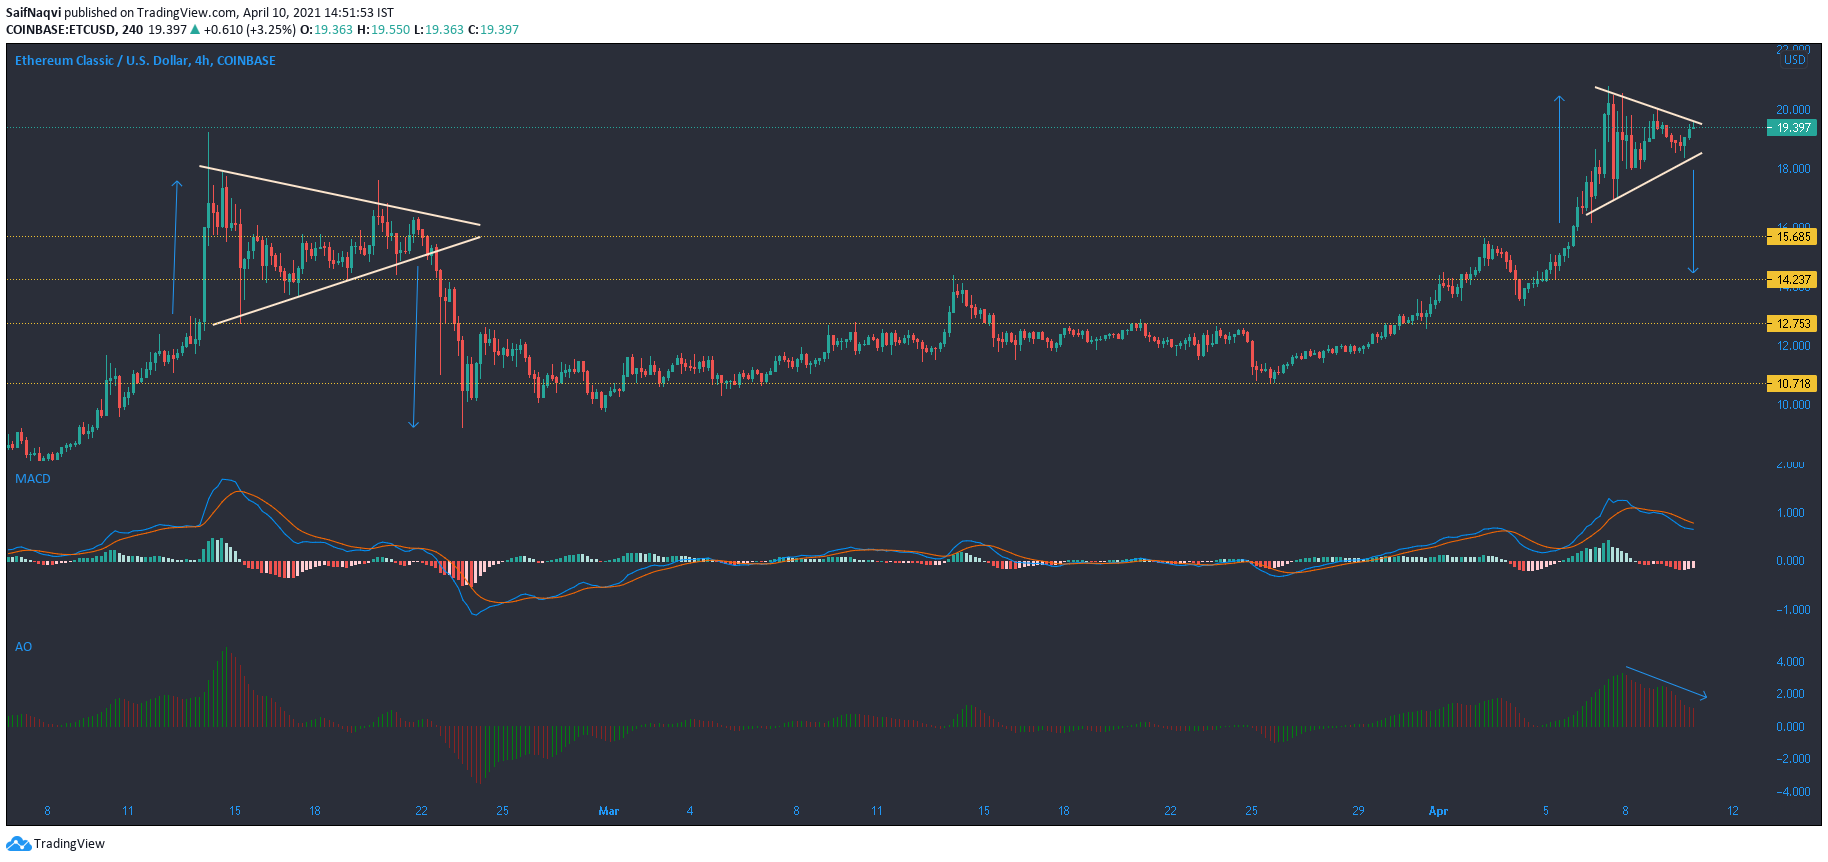
After the rangebound movement was seen during most of March, Ethereum Classic saw a breakout above $14.2 and this led to a price rally. The rally peaked at a high of $20.7 and a symmetrical triangle formed after lower highs were observed over the past few sessions. While an upwards breakout is normally expected if treated as a continuation pattern, an opposite trend was observed over the last two triangles that ETC formed on its 4-hour chart.
Symmetrical triangles formed in both January (not shown) and February led to a sharp breakdown and the same was expected moving forward. According to the MACD, there was a degree of bearishness in the market, even though the fast-moving line gained some ground on the Signal line. A bearish twin peak setup was also spotted on the Awesome Oscillator. If the price does move below the lower trendline, support areas reside at $15.6 and $14.2. On the opposing end, a bullish broader market could boost ETC north of its upper trendline and towards $21.