Stellar Lumens, Aave, Cosmos Price Analysis: 11 April

Stellar Lumens moved within a bull flag but the pattern could be negated if $0.58 -support is not maintained. Aave needed stronger cues to climb above its 200-SMA, while ATOM was likely to remain below its upper ceiling of $22.6 over the short term.
Stellar Lumens [XLM]

Source: XLM/USD, TradingView
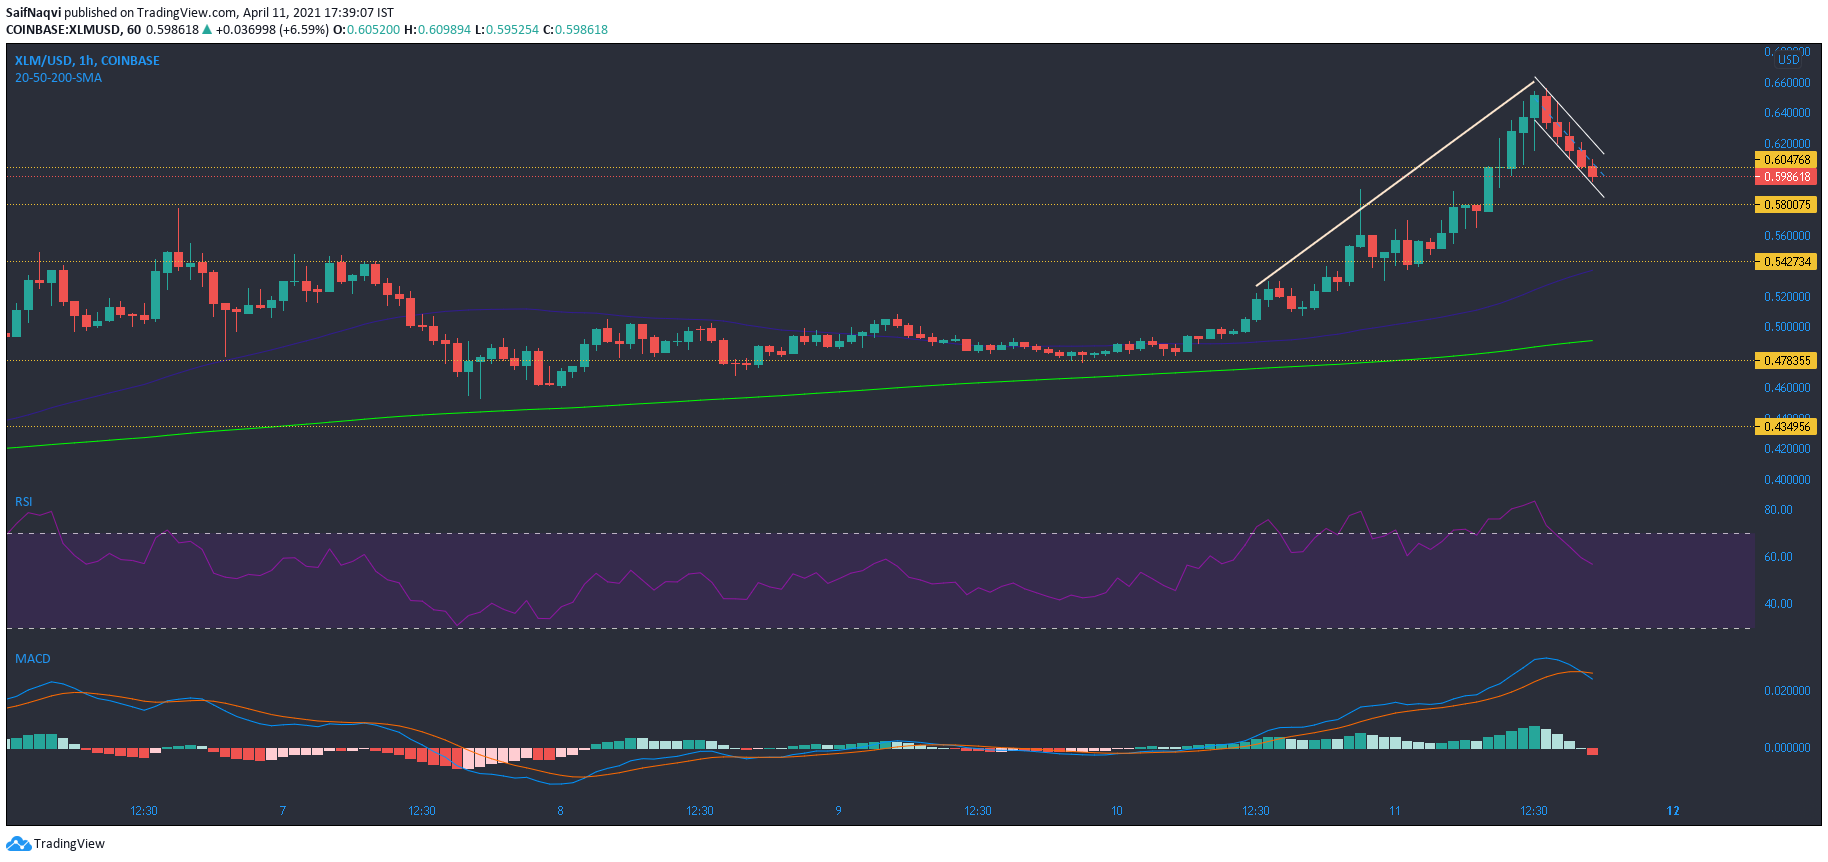
Weekly gains in the Stellar Lumens market amounted to 41% as the price showed a strong uptrend since bouncing back from the $0.478 mark. However, the market switched to a bearish stance and this was clearer on the 1-hour charts. Successive red candlesticks appeared as XLM broke below $0.604-support.
However, the movement was still within a bull flag pattern and a favorable outcome was possible over the coming sessions. This would depend on the bulls defending the next line of defense at $0.58. A bullish outcome could boost the price to $0.7. On the flip side, an extended sell-off can be countered at $0.542-support (coincides with 50-SMA) or $0.478-support (coincides with 200-SMA). At the time of writing, the MACD showed a bearish crossover, while the RSI pointed south from 57.
Aave [AAVE]

Source: AAVE/USD, TradingView
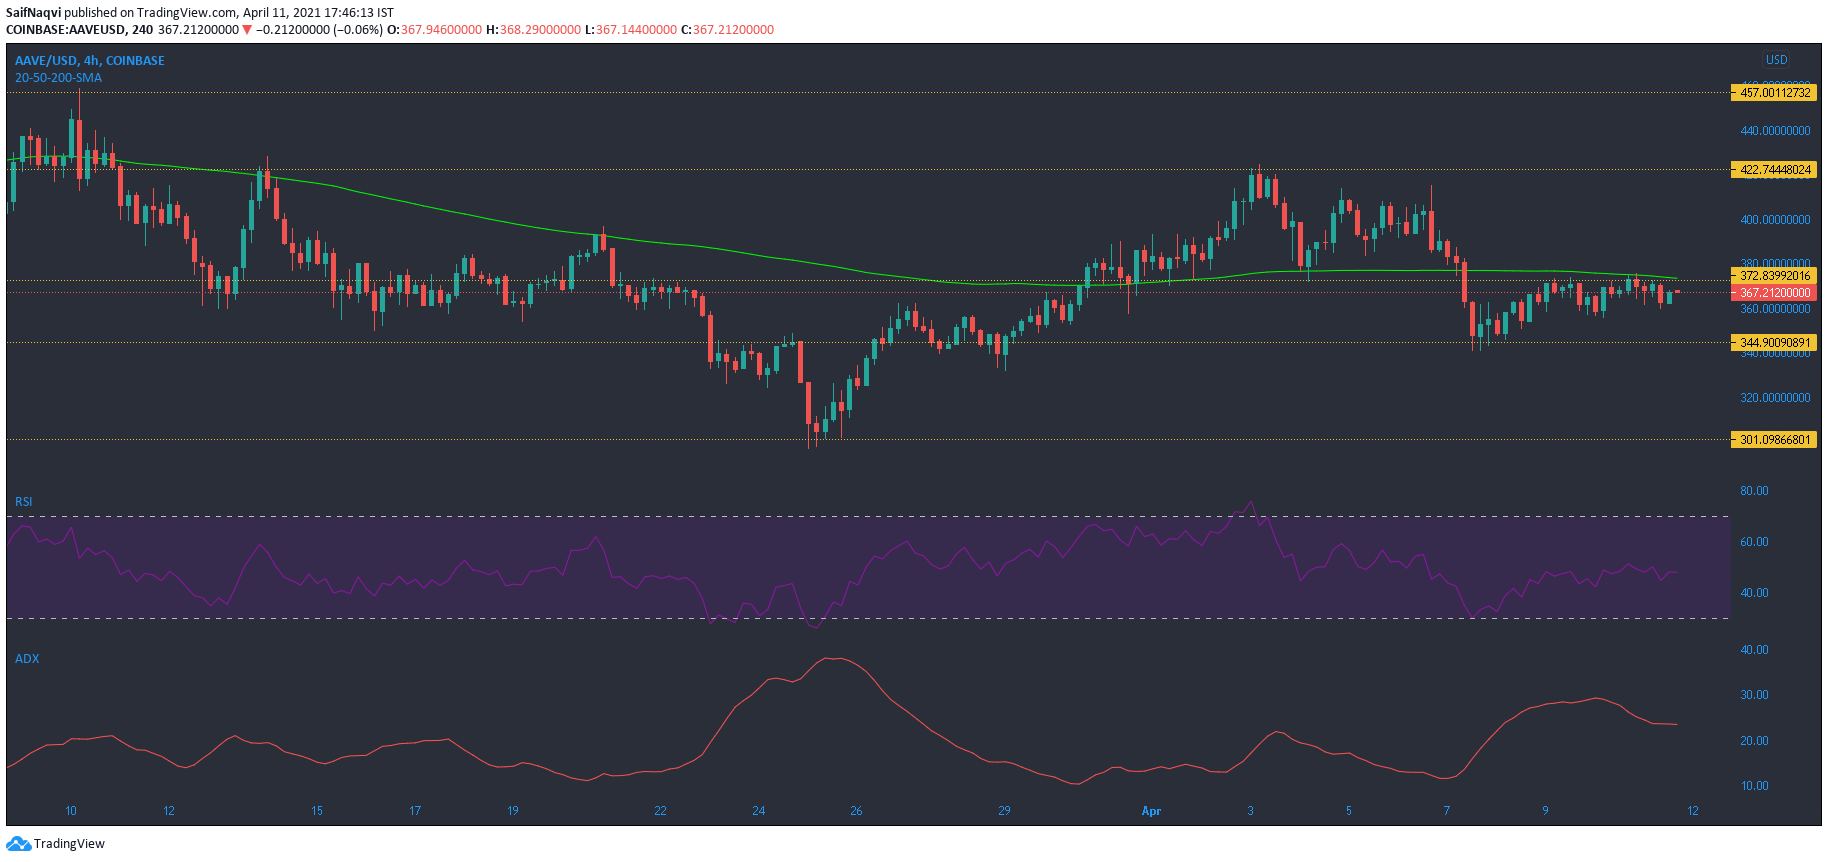
Aave remained below its 200-SMA (green) on the 4-hour timeframe and the indicators reflected some neutrality in the current price of $368. The ADX flattened below 25 after dipping over the last few sessions. The RSI floated at 47 and did not side strongly with either the bulls or bears.
On the plus side, the 24-hour trading volumes ticked up slightly but more needed to accumulate for a sharp price swing. When the swing does take place, gains could be capped at the upper ceiling of $422.7.
Cosmos [ATOM]

Source: ATOM/USD, TradingView
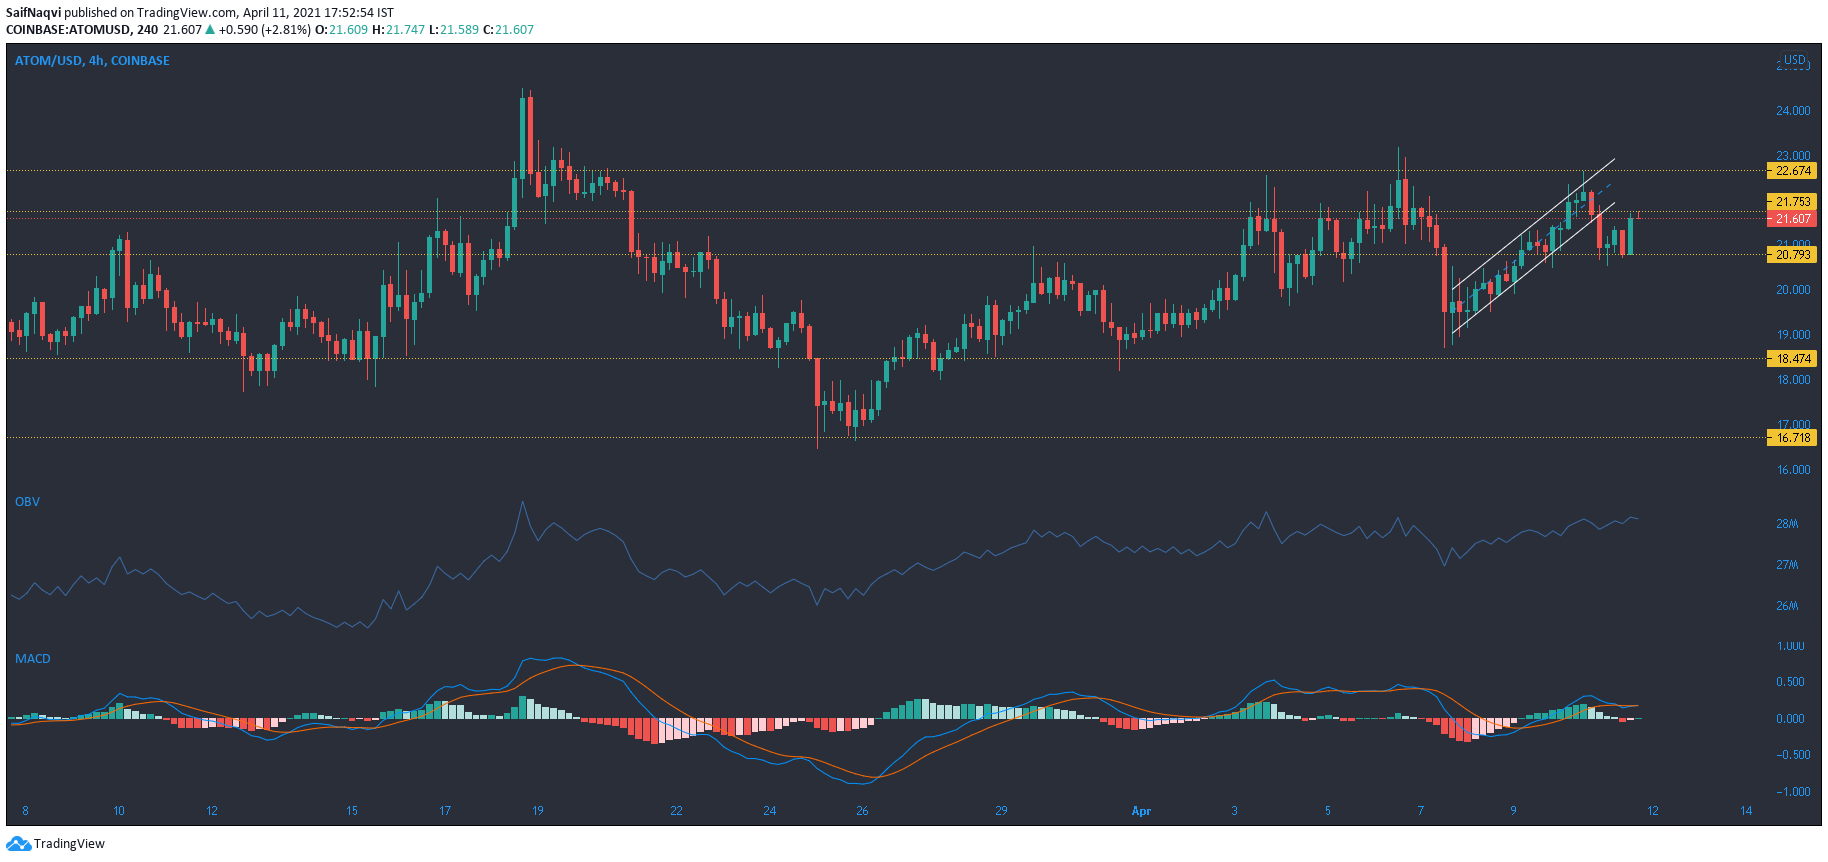
A breakdown from an ascending channel saw Cosmos dip towards $20.7-support on the 4-hour timeframe. The price bounced back from this level and attempted to breach $21.7 resistance at the time of writing.
The OBV has trended higher over the past few sessions and buying pressure would certainly help a price push, but the MACD was less optimistic of a favorable outcome. If the Signal line maintains above the fast-moving line, ATOM would remain below the upper ceiling of $22.6. Moreover, weak trading volumes denied the possibility of a large price swing at least over the short term.


