Tezos, Algorand, Zcash Price Analysis: 19 June

After Bitcoin plummeted to $35,000 in the early hours of the day, correlated altcoins too followed the same path. The king coin lost 5.4% of its value over the past 24 hours while the total crypto-market cap was reduced by 4.4%. However, quick gains made over the past few hours led Tezos and Zcash to start trading in the green, even as they oscillated between restricted price ranges.
On the contrary, ALGO continued its southbound movement and was pushed to its May levels. Market volatility seemed to be dying down, although some bearish sentiments remained.
Tezos [XTZ]

Source: XTZ/USD, TradingView
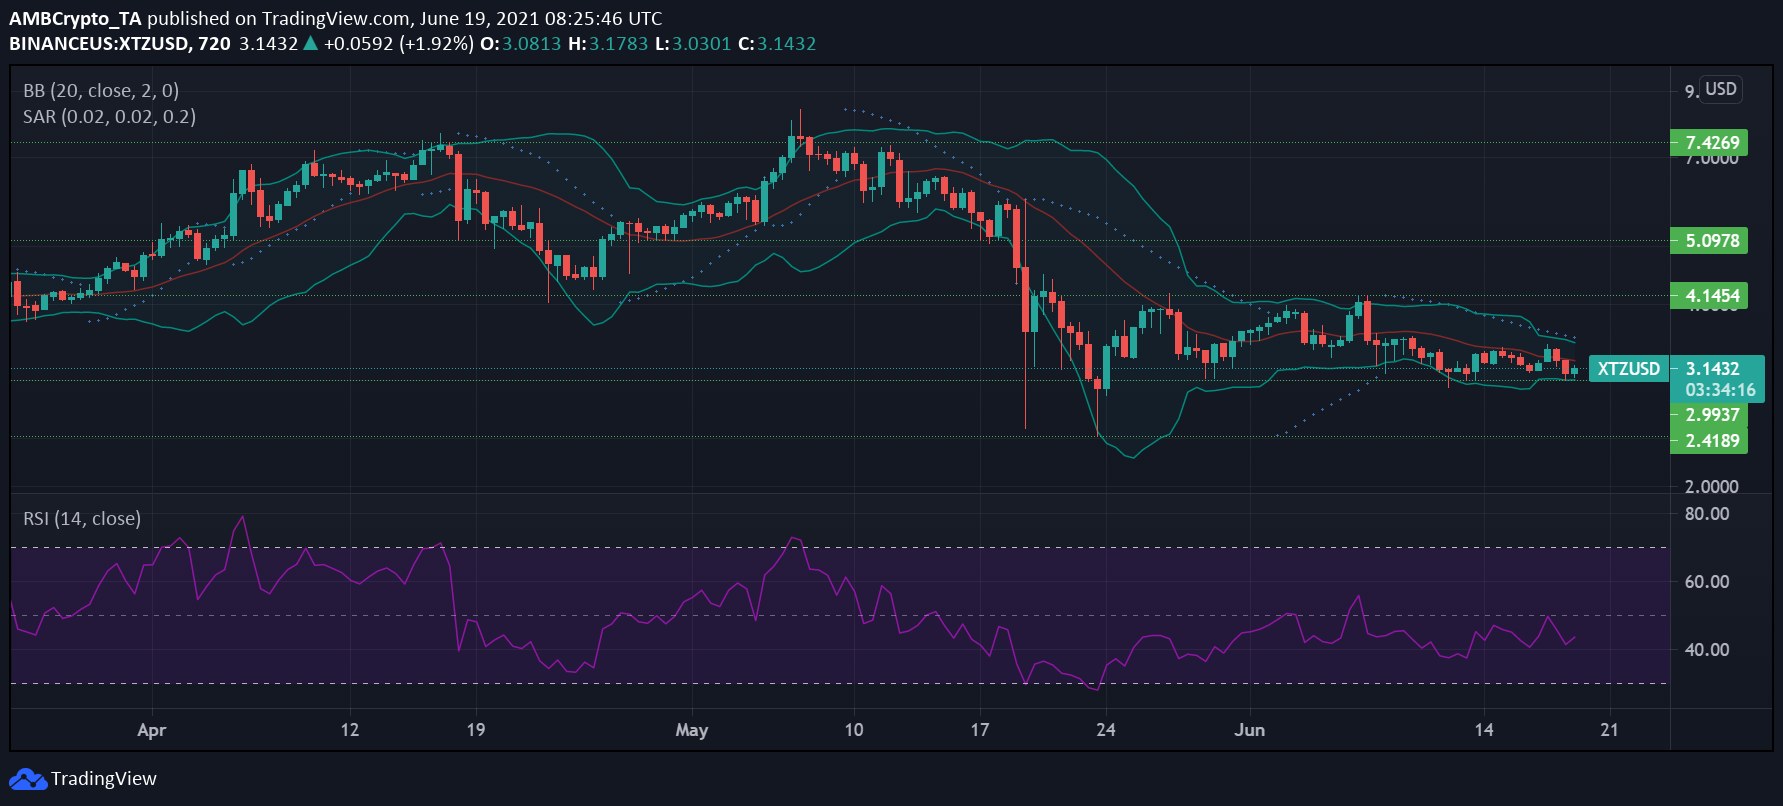
Since the fall in May, Tezos has been largely oscillating between $4.14 and $2.99 on the 12-hour chart. XTZ has also been slow in making recoveries and has been moving sideways since the 21% drop on 7 June. After seeing a further fall of 3.7% over the previous day, the coin tested its support level. The trading session, at the time of writing, did see the appearance of a green candlestick, however, as the price started to move north.
The Relative Strength Index or RSI remained below the median line, where it has been since 7 June, as the selling pressure continued to dominate. It must be noted, however, that the constant downtrend of the indicator did note an uptick at press time.
The Bollinger Bands began to converge and suggested that market volatility was dying down. The asset’s bear run that started on 7 June remained as the Parabolic SAR’s dotted markers continued to hover above the candlesticks.
Algorand [ALGO]

Source: ALGO/USD, TradingView
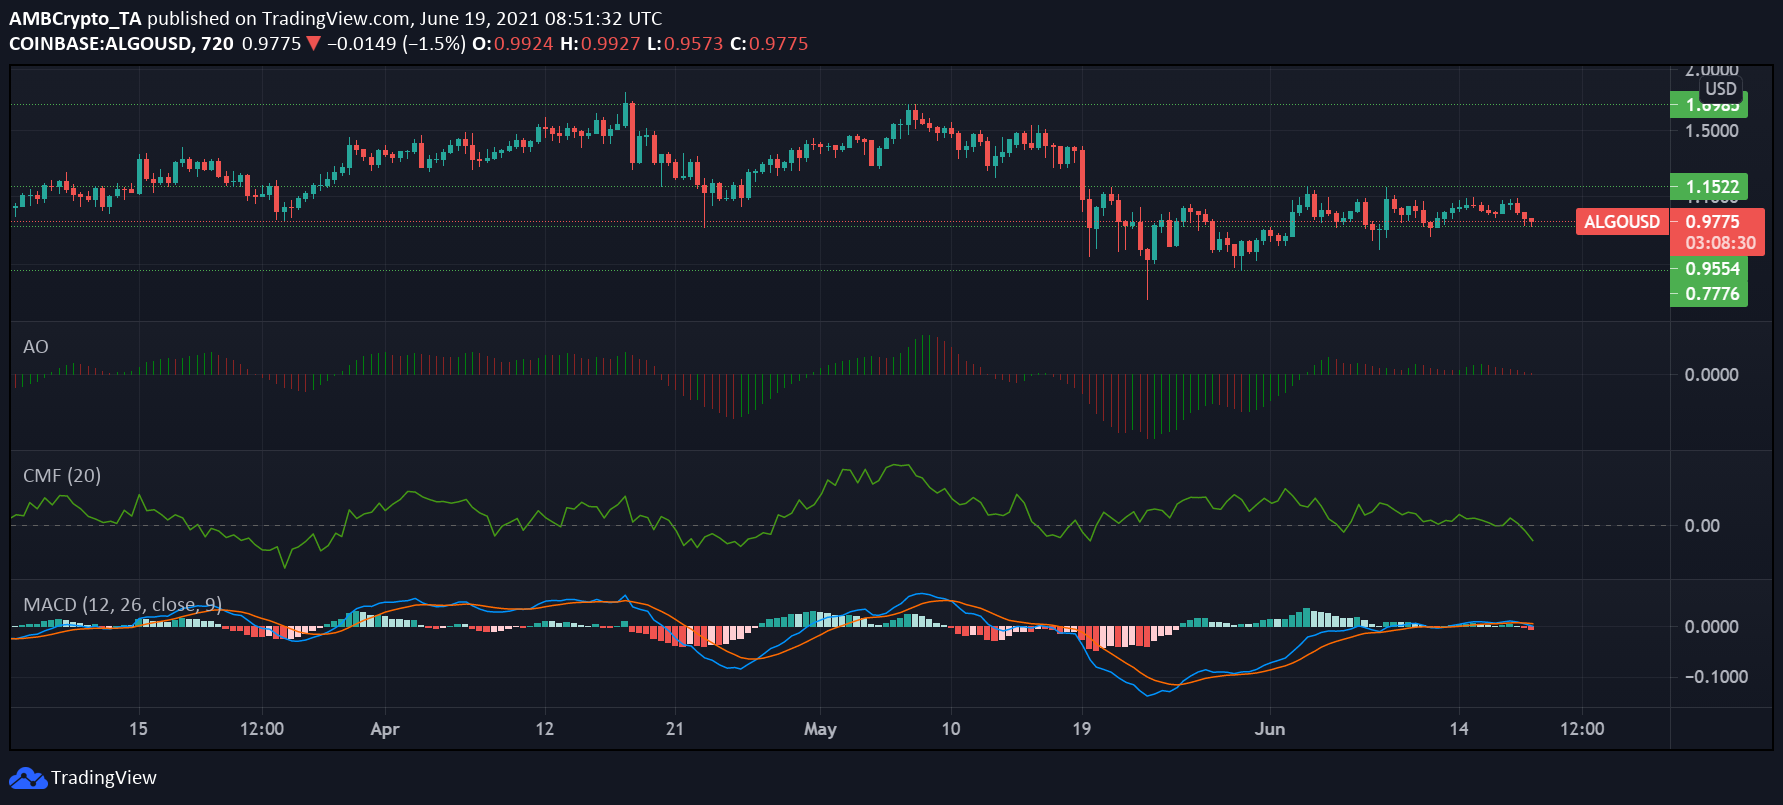
ALGO’s recovery remained halted at the $1.52 resistance level, breaching which could see the coin rallying up the $1.69-mark. However, at the time of writing, the coin had dropped by 11.6% and was testing the 0.955 resistance. Trading at $0.77, ALGO rose by a mere 1.9% in valuation over the past month.
The MACD registered a bearish crossover during this time as the Signal line moved above, pointing to the chances of the price falling further. The red bars on the Awesome Oscillator’s histogram indicated that bearish momentum was building up. The fall in price triggered sell-offs as the capital outflows surged and the Chaikin Money Flow moved below the zero-level into bearish territory.
If the bearish sentiment continues, it could lead to the asset’s price plummeting to the $0.77-support mark, where it had last been in May.
Zcash [ZEC]

Source: ZEC/USD, TradingView
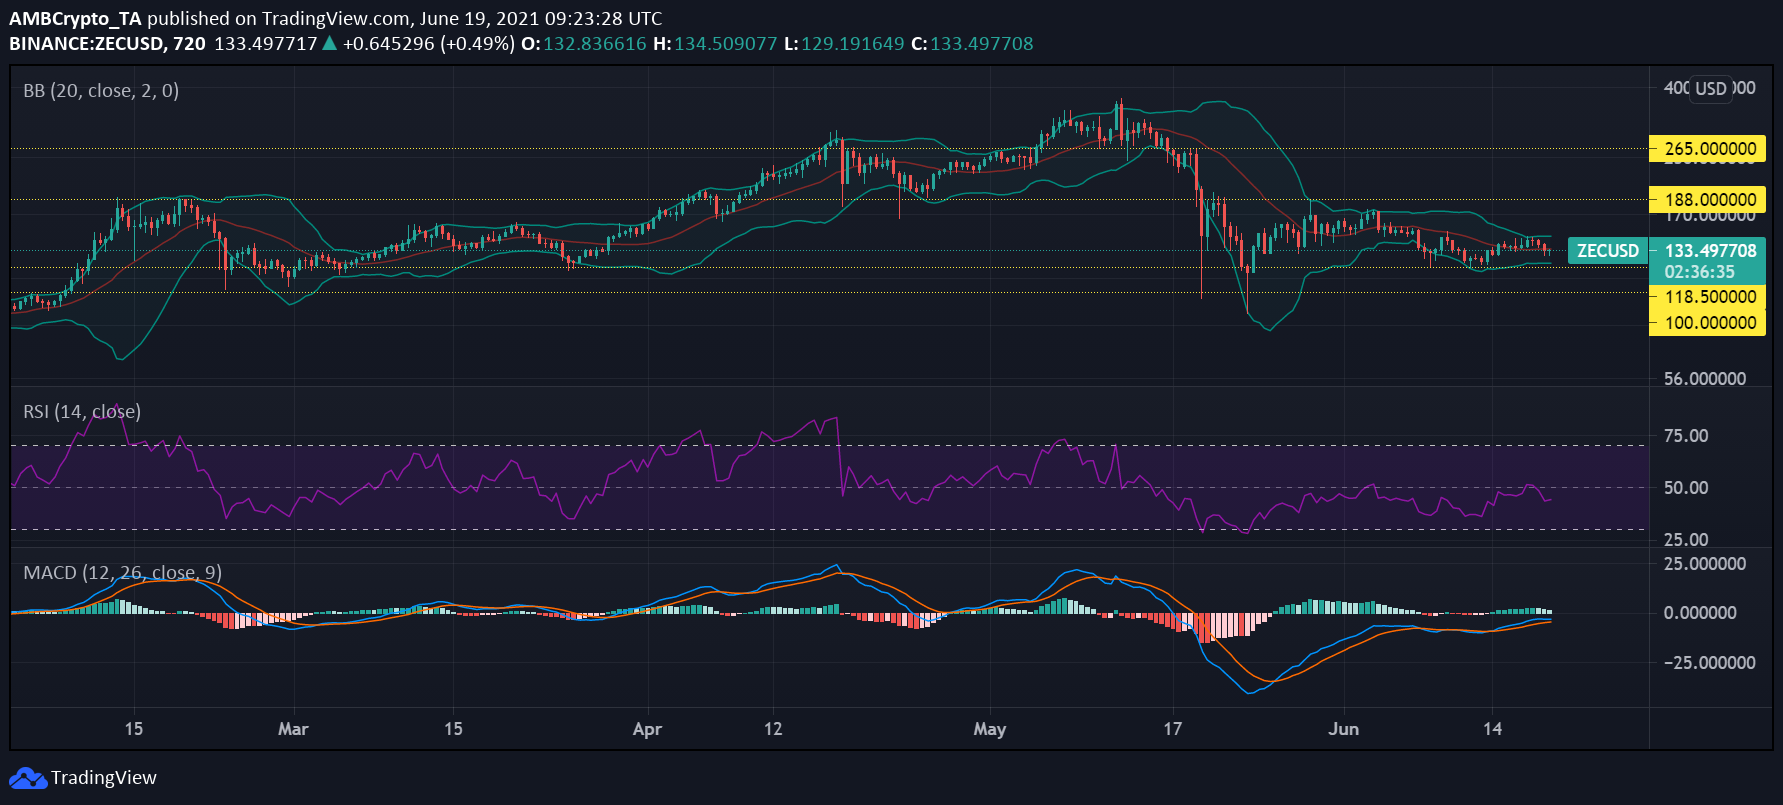
Zcash has been facing an extended period of bearish sentiment since May, trading between the $188 resistance and $118 support. Gains have been limited with the resistance being tested at different intervals. The 65th ranked coin was trading at $134, at the time of writing, after losing 5% of its value over the past 24 hours. ZEC was down 57.56% from its ATH 4 years back.
The asset has experienced negative buying pressure since 15 May when the Relative Strength Index moved below the median line. It noted a figure of 45 at press time. A short breakthrough on 17 June was quickly pushed back by the bears.
The MACD lines moved in rather close proximity to each other, after undergoing a bearish crossover. The parallelly moving Bollinger Bands signaled stable market volatility and mild price action going forward.


