‘When this occurs, Bitcoin is likely to see’ this movement

Even though the crypto market’s king coin had a stupendous rally during the initial few months of 2021, the persistent bearish phase that commenced right after has managed to dominate the market now.
Over the past week, Bitcoin shed 4.21% of its value and was trading in the $33k range at press time. Nevertheless, the sole unanswered question that hovers the market at the moment is – When would BTC start rallying up again? Well, even though there is no straight-forward answer to this question, Bitcoin’s on-chain metrics do provide certain hints.
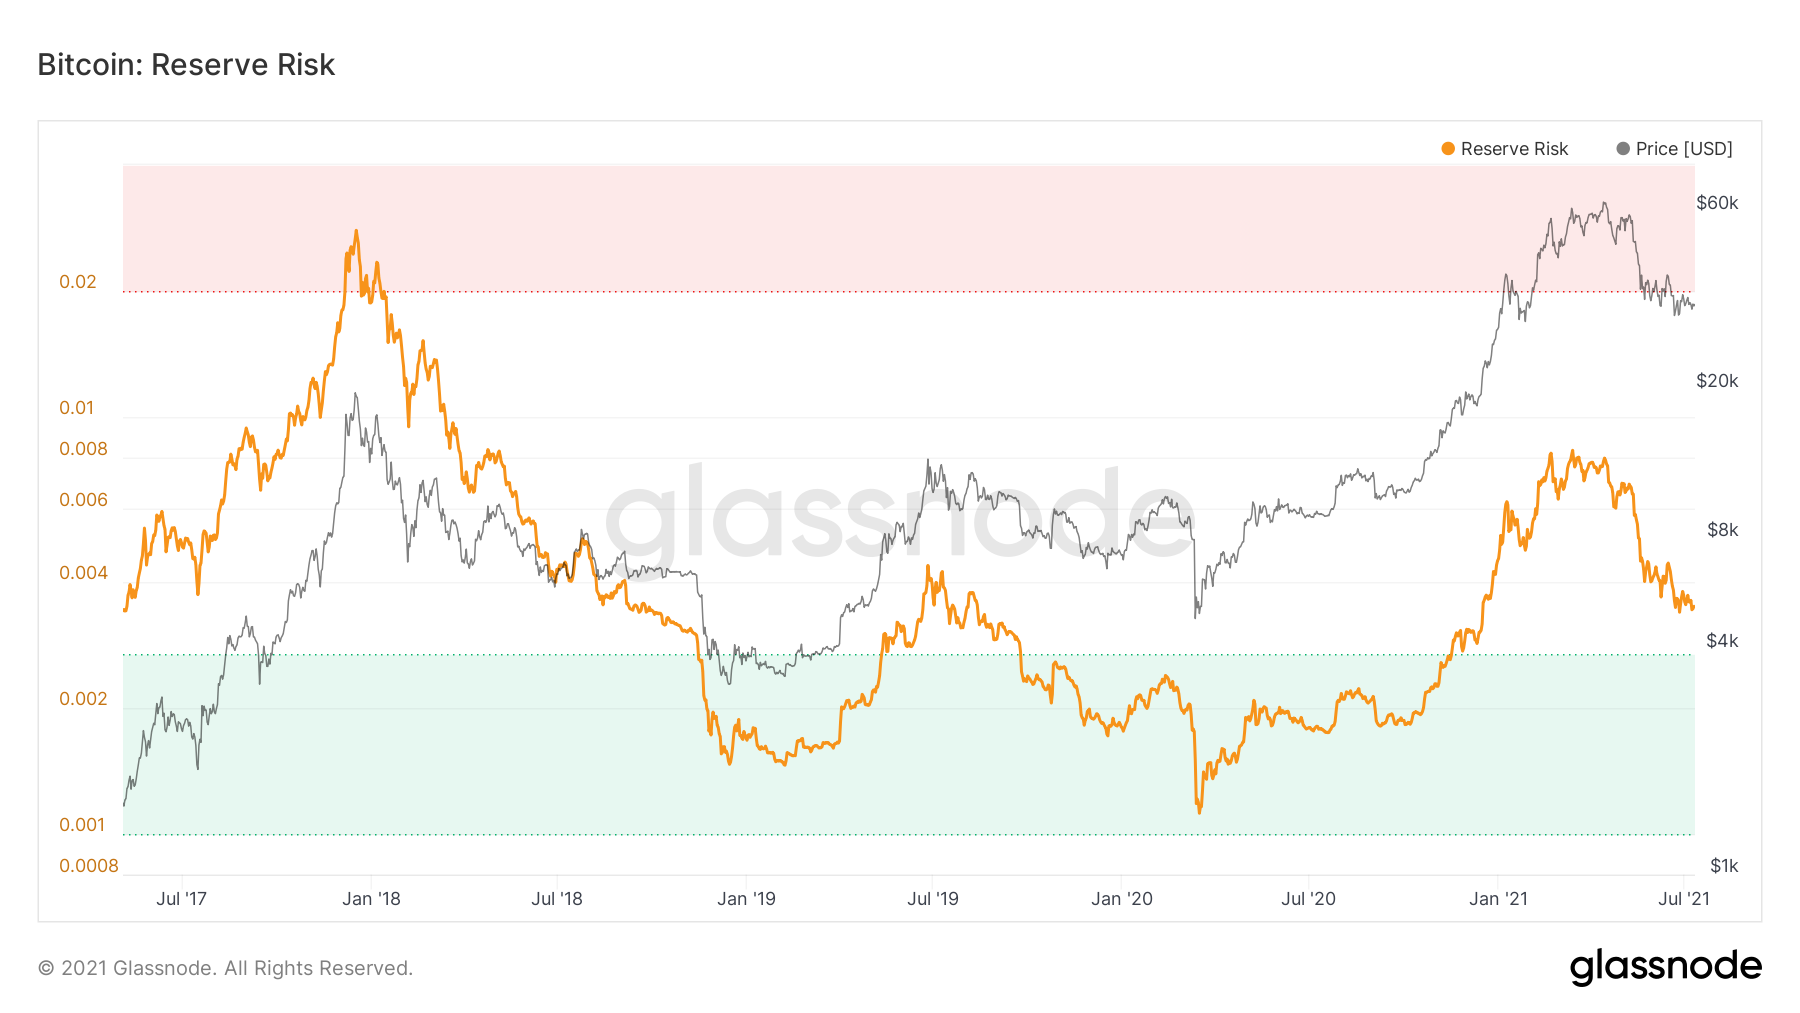
At the time of writing, Reserve Risk indicator which tracks risk-reward balance with respect to the confidence and conviction of long term HODLers, stood at 0.003. It should be noted, a lower reserve risk implies high HODLer confidence. Arguably, at this stage, the risk/reward to invest remains pretty attractive.
In mid-April when the coin hit its ATH, the reserve risk stood at 0.007. In that perspective, the present 0.003 signals a relative undervaluation of Bitcoin. The RR index had peaked during Bitcoin’s rallies in 2013 and 2017, but post that, the coin underwent a strong bearish phase and the RR parallelly shrunk too. The aforementioned comparison suggested that BTC’s price movement has followed the same direction as the RR index.
The fact that this metric is on the fall and hasn’t bottomed out goes on to suggest that the bear run hasn’t concluded and despite the slight respite, a further downtrend can be expected in the coming days.
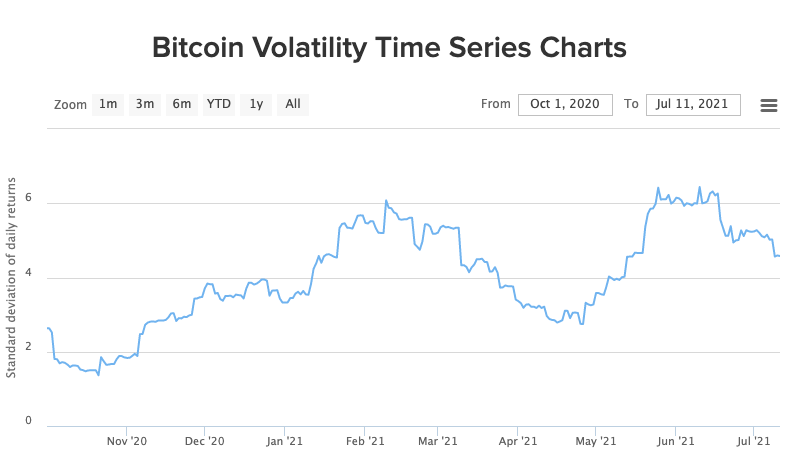
Another key metric worth considering at this point is Bitcoin’s volatility. At the time of writing, the metric was continuing to drop. In fact, according to BitPremier’s chart, the 30-day BTC/USD volatility stood at 4.58% – a level that was previously witnessed in March, days before the coin went on to hit its ATH.
If parallels had to be drawn, keeping other factors aside, the coin should likely be able to repeat its April ATH streak in the coming few days. Well, that’s not how the BTC market usually works, right?
Diminishing volatility usually shuts the door for any dramatic price action, and keeping in mind the current sluggishness, the odds of Bitcoin oscillating in its current $30k-$40k rangebound region for the next few days remains slightly higher than a complete change in trend.

Source: Santiment
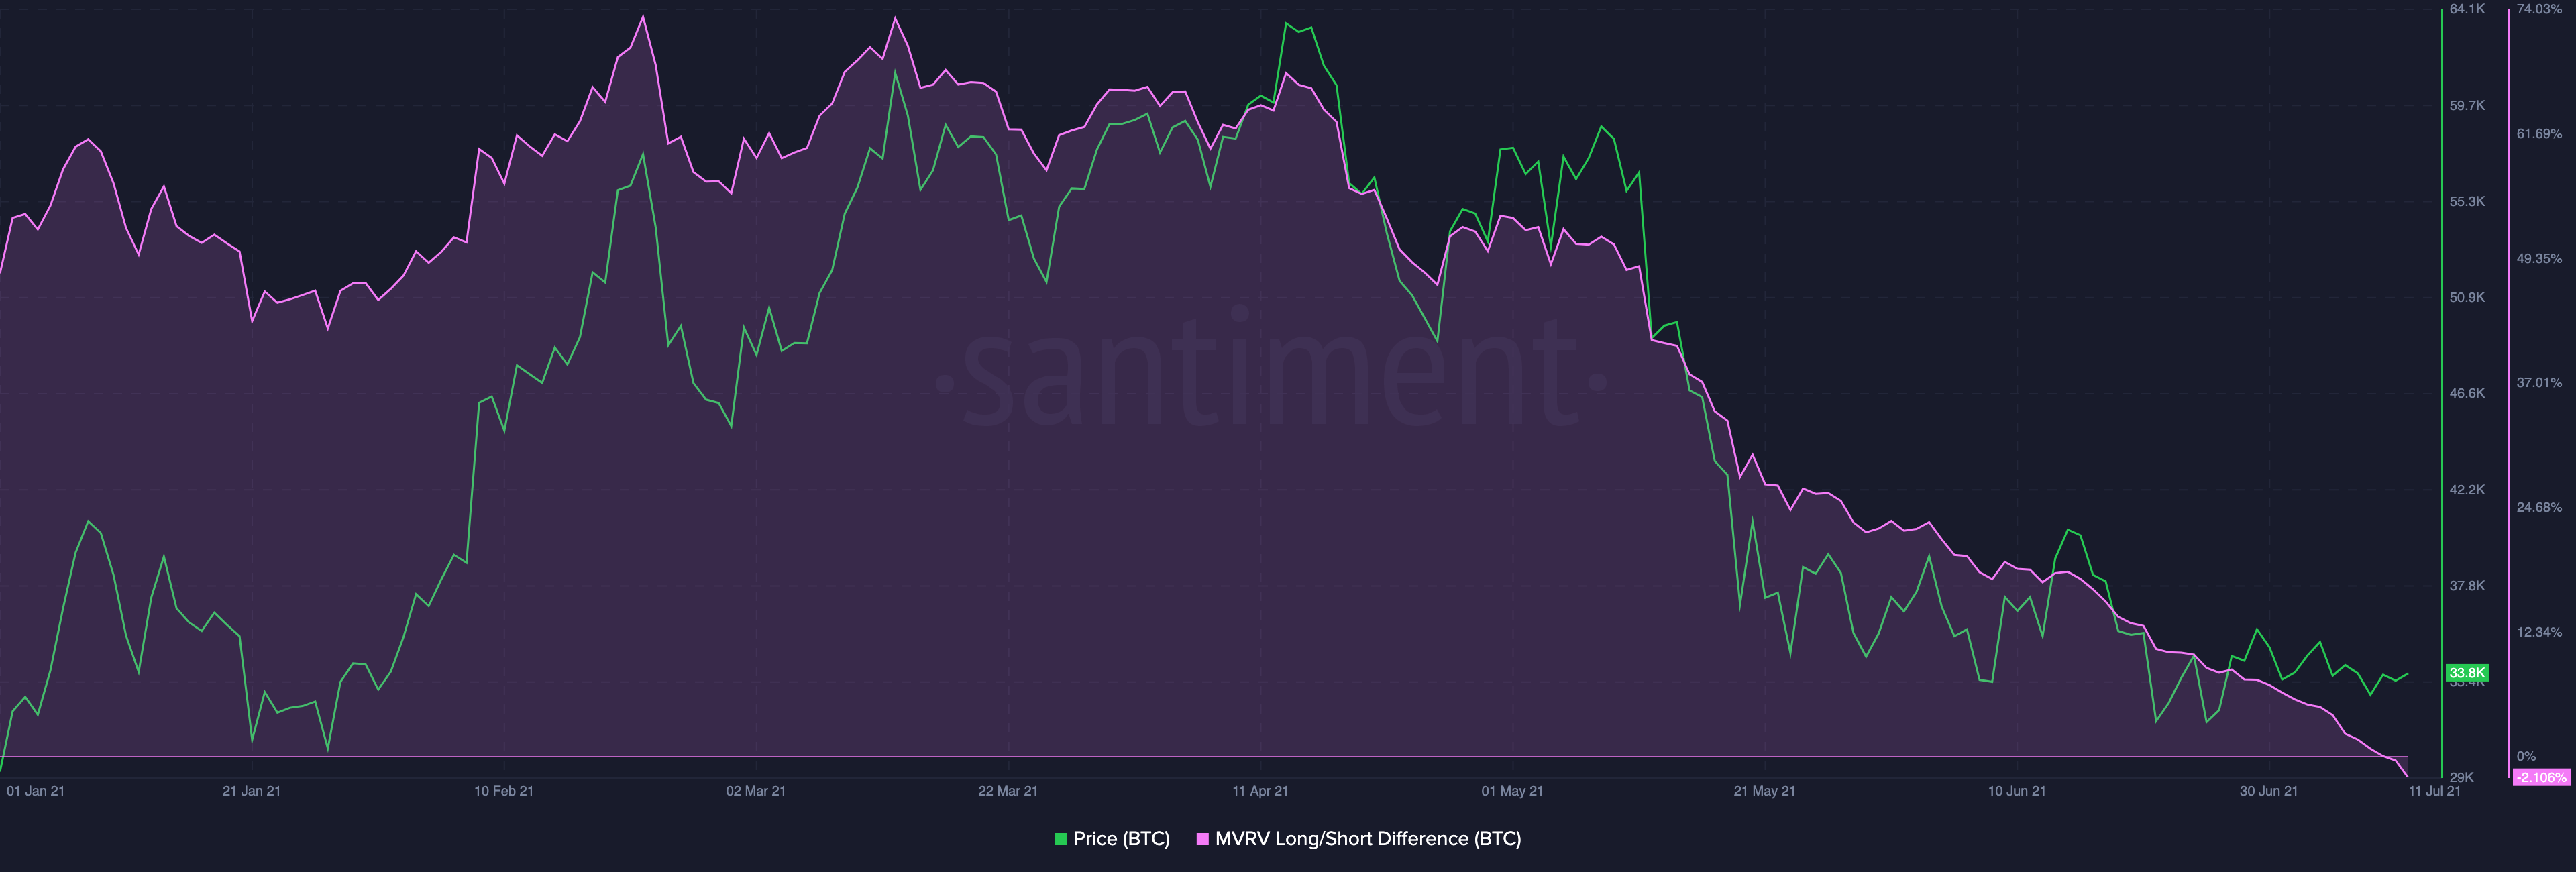
Additionally, Bitcoin’s MVRV Long/Short difference indicated a key emerging trend. This indicator just dipped below 0% for the first time in 14 months on 10 July. Whenever this long-term indicator veers negative, it implies that a combination of short-term and long-term traders are under water on their investments.
Thus, this dip postulates that BTC is in the buy zone. On-chain data aggregator platform, Santiment, in one of its latest tweets highlighted,
“When this occurs, crypto’s #1 asset [Bitcoin] is likely to see an increase in market price.”
Given the state of the market and other metrics, an immediate up rally, at the moment, seems to be out of the equation. However, if Bitcoin is able to gain substantial buyer momentum in the coming days, likeliness of a trend reversal would escalate.


