Ethereum, Shiba Inu, MATIC Price Analysis: 28 November

While the market continues its dynamic trajectory, top altcoins like Ethereum and Shiba Inu touch their one-month low on 26 November.
Near-term technical indicators for the above cryptos and MATIC reaffirm a bearish bias that correlates with the overall market inclination.
Ethereum (ETH)
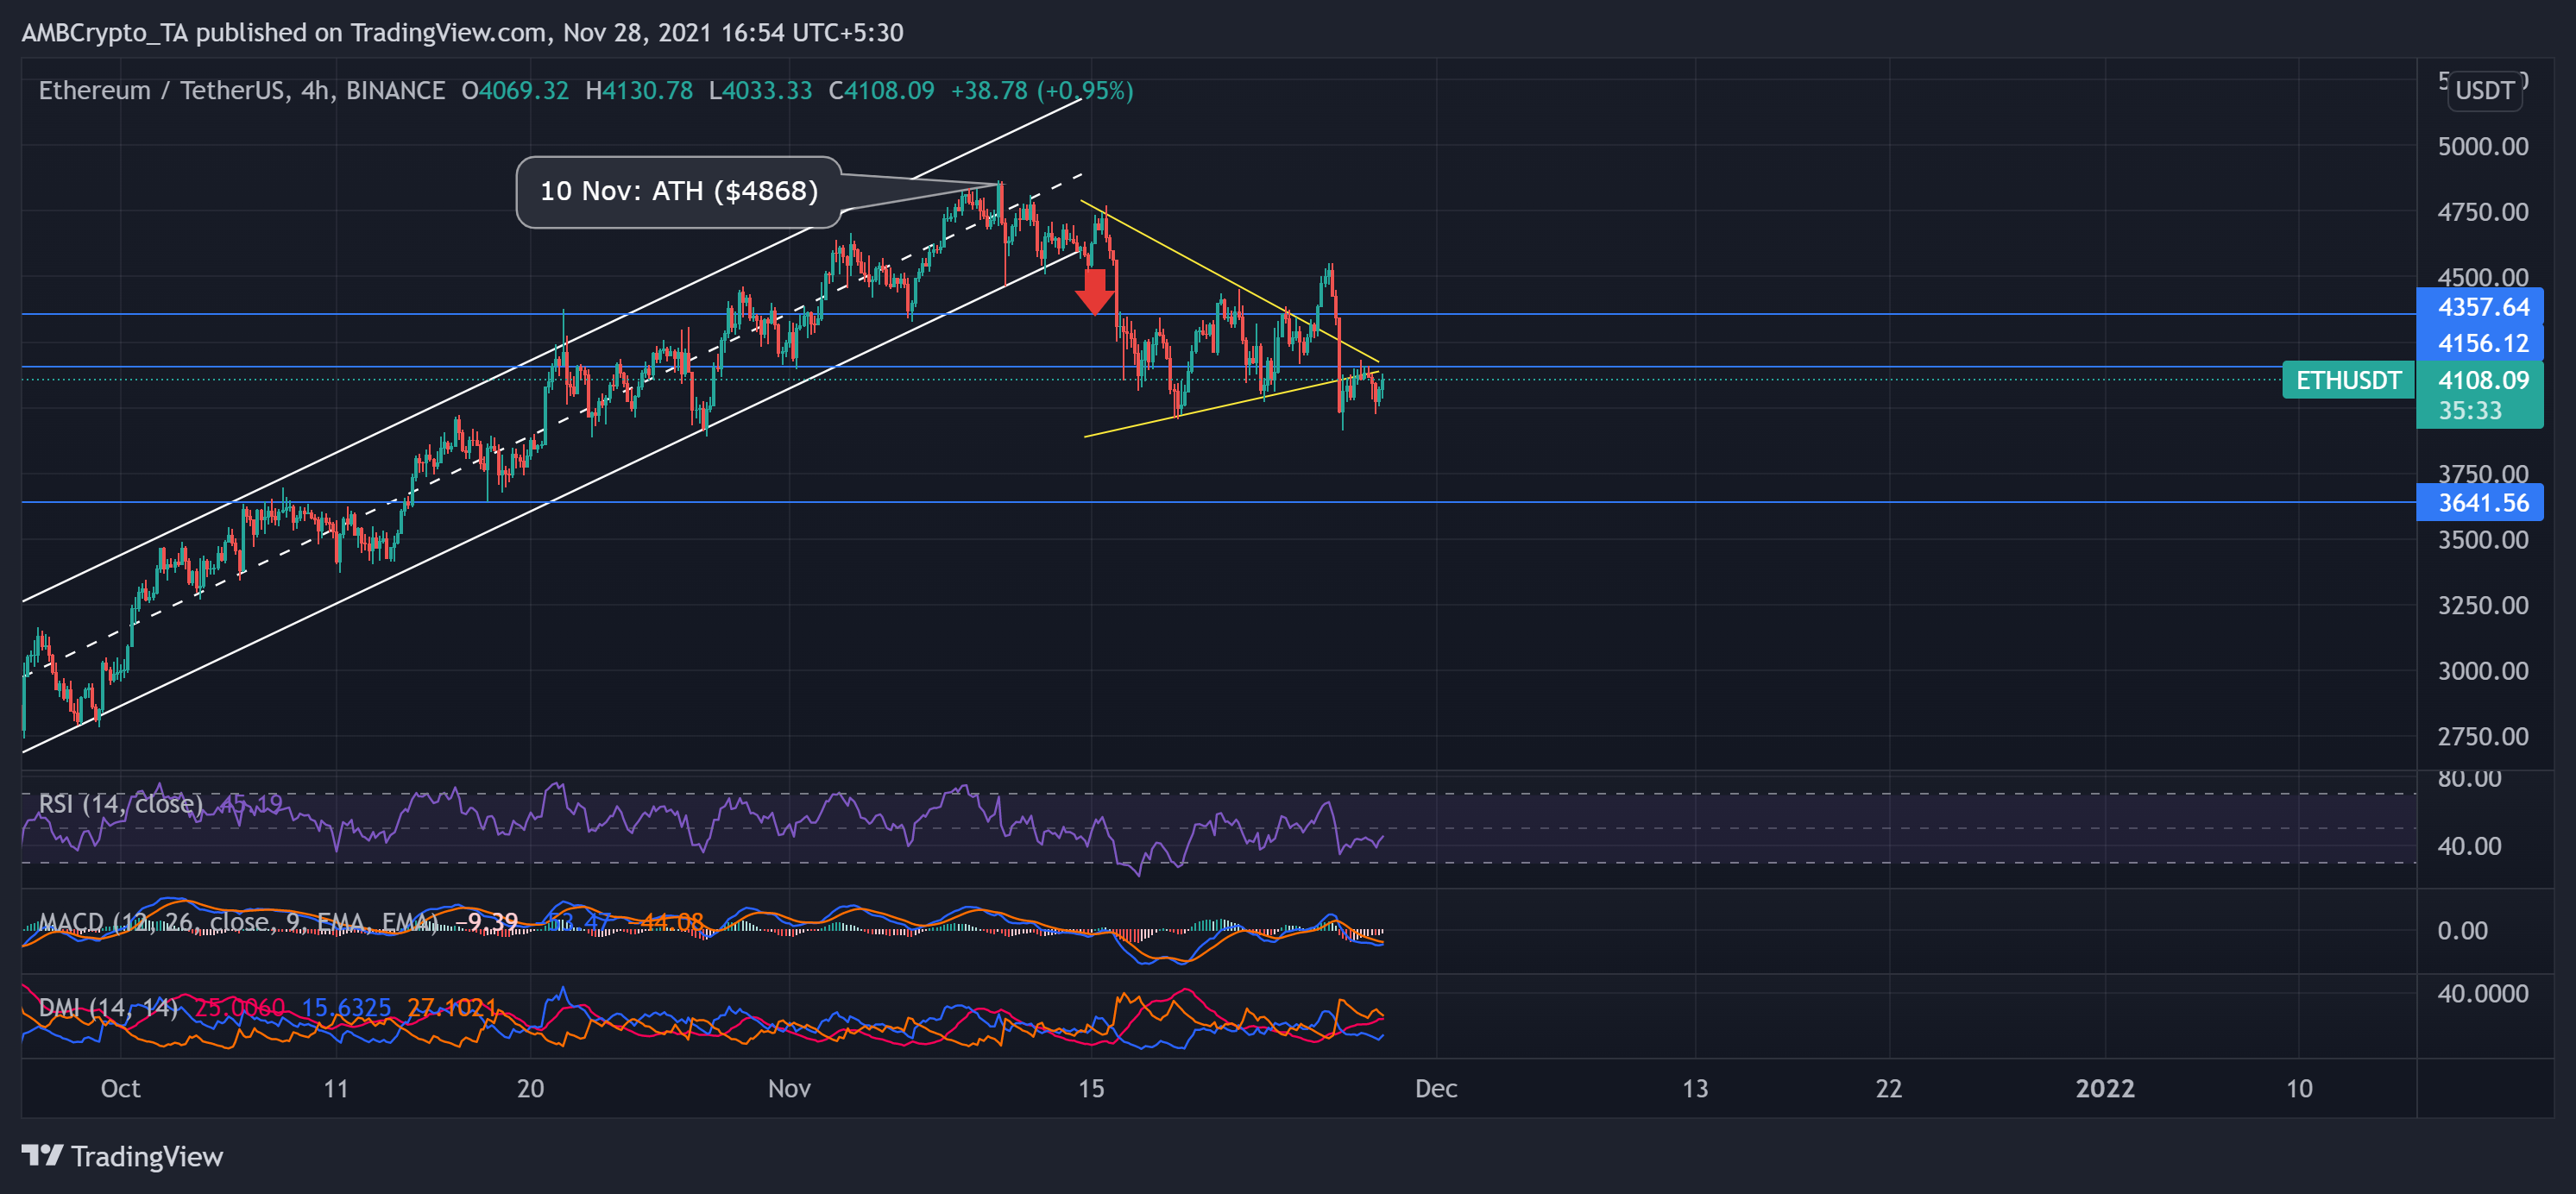
Correlating with Bitcoin’s retracement, ETH ceased its upswing rally after striking its ATH on 10 November. The largest altcoin registered over 61% ROI (from 22 September) to touch its ATH at $4,868.
Then, as the bulls failed to counter the selling pressure, bears triggered an over 19% decline (from 10 November) to touch its one-month low on 26 November.
As a result, the price action withdrew by marking a symmetrical triangle (yellow) after breaching the up-channel. Although bulls provoked a breakout, they were unable to sustain their rally.
At press time, the alt traded at $4,108.09 after a 9.8% 48-hour loss. The RSI was at the 45-mark and showed some revival signs. While DMI visibly showed a bearish preference, MACD hinted at decreasing bearish power in the near term.
Shiba Inu (SHIB)
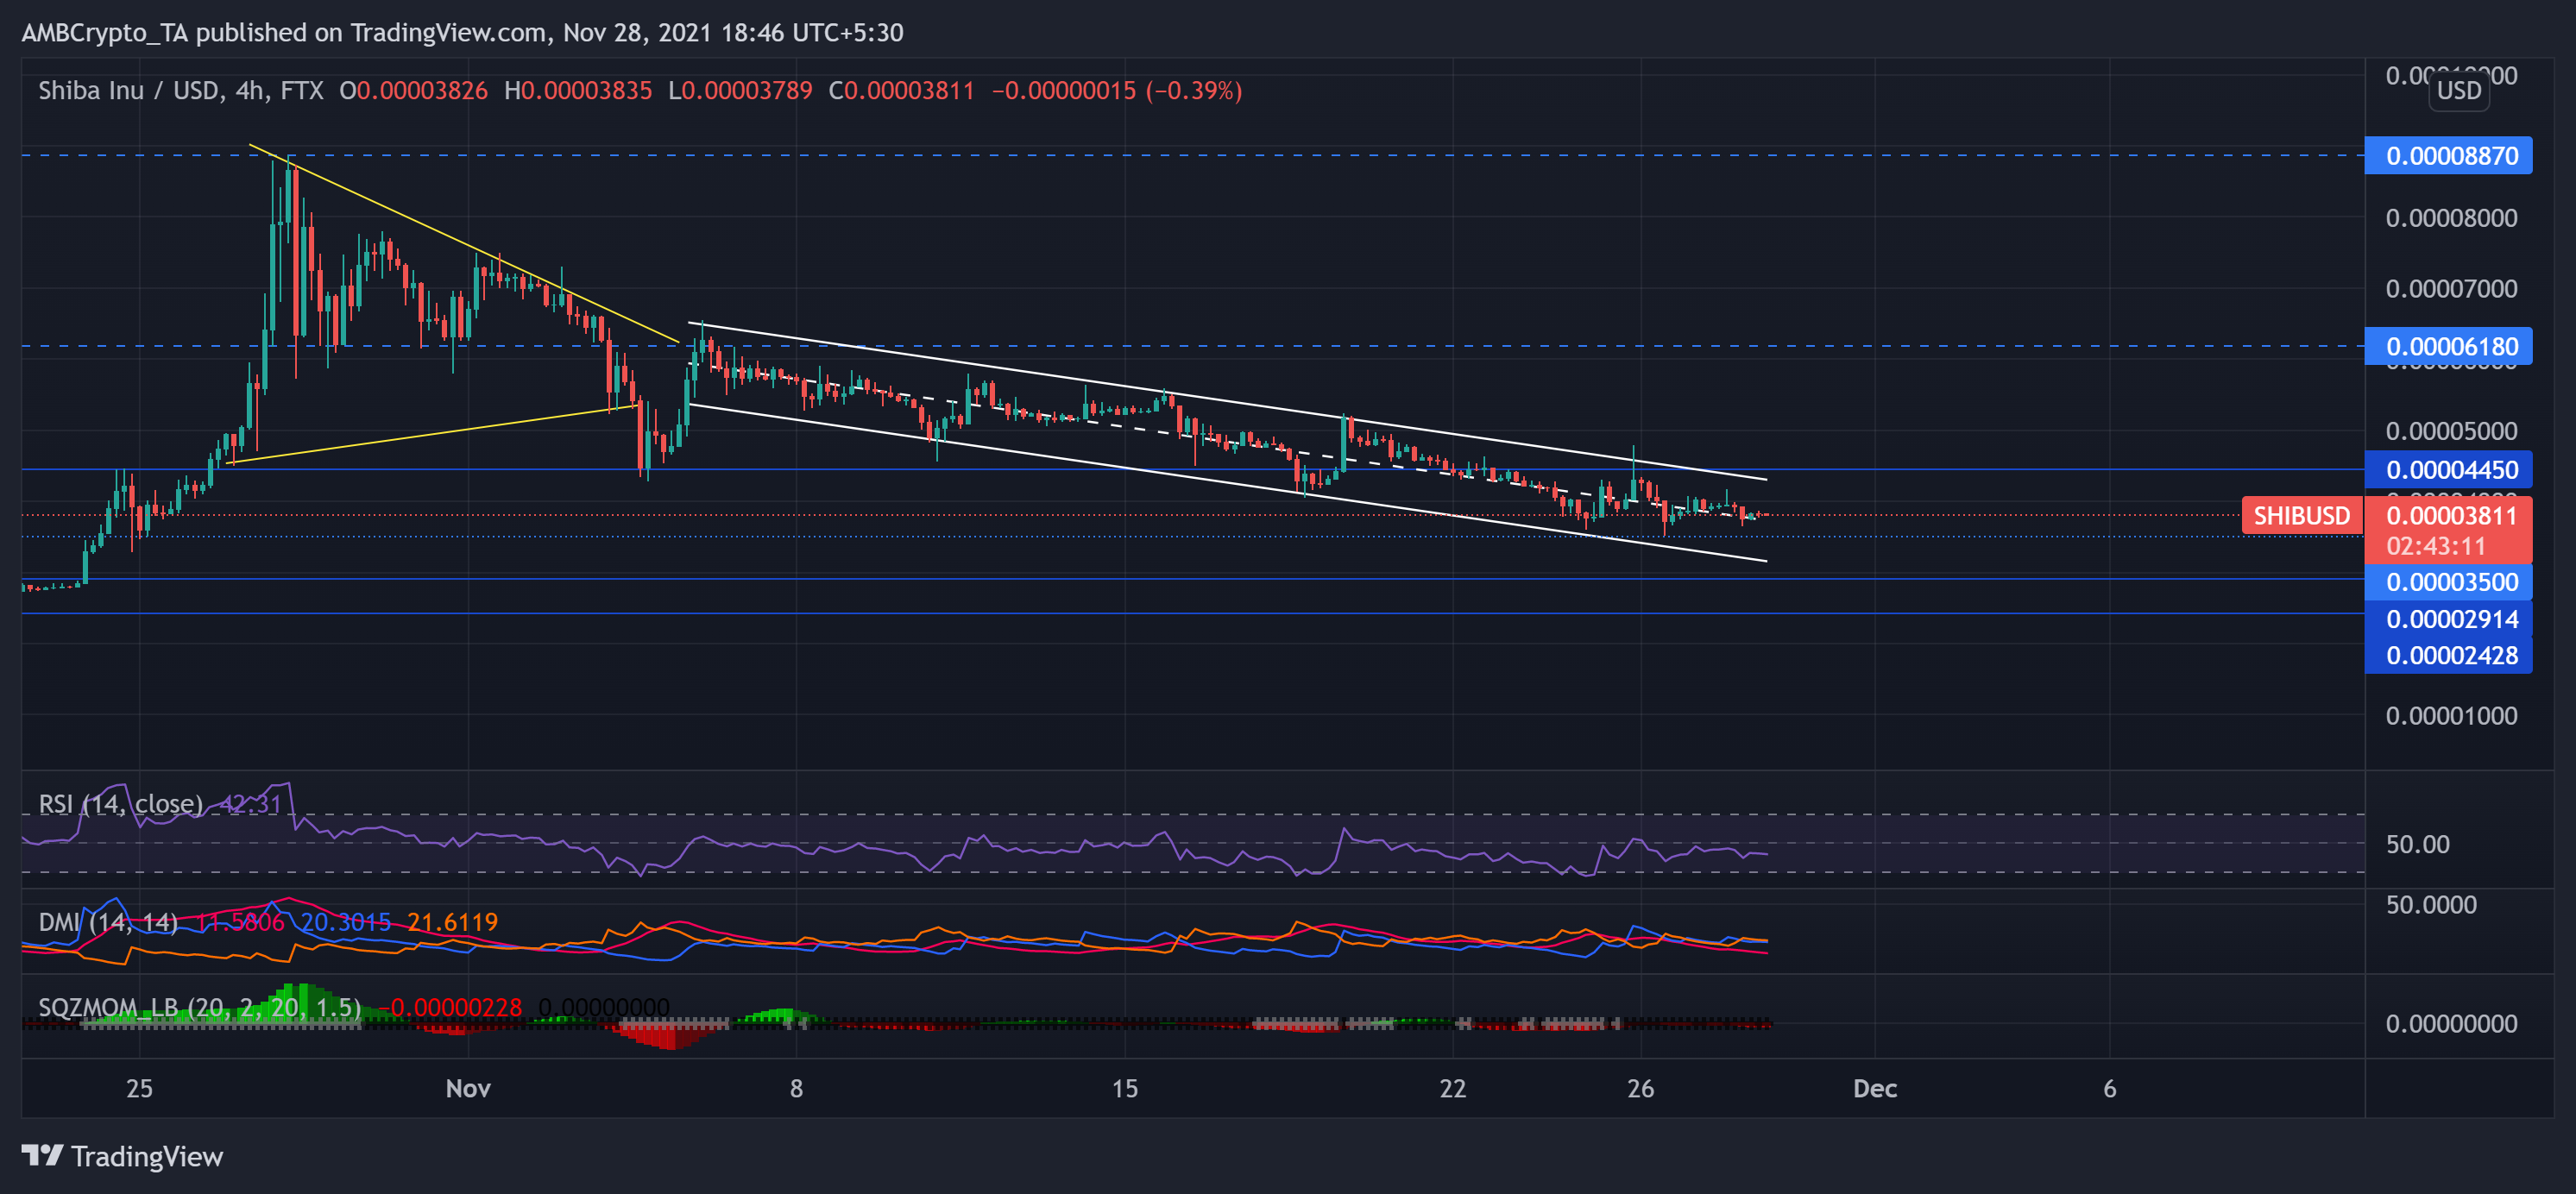
After a symmetrical triangle (yellow) breakdown, SHIB steadily declined between the down channel (white) from 5 November.
The meme coin has lost over half of its value since it struck its ATH on 28 October. With profit-taking in full swing, bulls failed to hold their ground as the coin saw a 43.4% and 19.4% monthly and weekly decline, respectively. Consequently, SHIB touched its one-month low on 26 November.
Now, $0.000035 becomes a crucial mark for the bulls to uphold to prevent a further breakdown.
At press time, SHIB traded at $0.00003811. The near-term technical indicators flashed mixed signs. The RSI moved sideways after preferring the bears. Further, the DMI chose the bears, but the ADX displayed a weak directional trend. Nevertheless, the Squeeze Momentum indicator flashed black dots, indicating a squeeze phase with low volatility.
MATIC

The digital token saw a soaring October until the price poked its 5-month high on 29 October. However, the bears have shown resistance at the $2-mark for the past six months and continued to sustain that level. Thus, the price action withdrew in a down channel since then.
Over the next month, the token lost over one-third of its value as the price touched its one-month low on 18 November. Over the past ten days, post a bullish breakout from the down-channel, the price ascended. But the bears were quick to trigger a breakdown from the up-channel (yellow) before the bulls could continue their trend.
At press time, MATIC traded at $1.567 after noting a 7% loss in 24 hours. Bulls will need to ensure support at the $1.561-mark to prevent a further breakdown. Furthermore, The RSI was southbound and showed no revival signs.