Dogecoin, Solana, Tron Price Analysis: 17 December

Despite a bullish recovery window, Dogecoin noted a substantial pullback after forming a descending triangle while Solana was down by 3.43% in the past 24 hours.
The near-term technicals for these cryptos visibly hinted at decreasing buying pressure. Tron, however, continued its month-long bearish drift.
Dogecoin (DOGE)
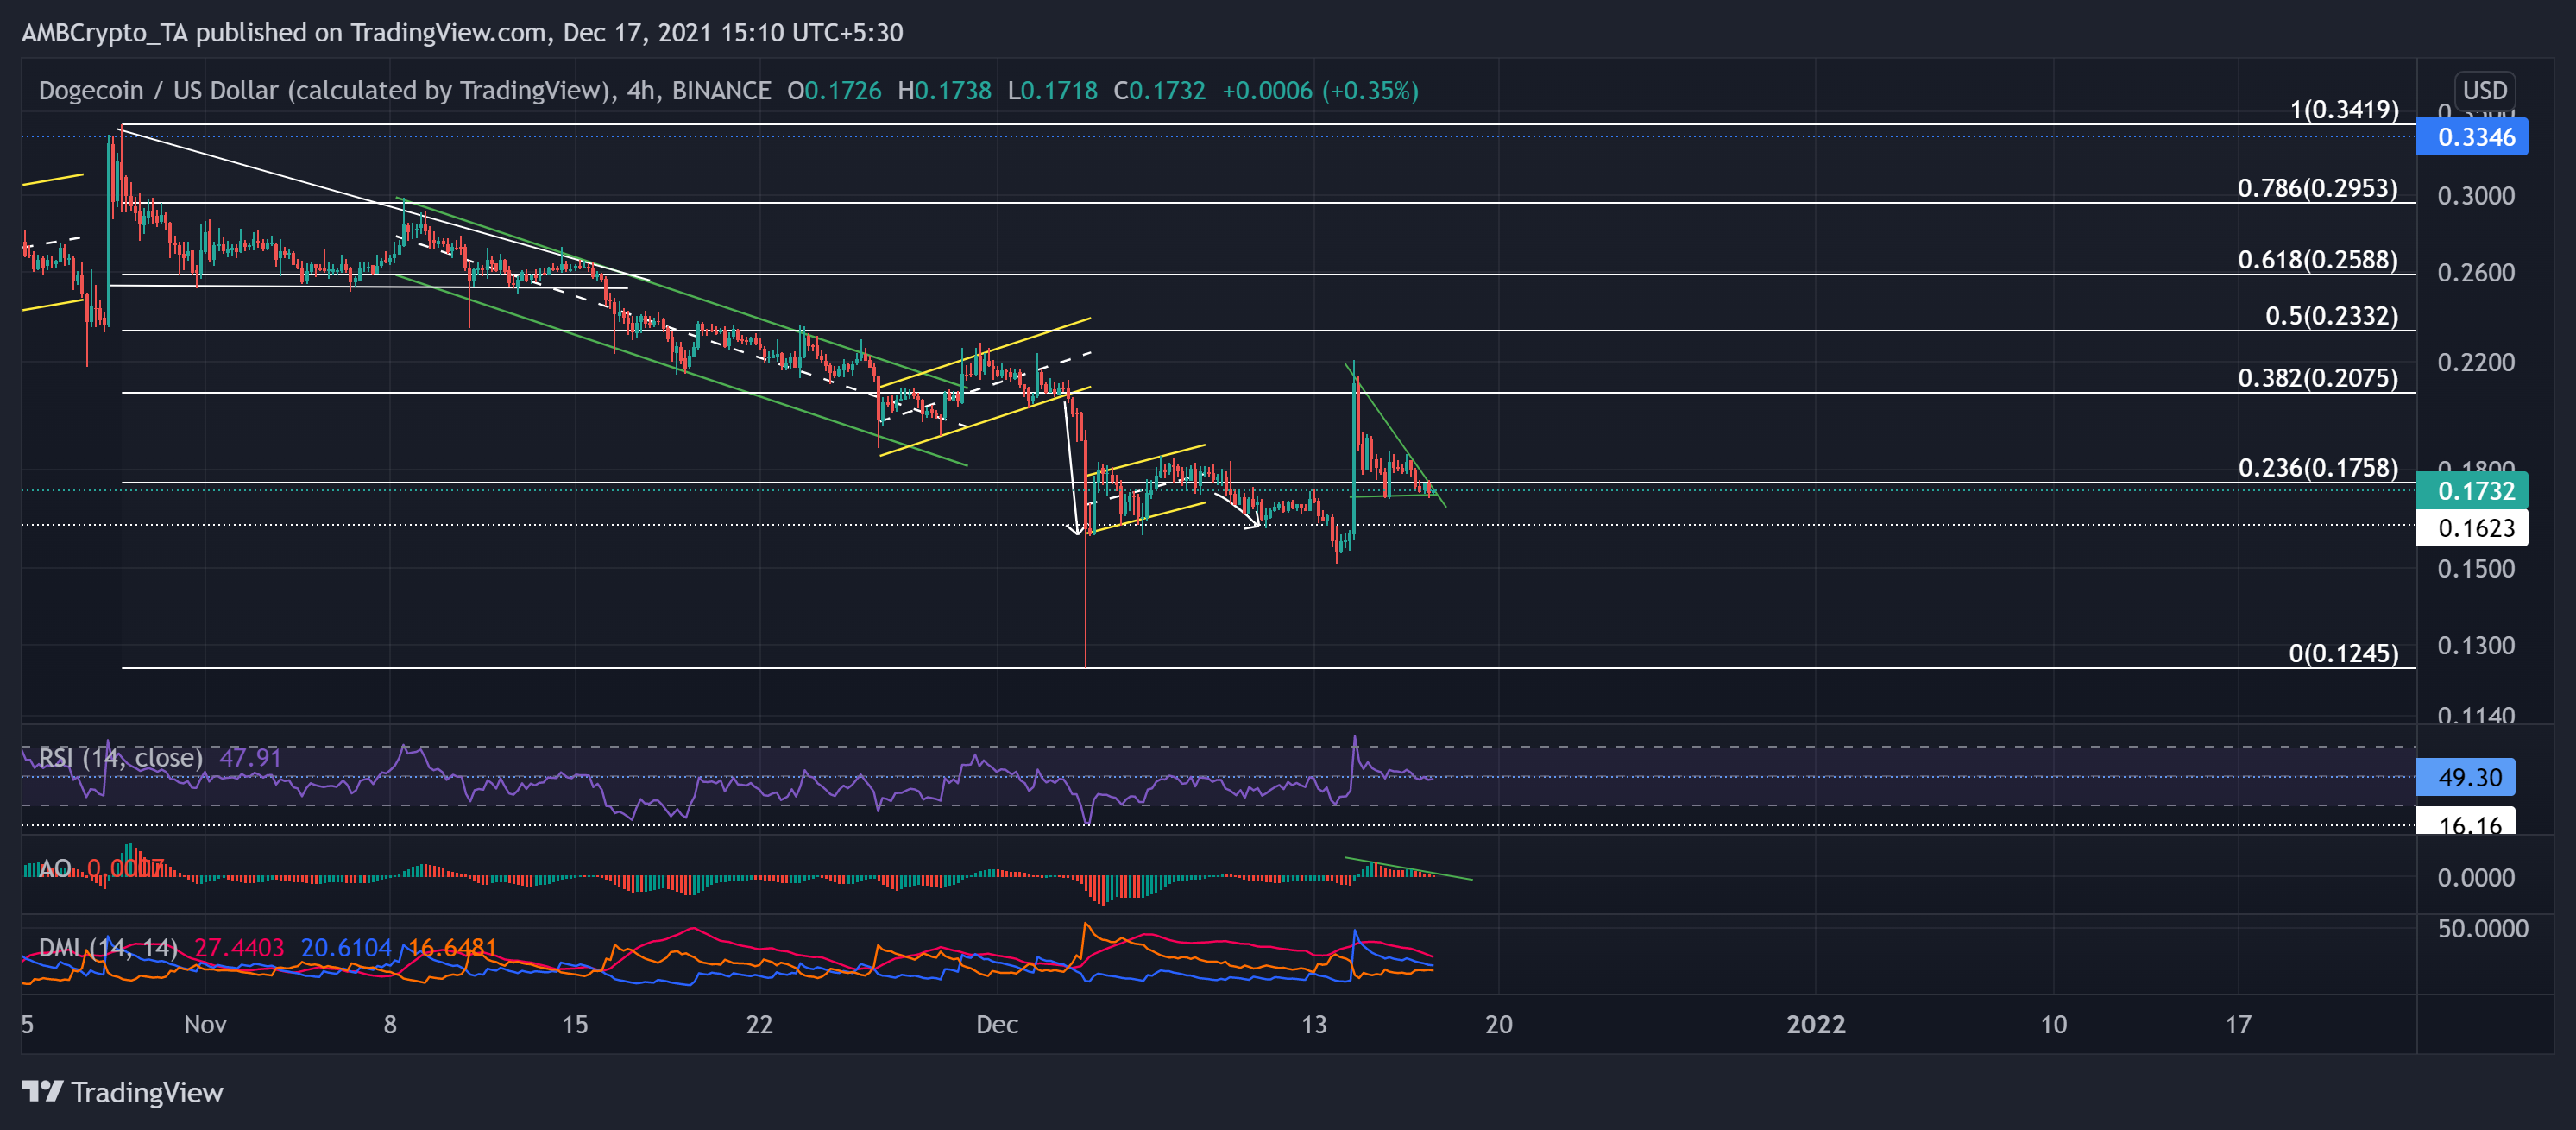
DOGE bears quickly reversed the 14 December jump as the meme coin reignited its bearish tendencies. After the Elon Musk claim, the alt skyrocketed to $0.2205 but saw a strong pullback from the 38.2% Fibonacci level. Thus, it noted a 22.14% decline over the past three days.
DOGE marked lower highs while maintaining the $0.17 support, exhibiting a bearish tilt (descending triangle, green). Any further breakdowns would find an immediate support level to test at the $0.162-mark.
At press time, DOGE traded at $0.1732, 76.4% below its ATH. The RSI dipped below the 49-mark, depicting a selling bias. Also, the Awesome Oscillator (AO) formed bearish twin peaks, reaffirming the previous analysis. Although the DMI displayed a marginal bullish bias, it was not enough to alter the broader trend.
Solana (SOL)
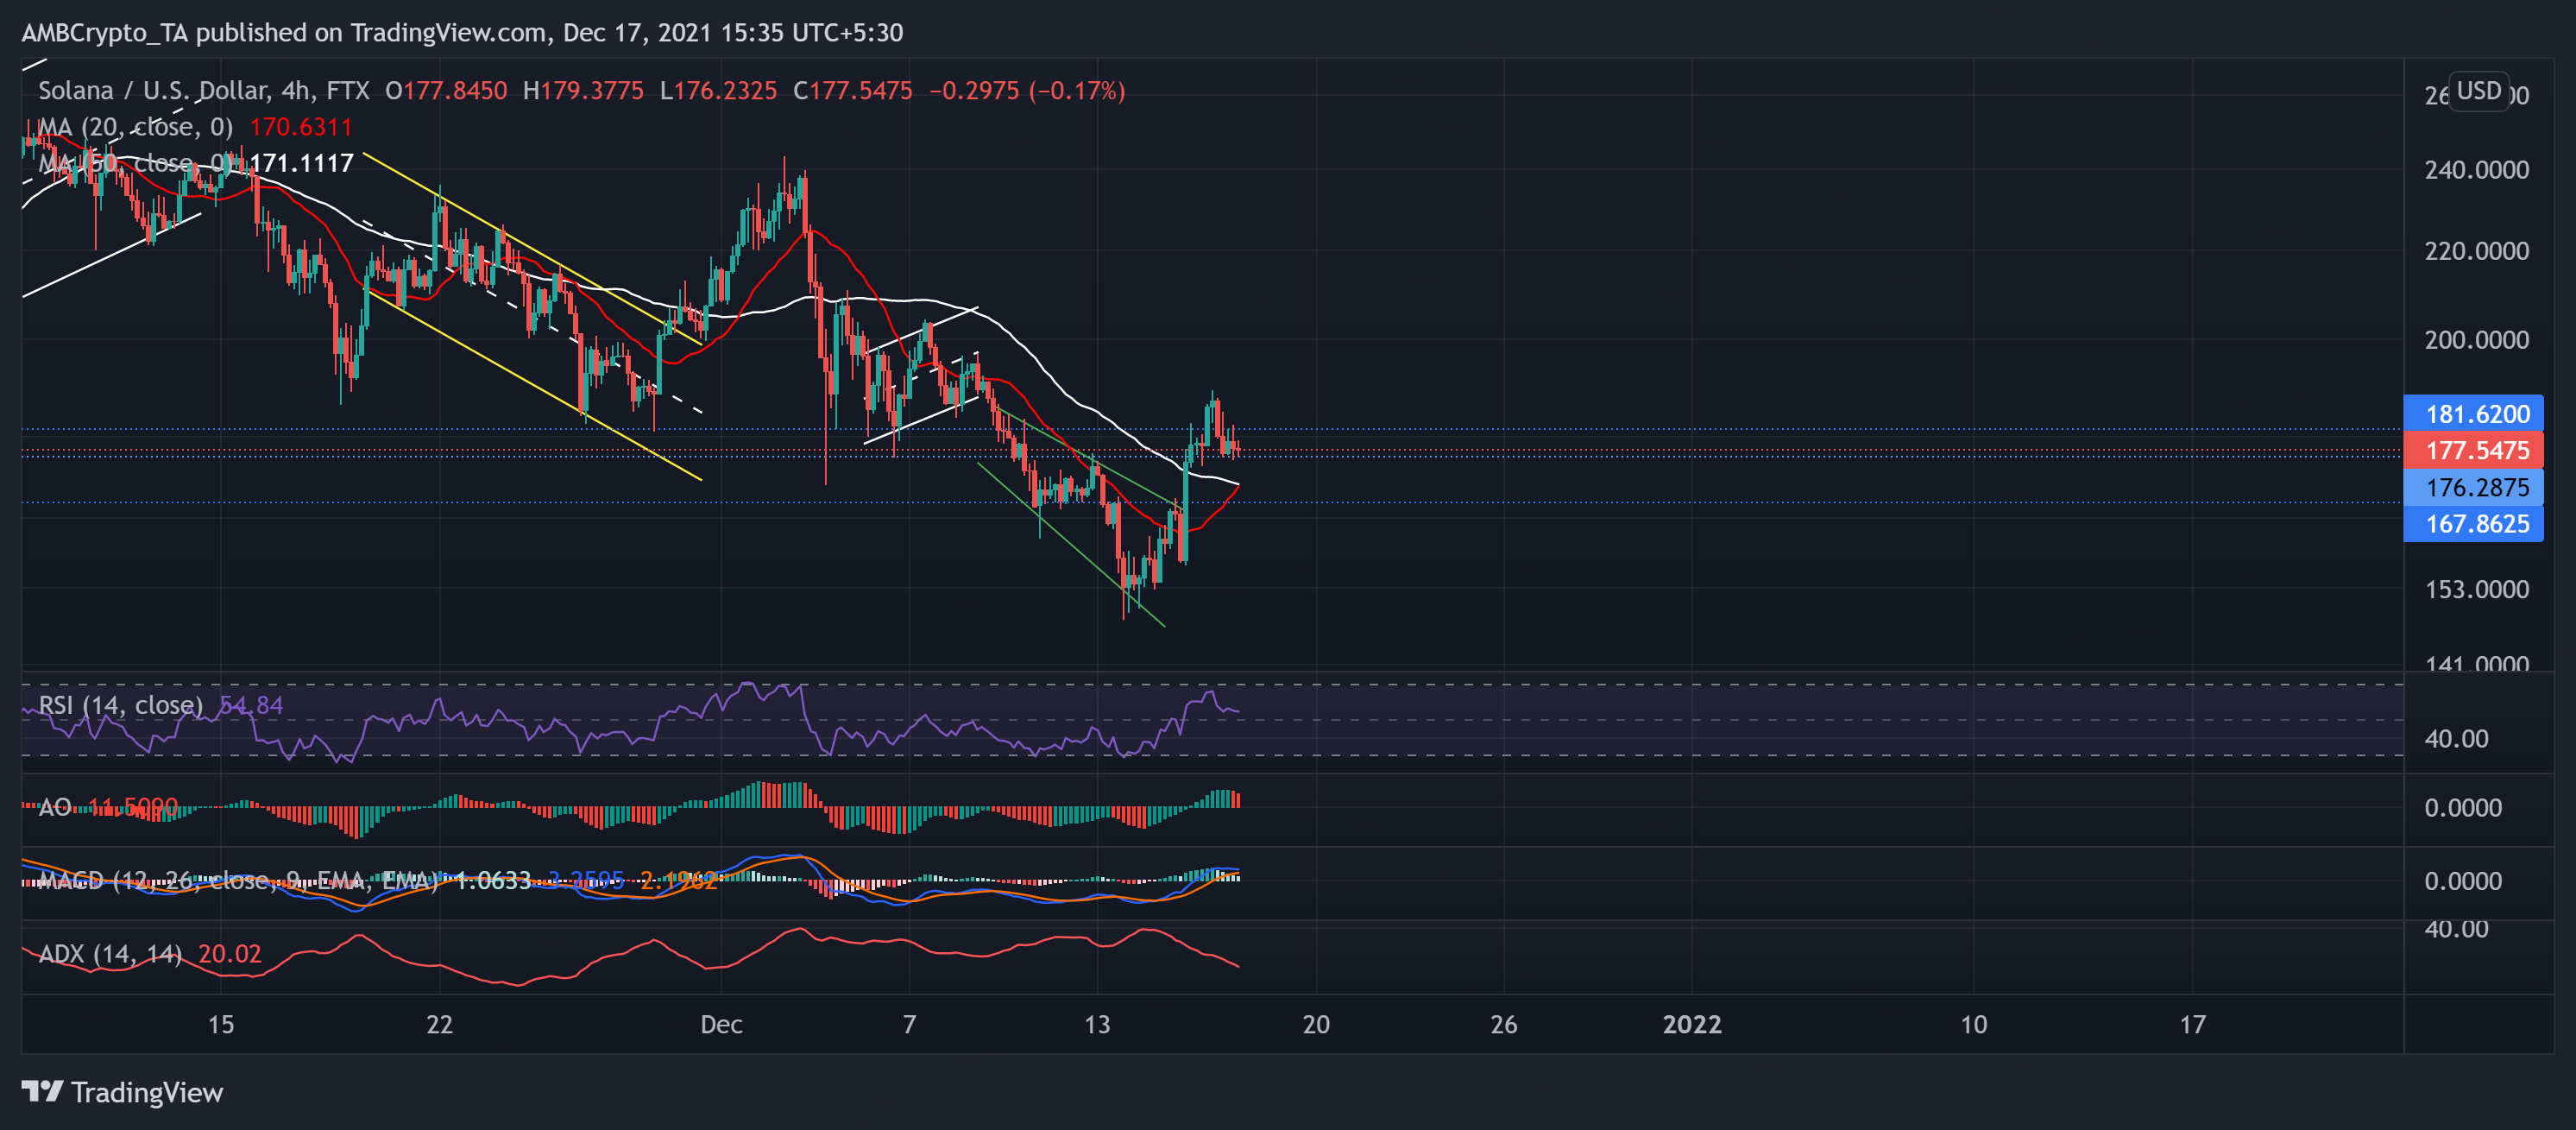
Over the past few days, the altcoin saw an 18% breakout from the descending broadening wedge after an up-channel (white) breakdown. The bulls quickly snapped the immediate $181 resistance and now found nearest support at the $176-mark.
SOL steadily declined over the last month after touching its lifetime milestone on 6 November. The alt dived to poke its eight-week low on 13 December.
At press time, SOL traded at $177.5475, 31.4% below its ATH. However, considering the recent bull move, it moved above the 20-50 SMA. The RSI saw a 10 point slippage but swayed above the midline. Further, the AO and MACD hinted at decreasing buying pressure. But the ADX displayed a weak directional trend for SOL.
Tron (TRX)
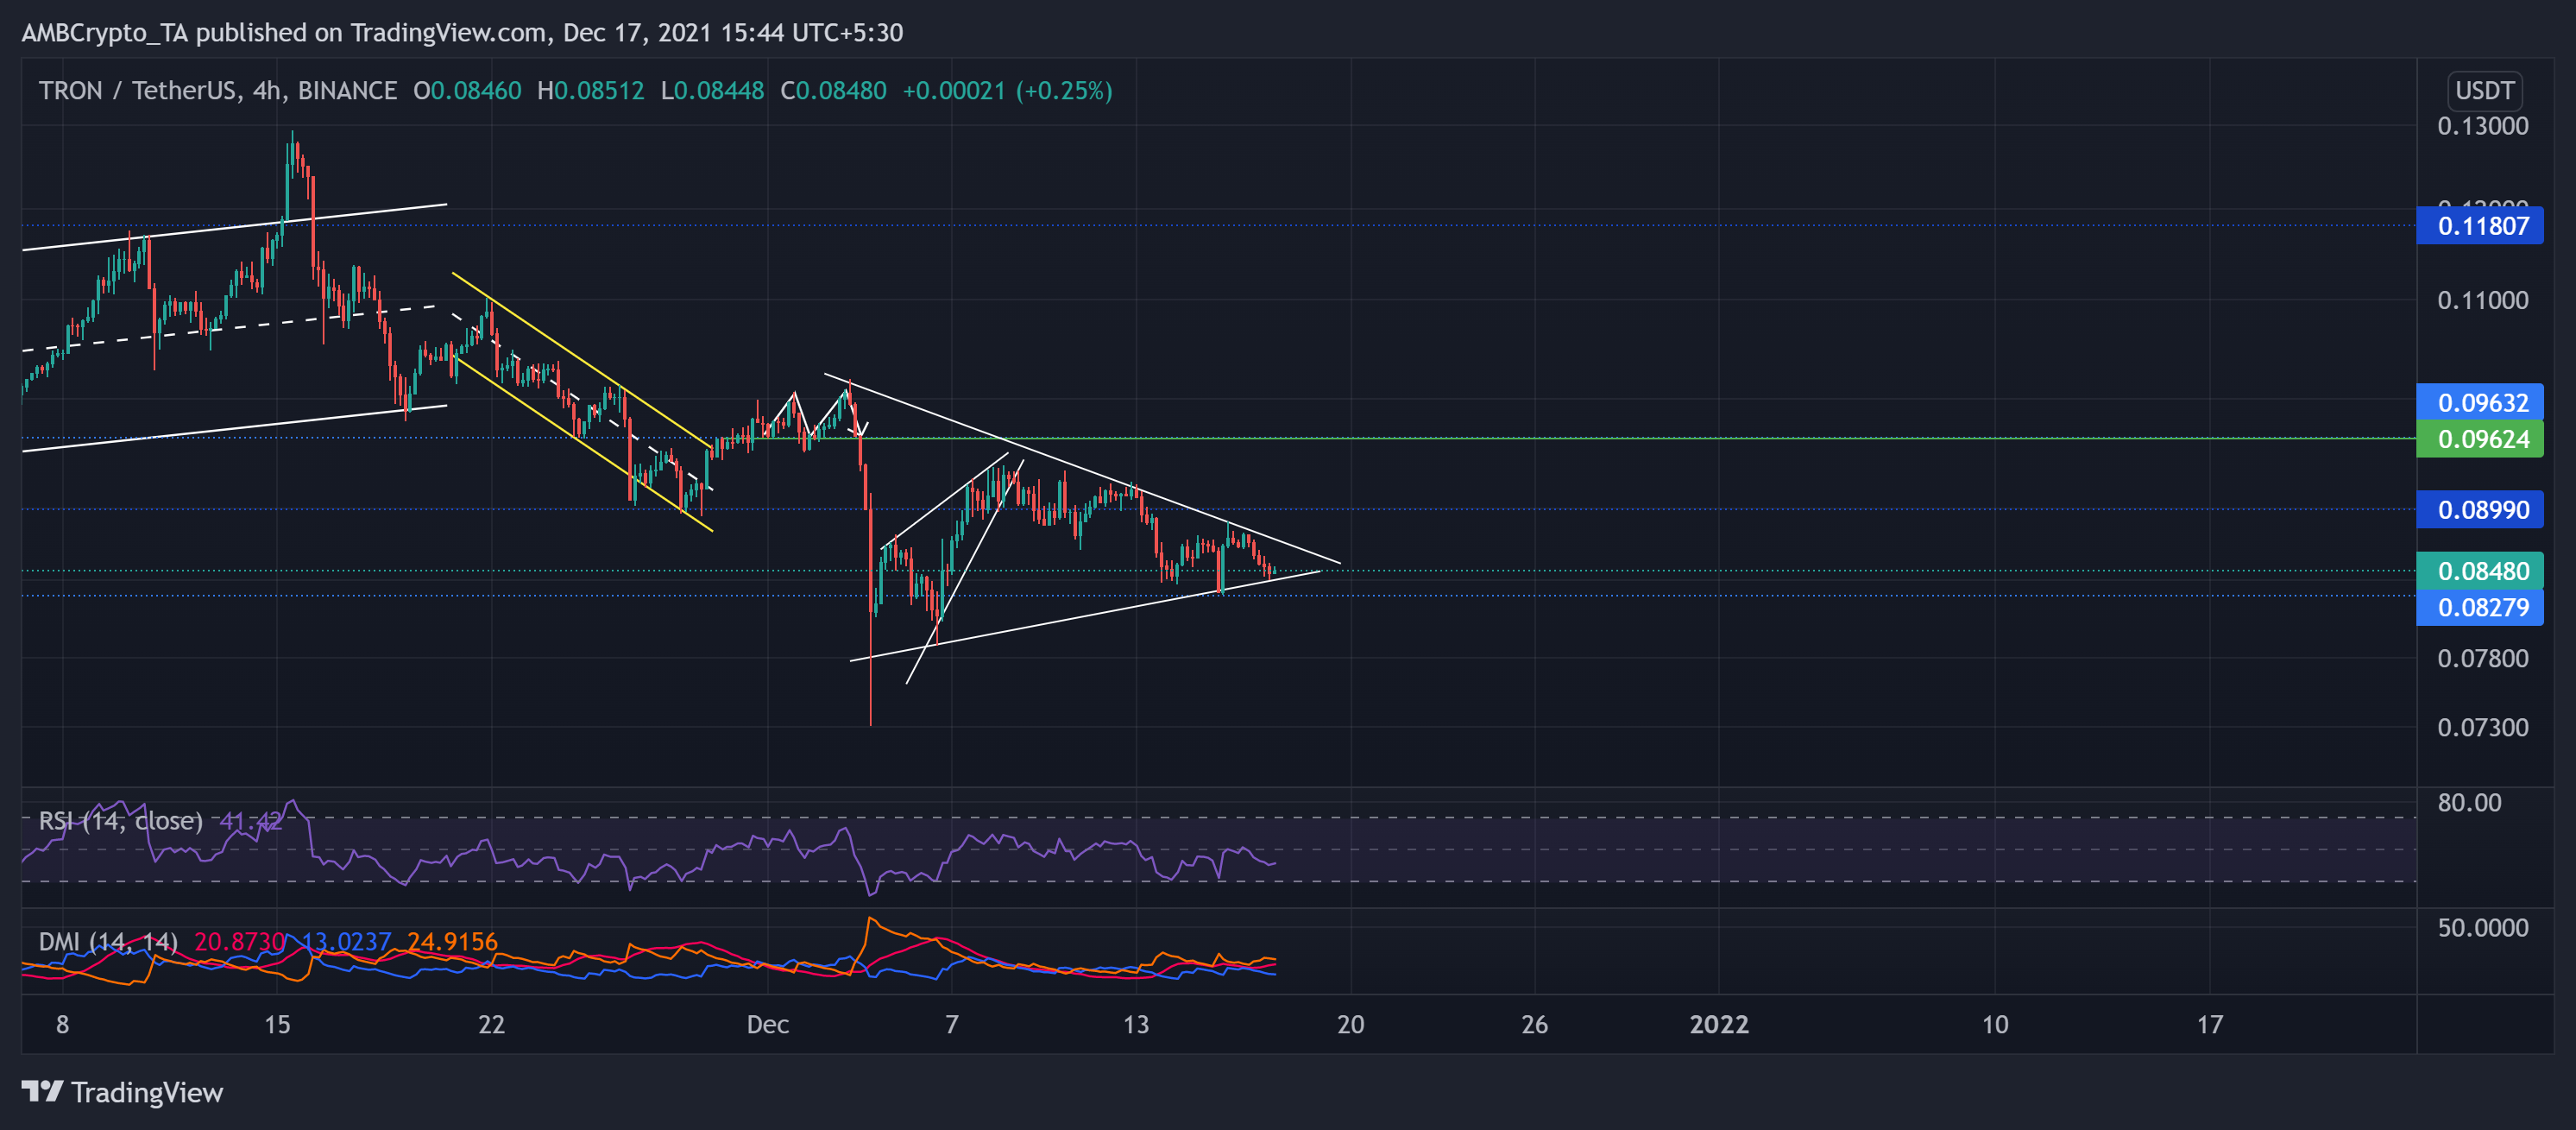
In the past few days, the alt saw a rising wedge breakdown. As the bulls failed to uphold the ten-week resistance at the $0.0899-mark, TRX consolidated between the $0.082 and the aforestated mark. The recent price movements formed a symmetrical triangle on the coin’s 4-hour chart.
TRX price action saw a sharp plunge after poking its six-month high on 15 November. After falling in a descending channel (yellow), the alt further saw a breakdown to touch its 16-week low on 3 December.
At press time, TRX traded at $0.0848 after noting a 3.19% loss on its daily chart. The RSI failed to sustain itself above the midline as it plunged toward the 41-level. Further, the DMI depicted a bearish preference, but the ADX displayed a weak directional trend.