Avalanche, Terra, Chainlink Price Analysis: 16 January

The broader market saw a decent recovery over the past few days. However, the bulls were still not in a position to alter the general perception as the ‘fear’ sentiment only worsened.
After a double-bottom breakout, Avalanche reversed from the $96-zone. While the buyers tried to step in, the ADX displayed a weak directional trend for the alt. Terra and Chainlink slightly skewed in favor of bulls but could not gather impactful volumes.
Avalanche (AVAX)
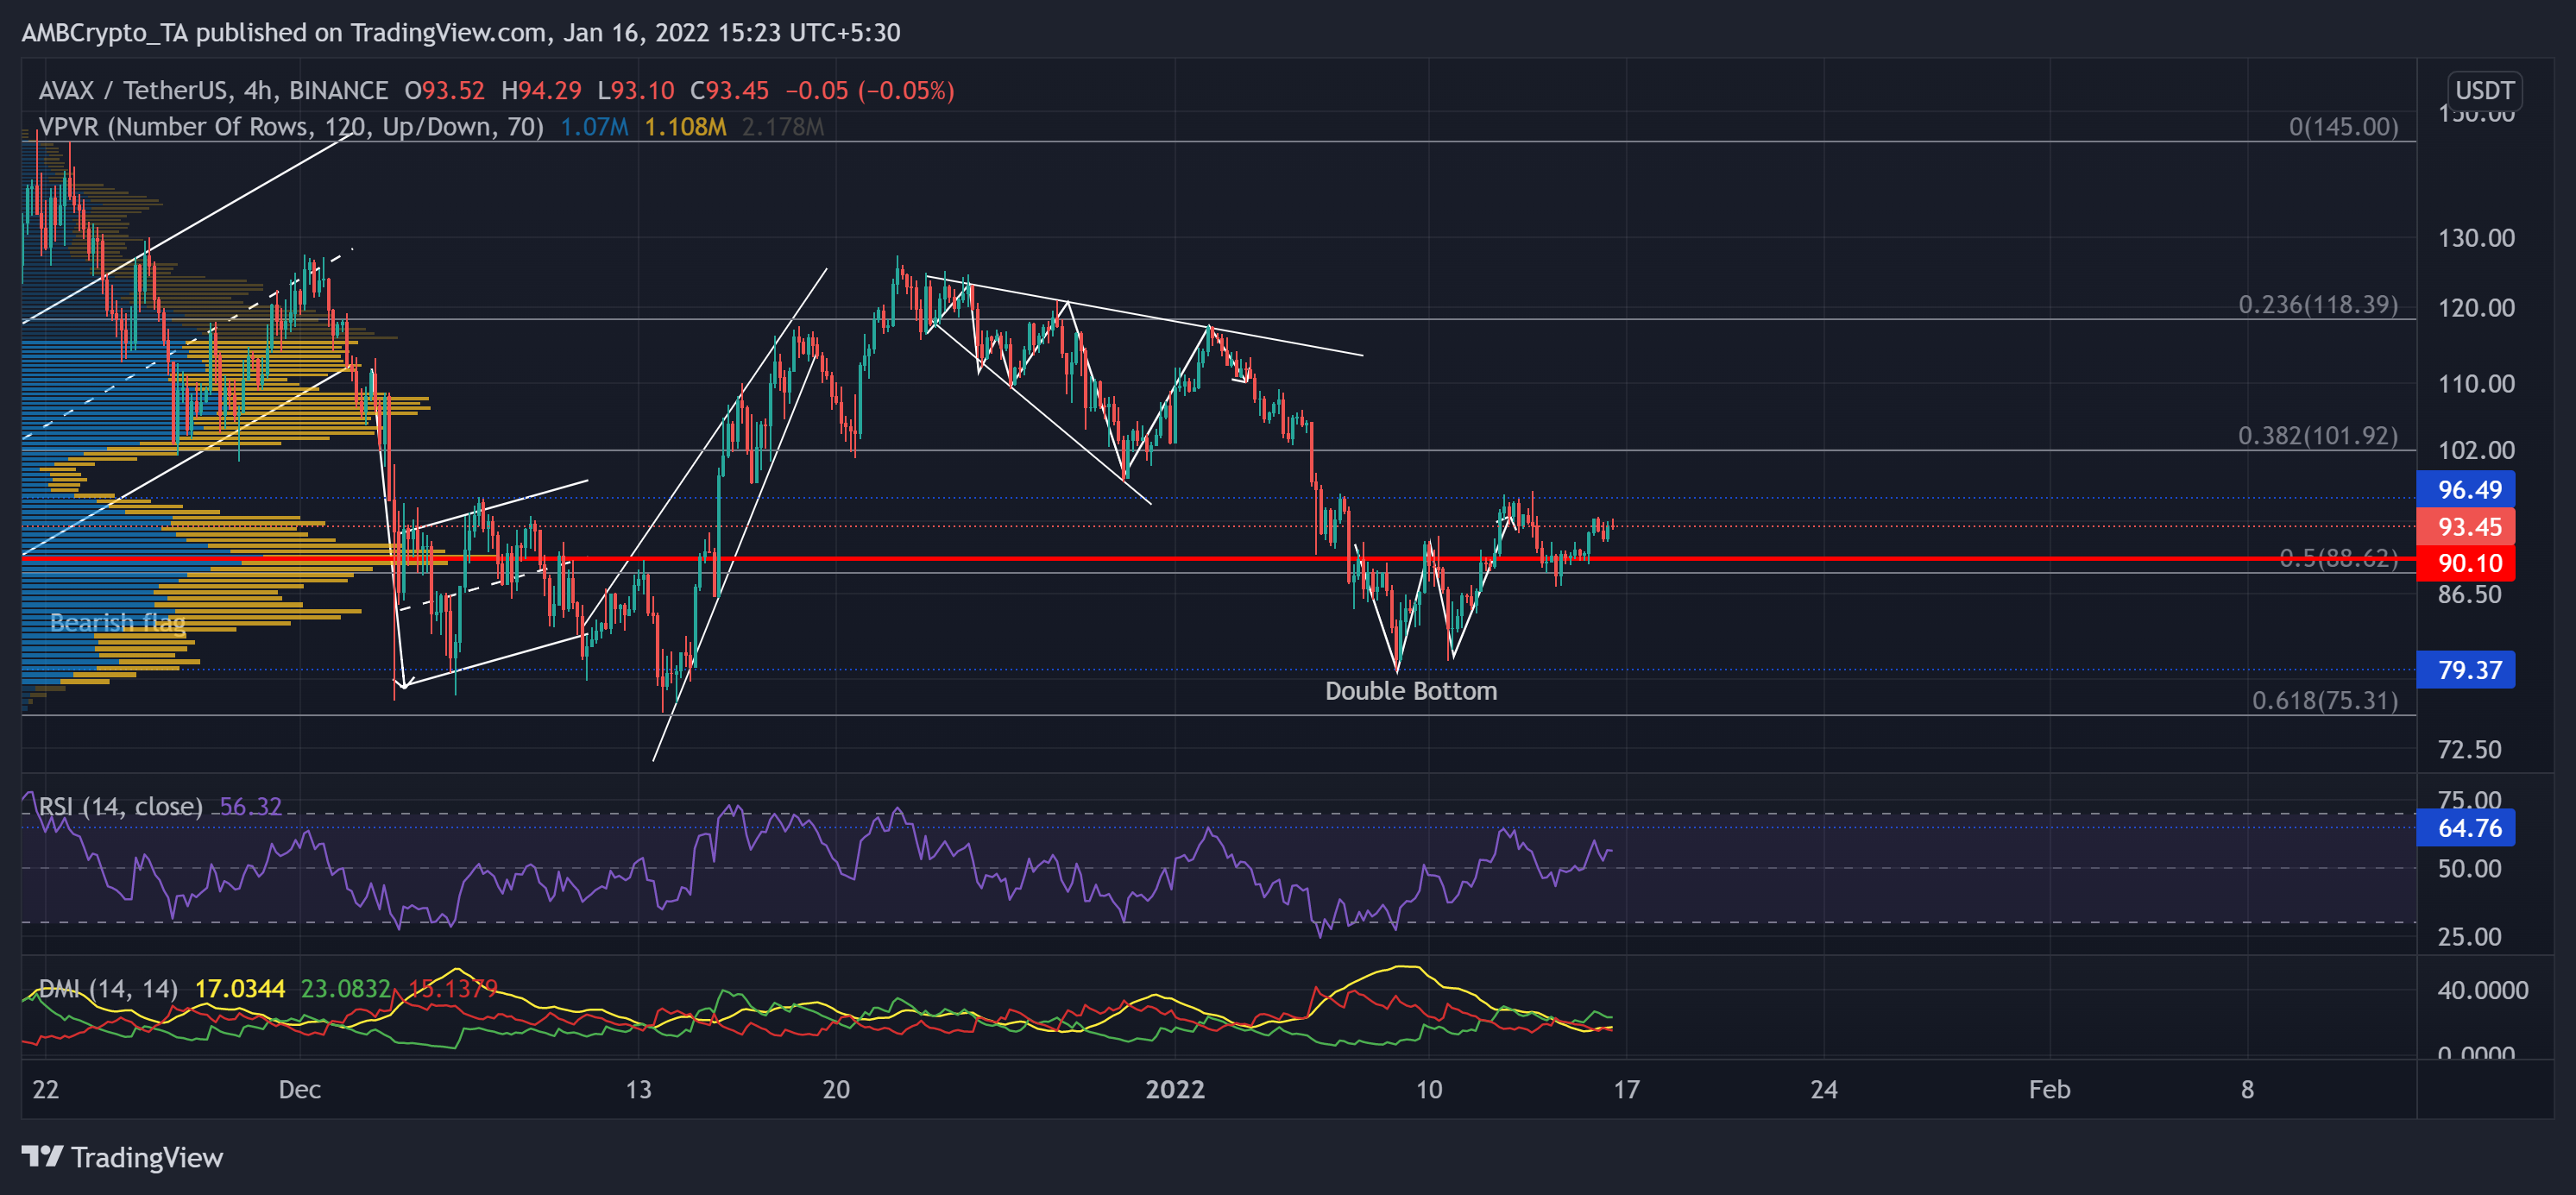
After reversing from the 61.8% Fibonacci support, AVAX noted a staggering 67.8% ROI (from 13 December low) to poke its three-week high on 22 December. Since then, the alt saw a 37.58% retracement and tested the $79.3-support.
Over the past week, after forming a double-bottom (bullish) pattern, it faced strong resistance at the $96.4-mark. Now, the $96-zone was a vital point to overcome for AVAX bulls. Any further retracements would continue to find testing support near the Point of Control.
At press time, the alt traded at $93.45. The RSI marked bullish readings after an uptrend. Also, the DMI depicted a bullish preference. But the ADX displayed a substantially weak directional trend for the alt.
Terra (LUNA)

Since poking its three-week low on 8 January, the alt saw an impressive 38.5% recovery after rebounding from the 61.8% level.
LUNA reclaimed the 38.2%, 23.6% support level and crossed the 4-hour 20-50-200 SMA. Now, the testing point for the bulls stood at the $92-level. Any breakdowns would find testing support at the 23.6% level followed by the 20-SMA (red).
At press time, LUNA traded 15.9% below its ATH at $86.66. The RSI saw a steep incline above the midline. It managed to flip the 61-mark from resistance to immediate support. Also, the Supertrend flashed a green signal. However, the OBV marked lower peaks with the recent hike, hinting at a weak buying pressure.
Chainlink (LINK)
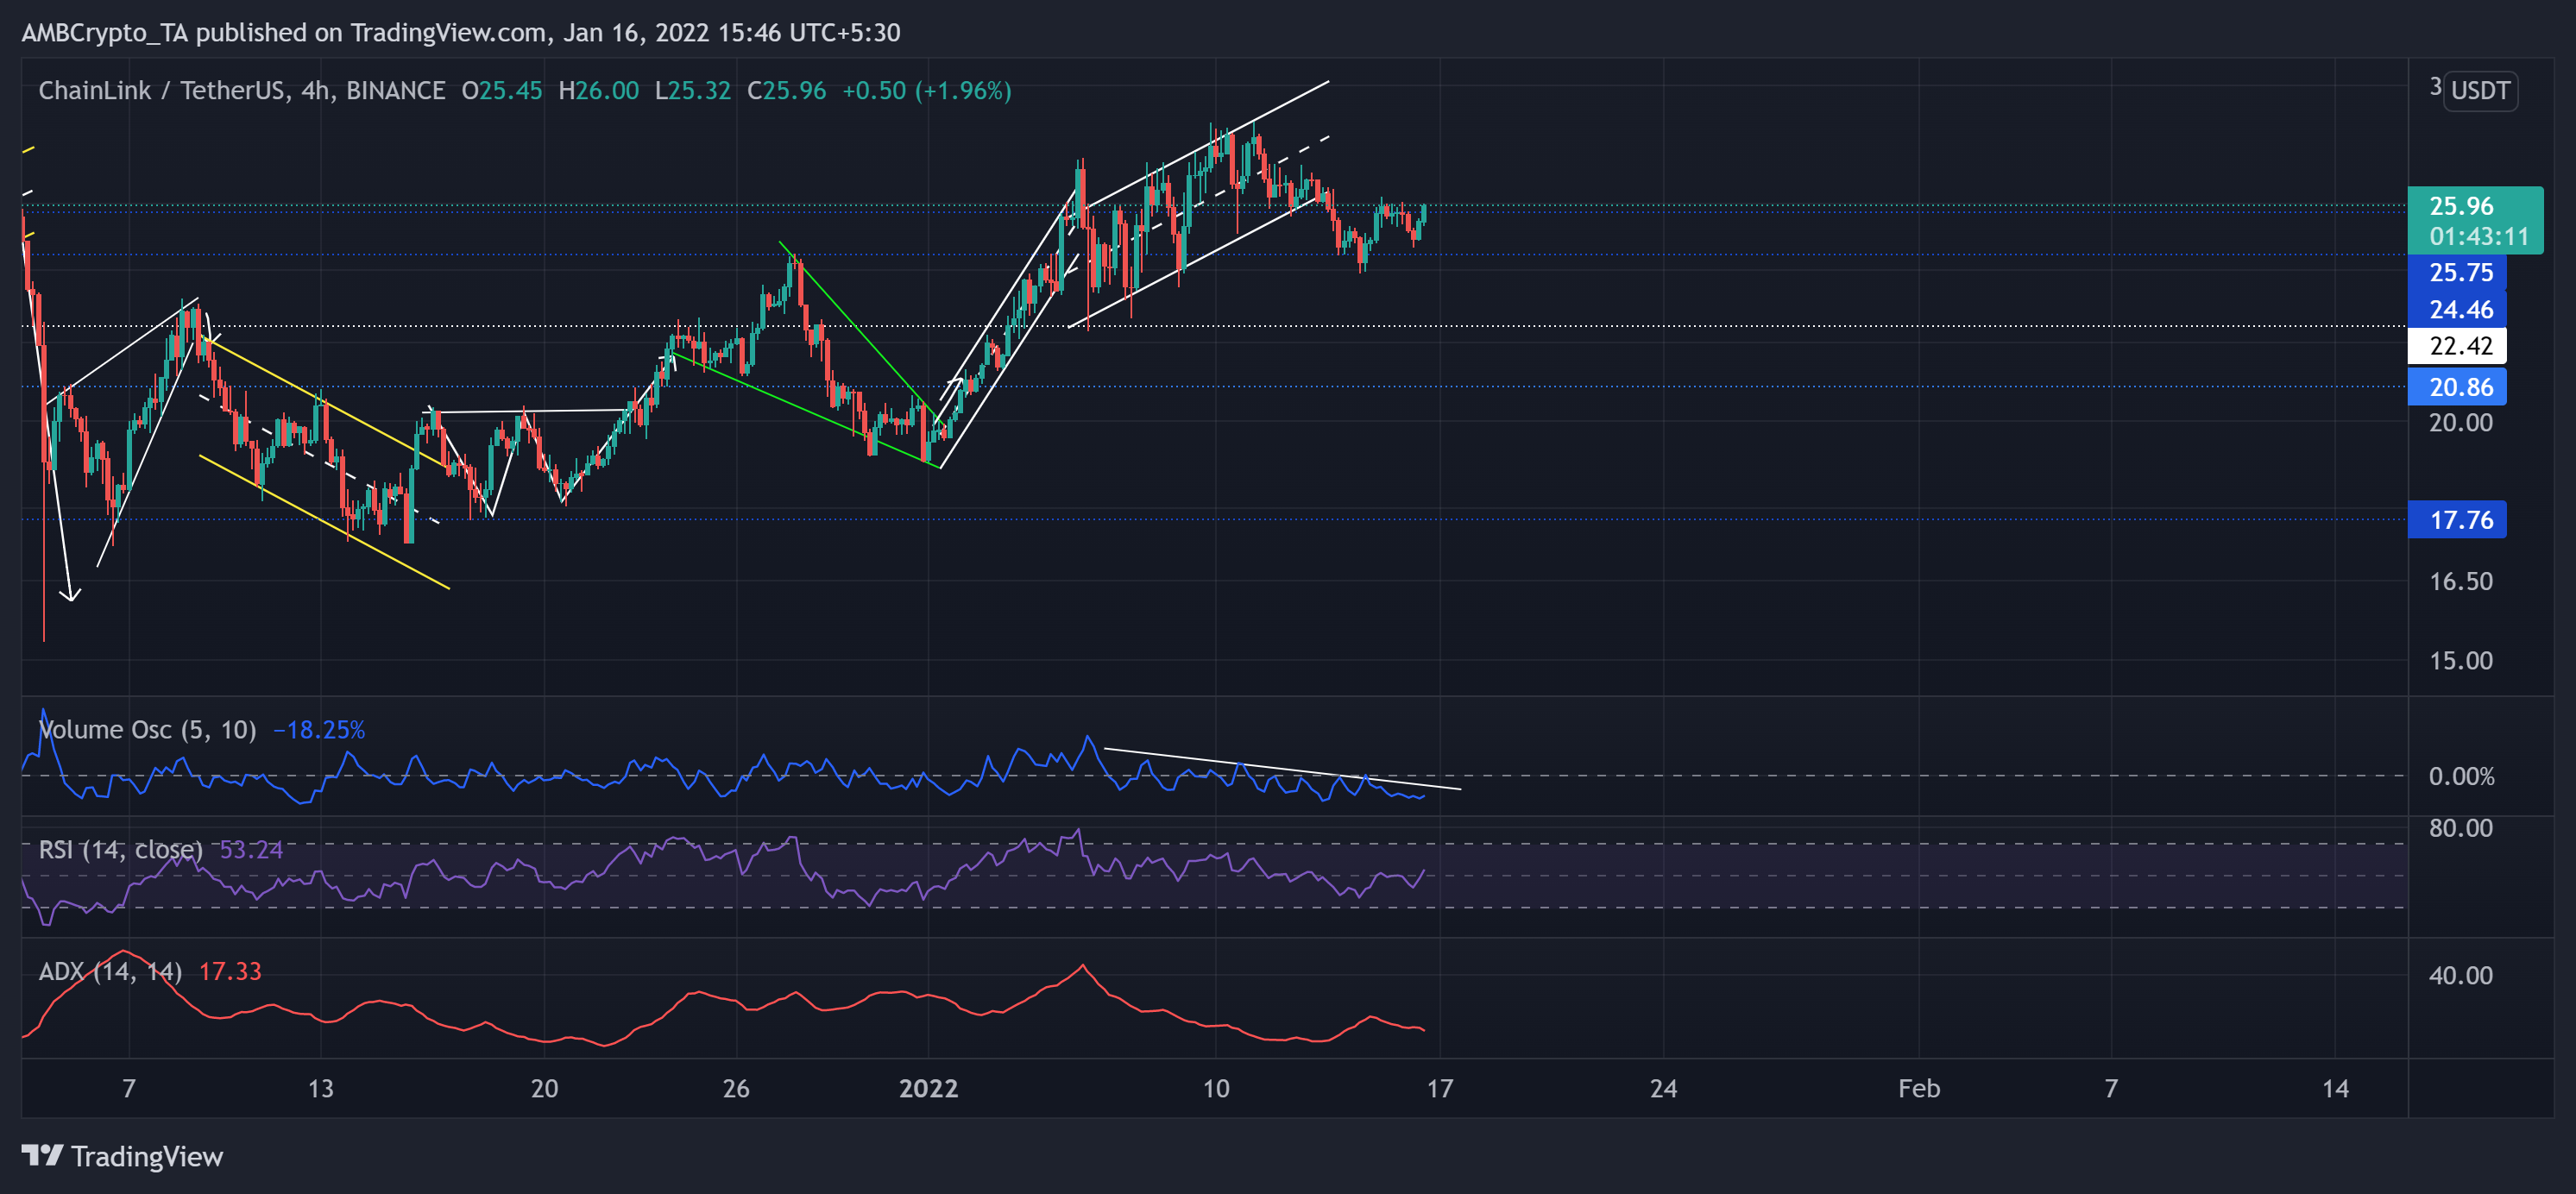
LINK bulls retested the $22.42-level four times over the past month. They finally breached this level after the falling wedge (green) breakout resulted in two up-channels over the past 12 days.
LINK noted a 50.2% ROI (from 1 January low) until it poked its seven-week high on 11 January. The alt flipped the $25.7 support from its nearly six-week resistance. The volume Oscillator continually marked lower peaks since 6 January, indicating a weak bullish rally over the past few days.
At press time, LINK traded at $25.96. LINK witnessed an up-channel breakdown after forming a bearish divergence with the RSI. At the time of this analysis, the RSI managed a comeback above the midline. However, the ADX displayed a weak directional trend for the alt.