Is MANA in a short-term bullish retest or are bears setting a trap

Disclaimer: The findings of the following analysis are the sole opinions of the writer and shouldn’t be considered investment advice
Decentraland’s currency, MANA, was closely following Bitcoin’s price action over the past week. Alongside Bitcoin, MANA too broke above a level of resistance at $2.14, and at the time of writing, it was trading within a pocket of liquidity that has seen intense trading activity in recent days. Bears and bulls were skirmishing at press time.
While MANA has broken the previously bearish market structure on the hourly chart, can the bulls force prices higher once more? Or did the bears cede ground temporarily to decimate late buyers, similar to when Bitcoin bounced to $43k before dropping well below $40k?
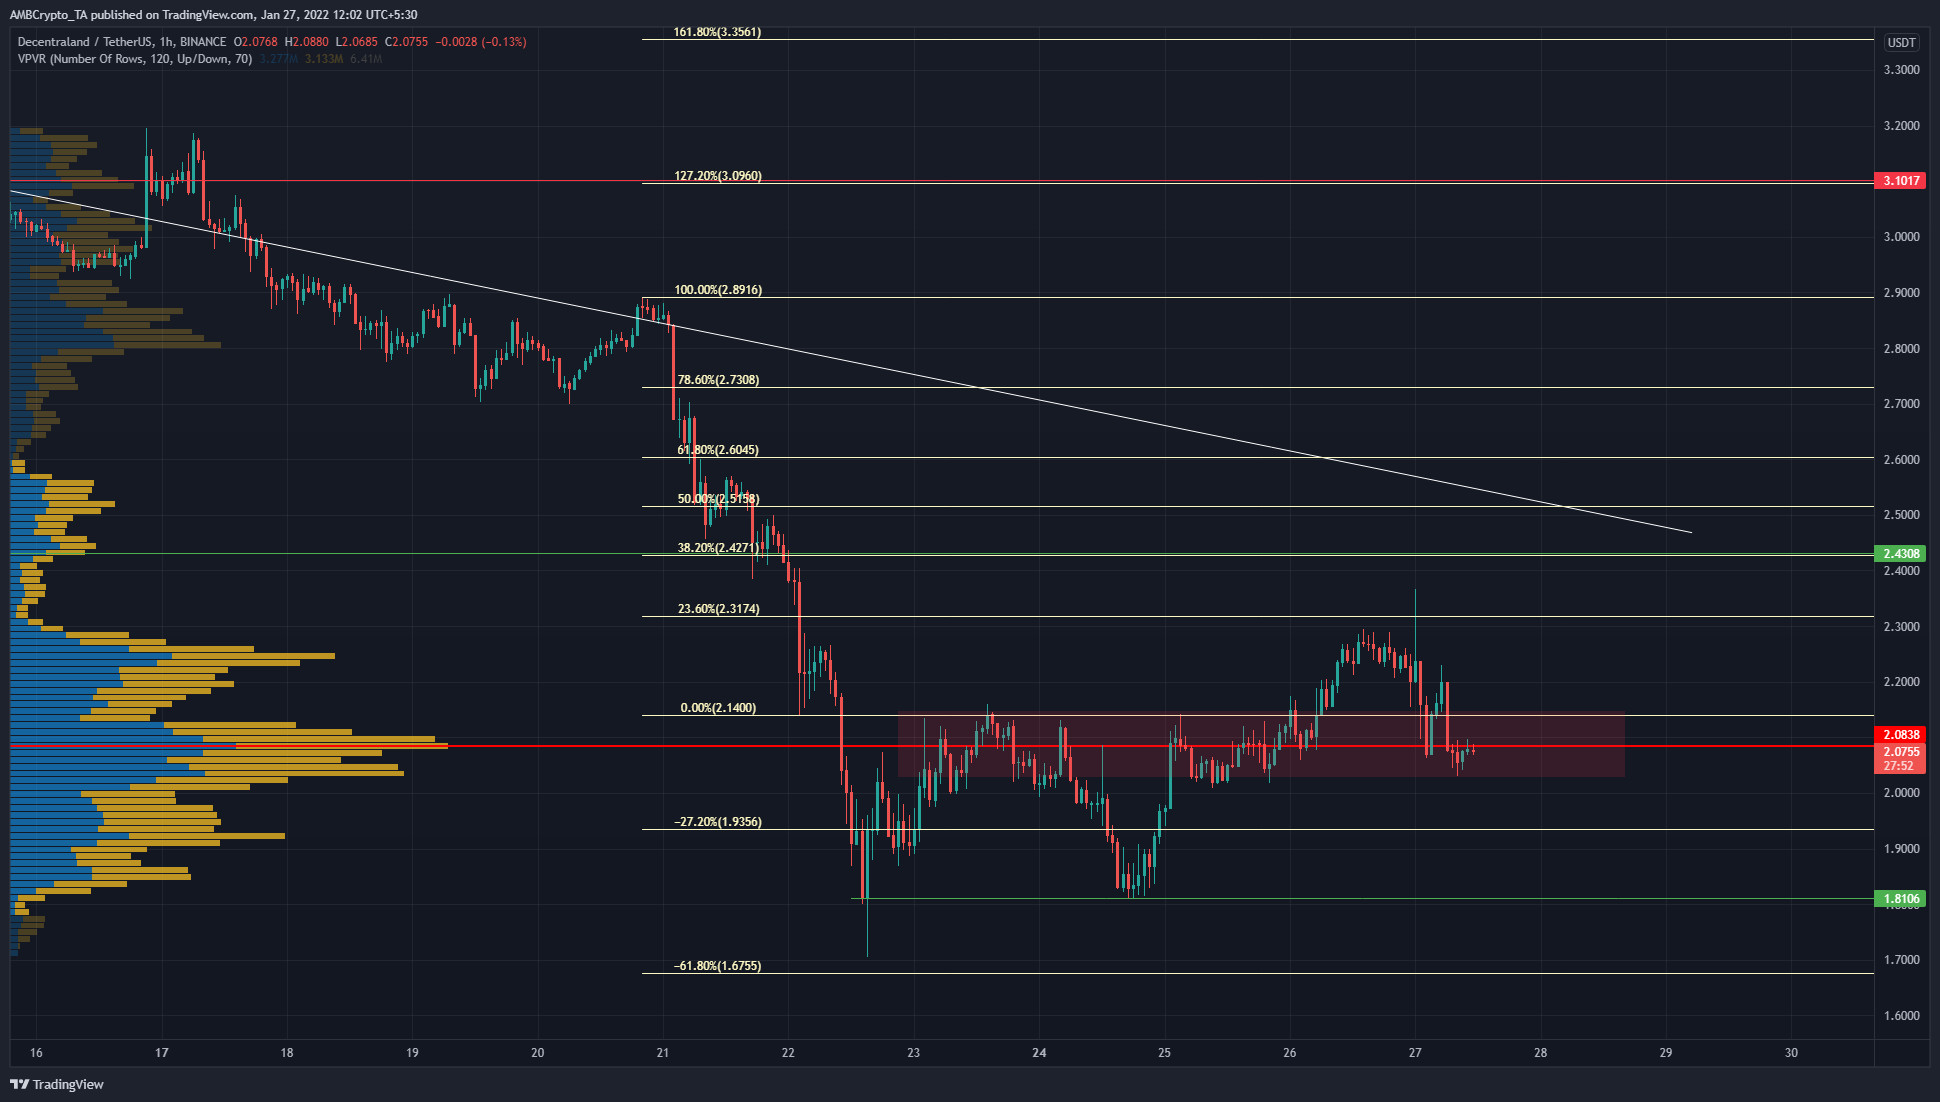
The move from $2.89 to $2.14 was used to plot Fibonacci retracement levels and extension levels (pale yellow). The 61.8% extension level was nearly touched on a candlewick to that area but buyers were able to drive an impulse move to the opposite direction, as high as $2.14.
This demarcated clear areas of demand and supply. However, the past couple of days saw MANA break out past the $2.14 level, and at the time of writing, was trading just beneath this level and within a pocket of liquidity.
In the coming hours, a move higher or lower will occur – But which direction will the next leg be? Was this a bull trap or the beginning of a bullish market structure?
Rationale

The Visible Range Volume Profile showed that, indeed, the $2.1 area was a node with high trading volume in recent days. Other significant nodes lay at $2.25 and $1.93. The Point of Control was at $2.08.
The Chaikin Money Flow was beneath -0.05. This showed that capital flow was directed out of the market. The RSI was also beneath neutral 50 and had been rejected at the 50 value, an indication of bearish momentum. However, a bullish divergence (white) was spotted.
Conclusion
The VPVR and price action pointed to the possibility that bias had flipped from bearish to bullish for MANA. The indicators leaned towards bearish strength. At press time, an outcome was yet to be decided. An hourly session close outside either $2.25 or $1.93 would likely indicate the direction of the next leg for MANA.


