A breakout over this level is important for Dogecoin to show any recovery

Disclaimer: The findings of the following analysis are the sole opinions of the writer and should not be considered investment advice
Dogecoin (DOGE) oscillated between $0.3261 and $0.1685-mark for over six months until the bears flipped the $0.1685-level from support to resistance on 5 January. The recent downtrend practically kept DOGE below all its EMA ribbons for the past 11 weeks.
From here on, until the alt finds a sustained close above the $0.1456- resistance, the EMA lines will continue to be a stumbling block for DOGE bulls before a potential reversal from the long-term falling wedge (white). At press time, DOGE traded at $0.1449 after noting a 1.3% 24-hour gain.
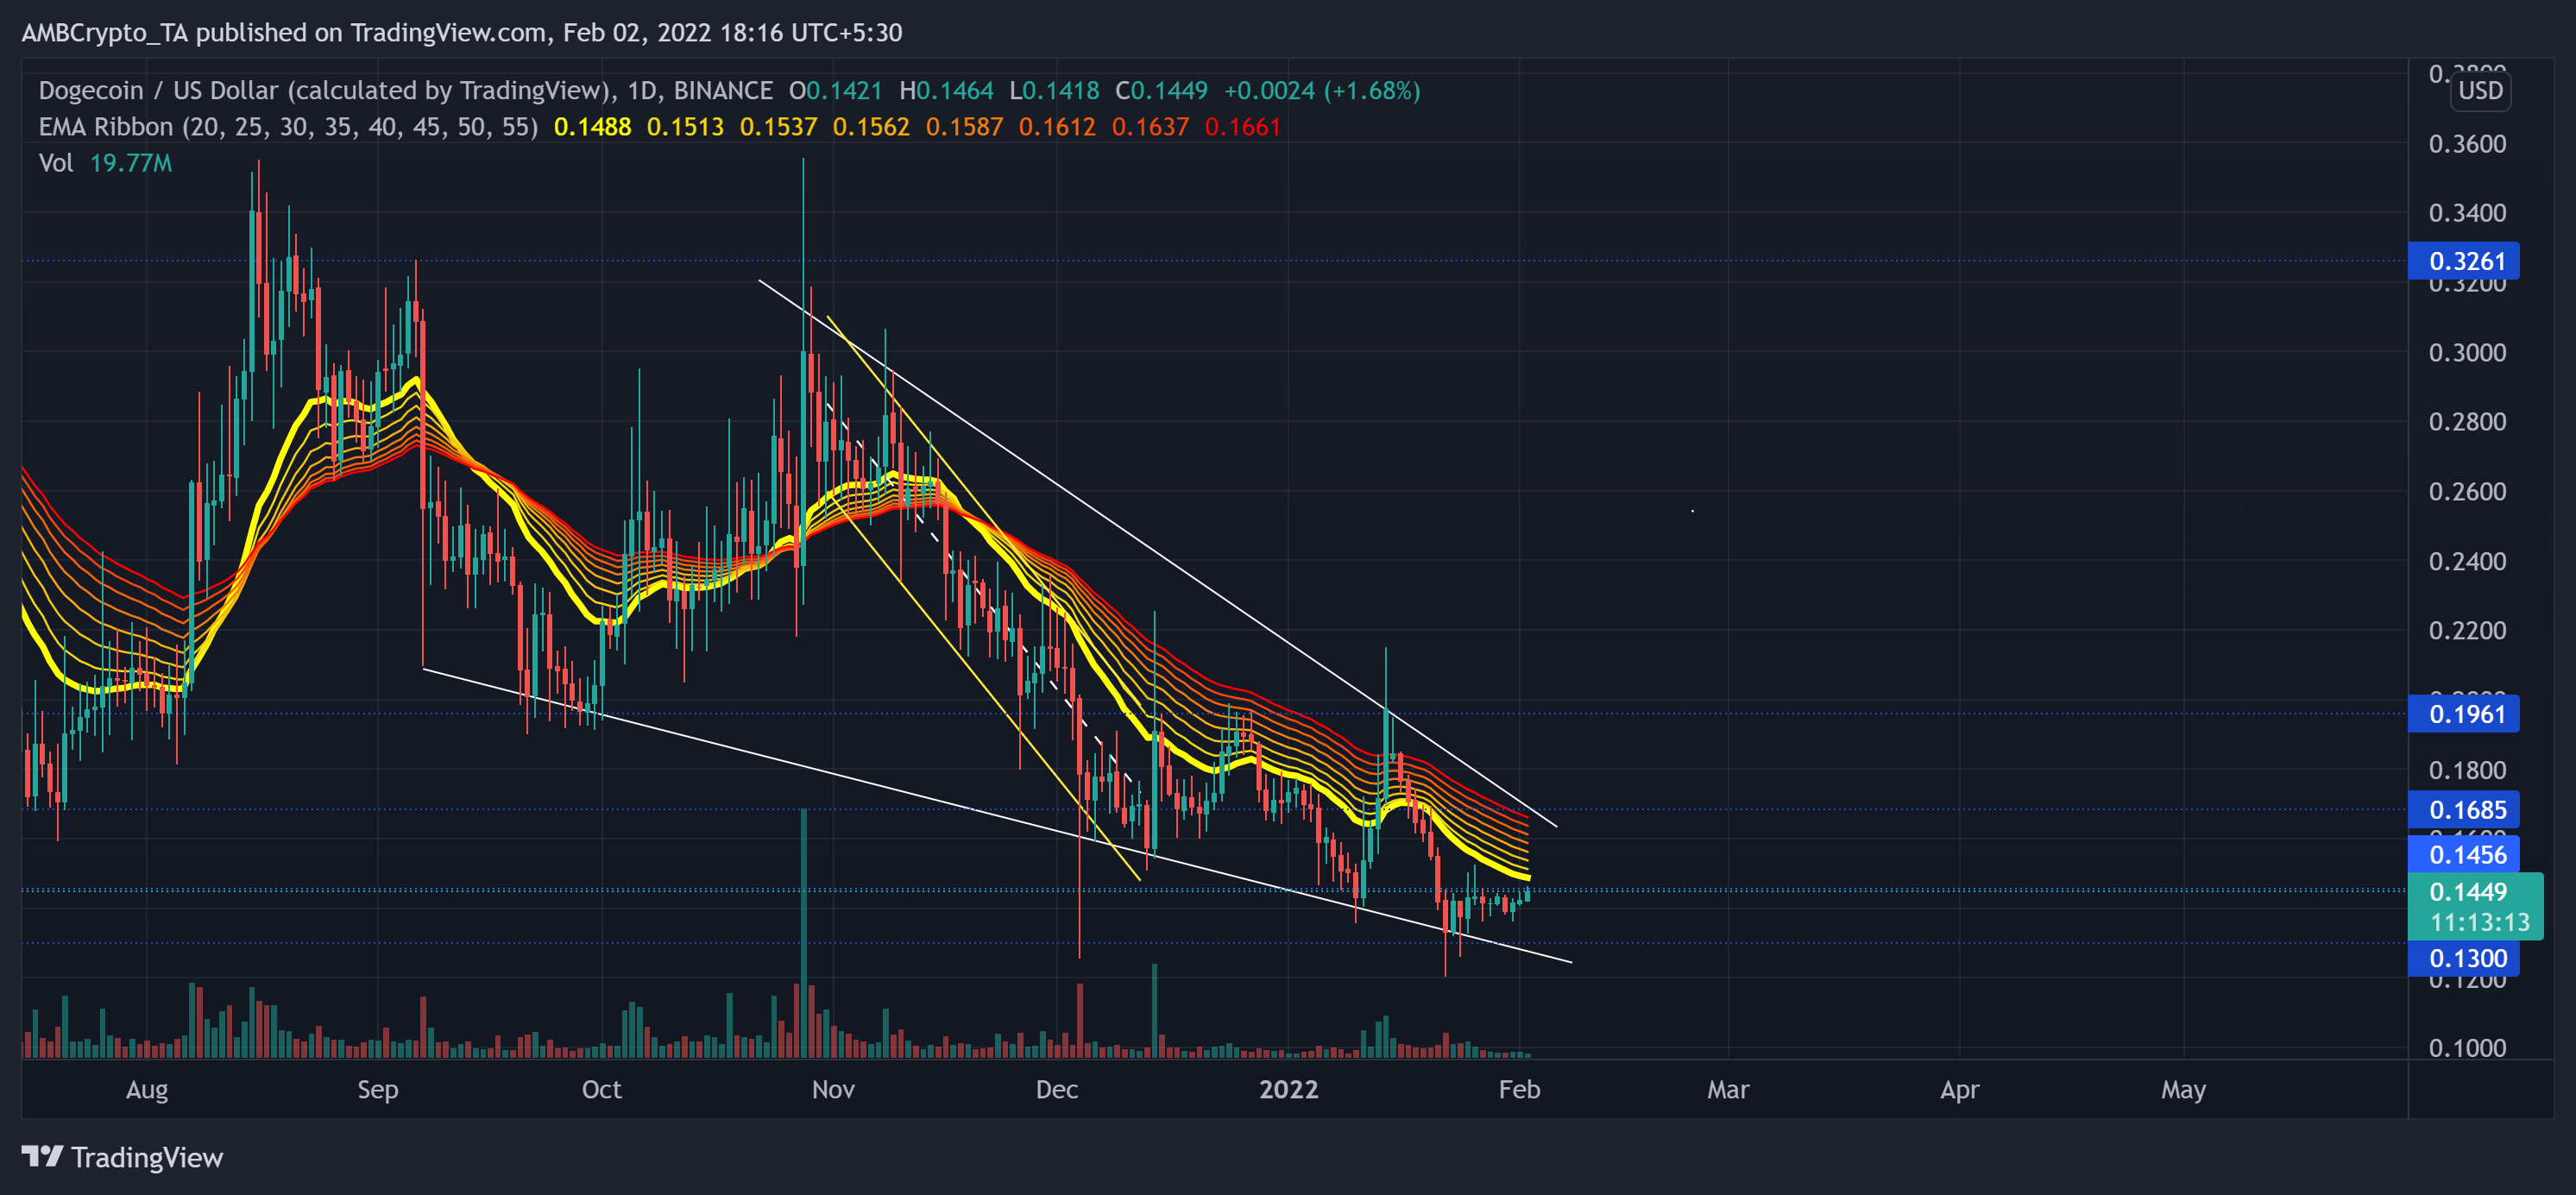
Since the 28 October high, the alt was down by over 66% as it plunged towards its nine-month low on 22 January. During this phase, the only substantial bullish recovery attempts have been when Elon tweeted in favor of the dog-themed coin.
After the descending channel (yellow) breakout, it was crucial for the buyers to step in and defend the $0.145-zone to further prevent a test of the $0.13-mark 42-week support. For the past 11 days, the bulls have been exerting pressure to reclaim the immediate resistance.
This pressure if sustained could propel a retest of the upper trendline of the wedge that also coincides with the 55 EMA. But it becomes crucial to take note of the decreasing volumes over this time frame, revealing the weakness in the recent bullish move. Thus, any close above $0.1456 in the coming days would still not have enough thrust for a strong reversal.
Rationale
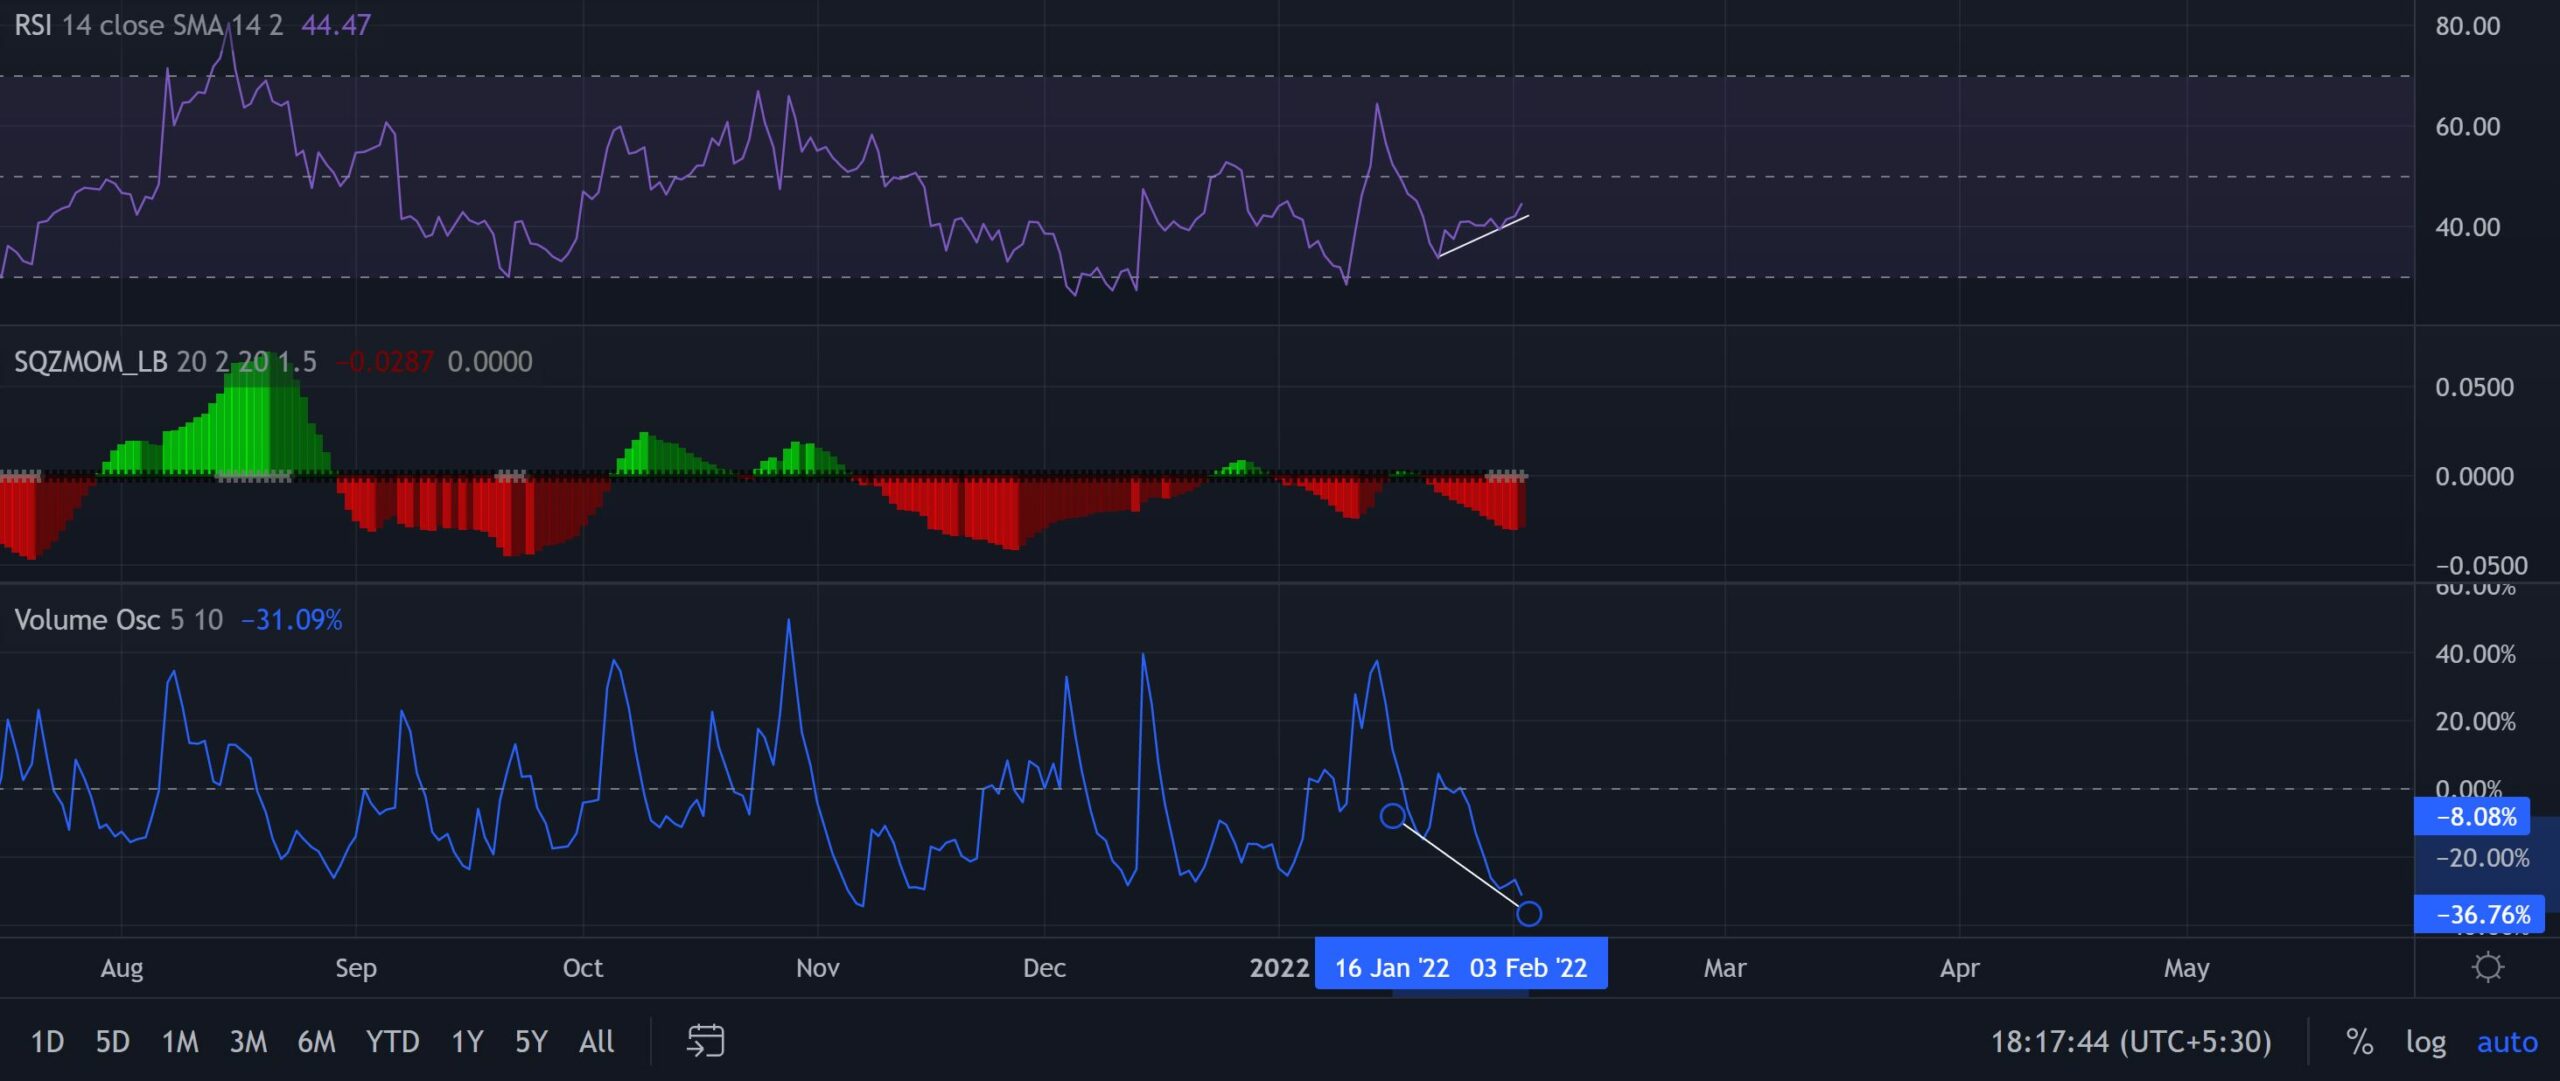
Although the RSI has been on an uptrend, it still needed to overturn its equilibrium on the daily chart to affirm a bullish edge. Now, one must closely monitor a break above its immediate barrier of $0.1456. In which case, a test of the $0.1685-level should not be a surprise to the investors/traders.
Interestingly, the Squeeze Momentum Indicator flashed grey dots after over four months. As a result, this potentially high volatile phase could see near-term gains before a retest of the $0.13-support.
Conclusion
It would be prudent to wait for a close outside one of the trendlines before taking a position. Although the indicators are flashing mixed signs, one must take note of the strength of the current trend. The Volume Oscillator marked lower peaks and troughs in the last two weeks, hinting at a weak bullish recovery attempt.
Furthermore, Bitcoin’s movement also needs to be factored in as DOGE shares an 80% 30-day correlation with the king coin.