Shiba Inu, Binance Coin, Avalanche Price Analysis: 13 February

Shiba Inu saw impressive gains after snapping off its trendline resistance but still struggled to topple its long-term 23.6% Fibonacci resistance. Contrarily, Binance coin and Avalanche continued their up-channel oscillation while witnessing a clash between the bulls and bears at crucial price points.
Shiba Inu (SHIB)
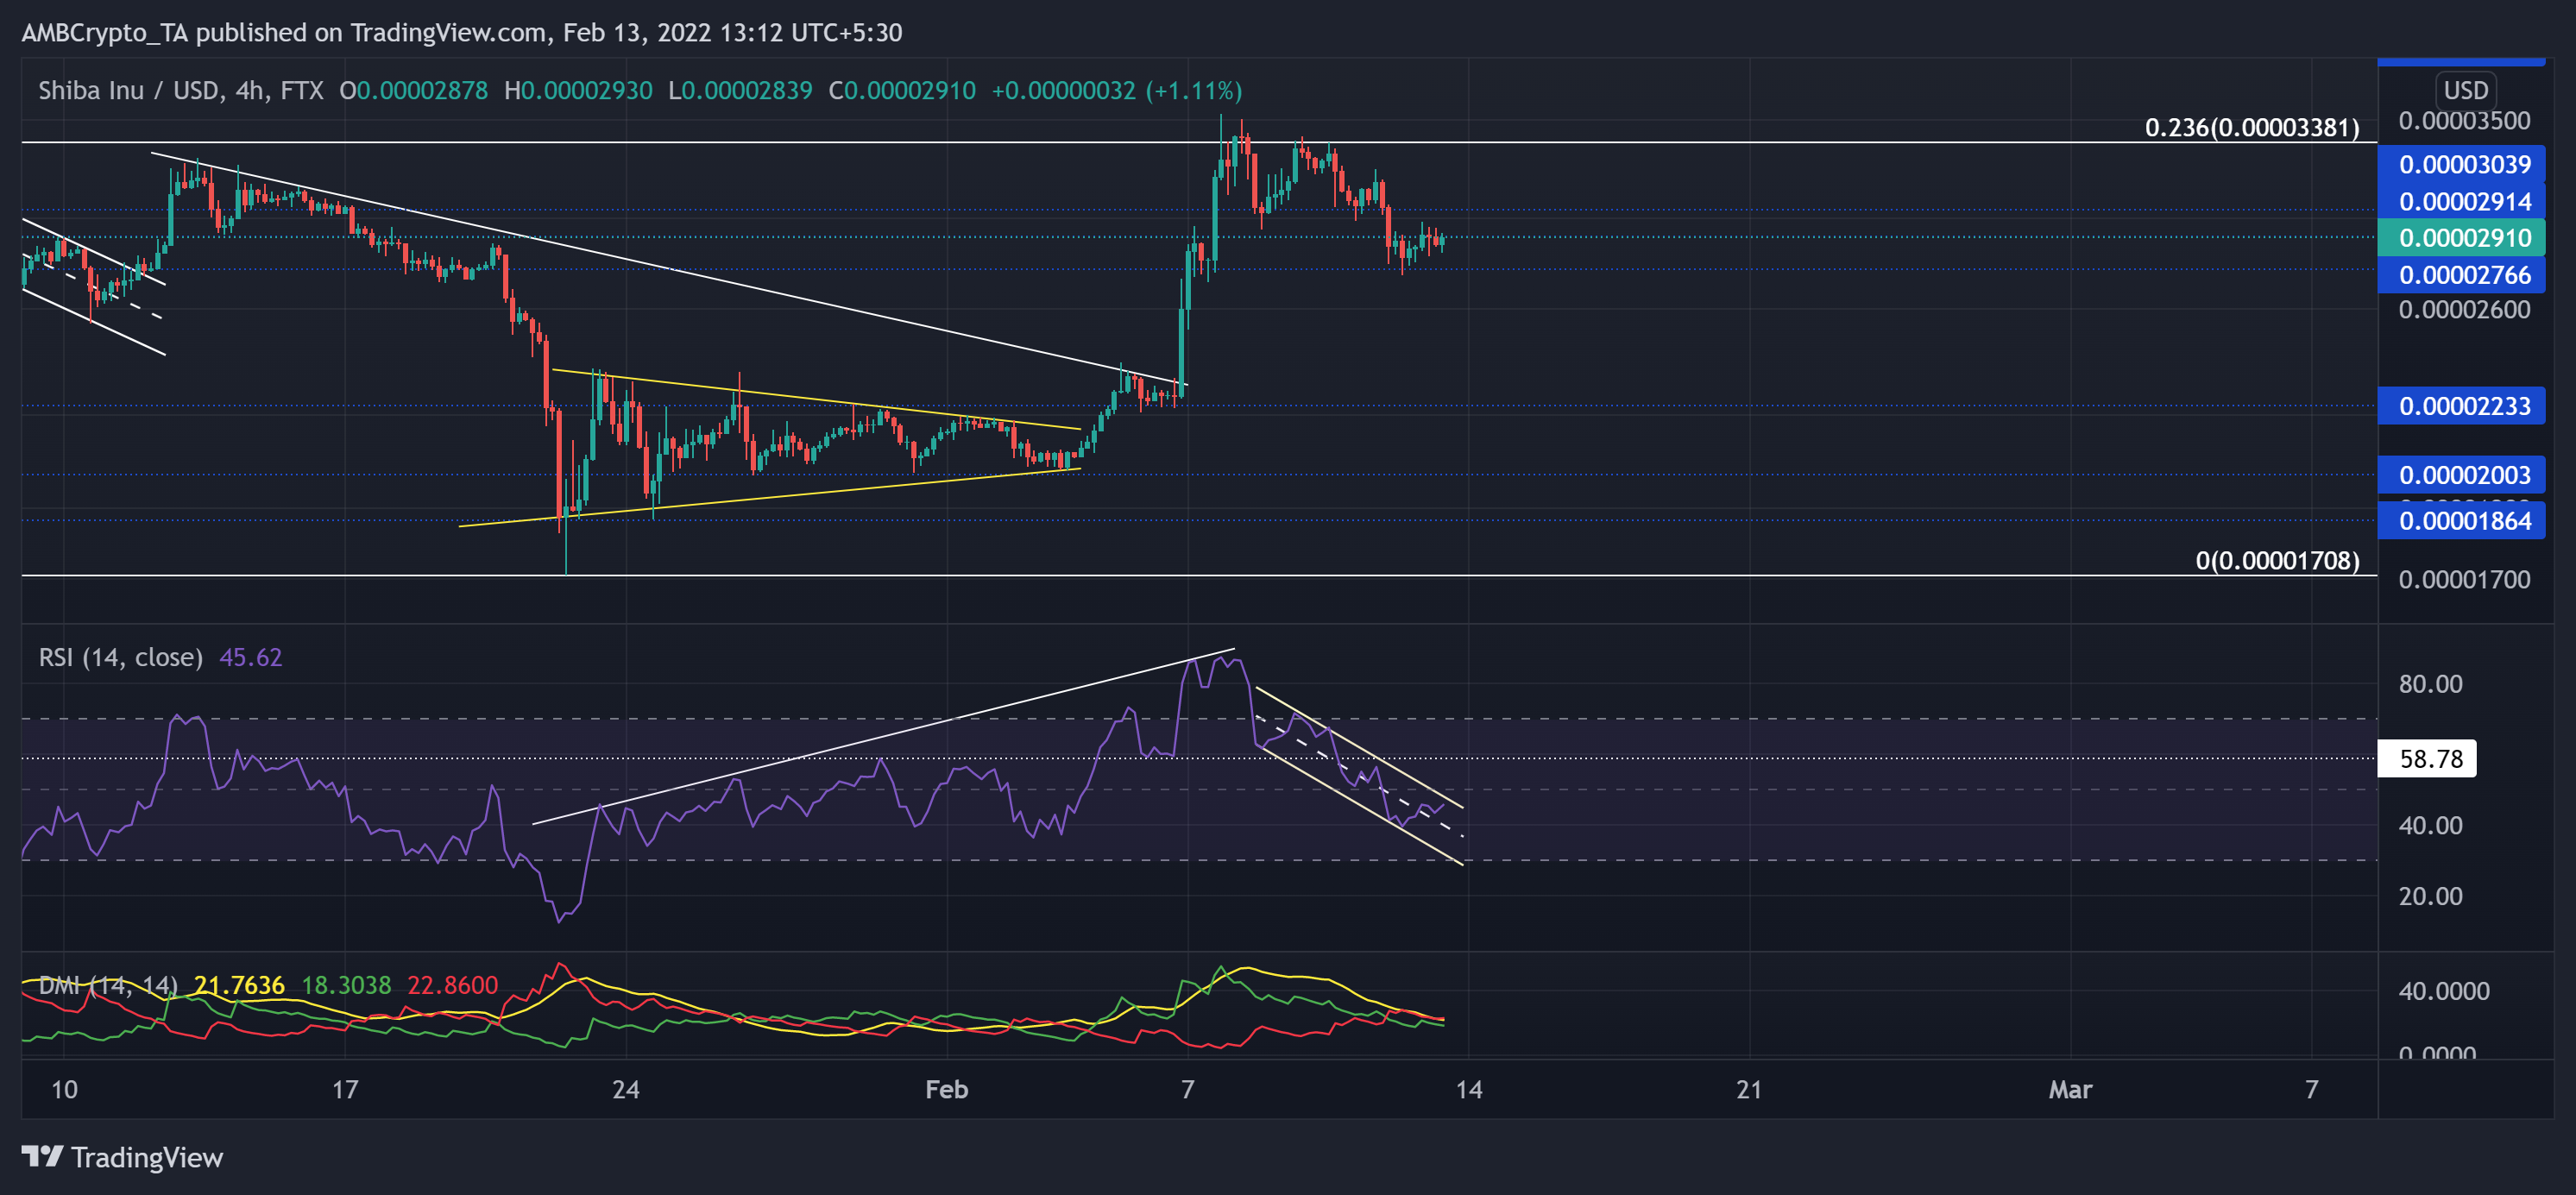
After the alt poked its three-month low on 22 January, the buyer stepped in at the $0.000018-mark. Since then, SHIB bulls initiated a recovery and breached the crucial trendline resistance (white).
The meme coin saw a symmetrical triangle (yellow) breakout on its 4-hour chart on 4 February. Thus, the bulls tested the 23.6% Fibonacci resistance after noting a staggering 75.5% ROI (from 4 February low). Now, the buyers faced a barrier at the $0.000029-mark. Any breakdowns would find testing support near the $0.000027-mark.
At press time, SHIB was trading at $0.0000291. After an exponential surge toward the overbought region, the RSI descended below the midline in a down-channel (white). Any patterned breakout would heighten the chances of reclaiming the 50-mark. Although the DMI lines flashed a bearish preference, the ADX displayed a weak directional trend for SHIB.
Binance Coin (BNB)

As BNB broke down from the vital $512-mark, it witnessed two substantial sell-offs. As a result, BNB hit its 16-week low on 24 January.
However, bulls initiated a recovery as the alt saw a 32.5% ROI and poked the $445-mark. Meanwhile, the alt formed an ascending channel (green) on its 4-hour chart. Now, the immediate resistance stood near the $414. On the flip side, a fall from this level would find testing support near the lower trendline.
At press time, the BNB traded at $403.7. The RSI rapidly grew after breaking out of the 11-day rectangle top (yellow). After testing the overbought region twice, it fell below the midline and depicted a bearish bias in the last few days. Nevertheless, the CMF still managed to find a close above the zero-line, revealing that the bulls have not yet dwindled.
Avalanche (AVAX)
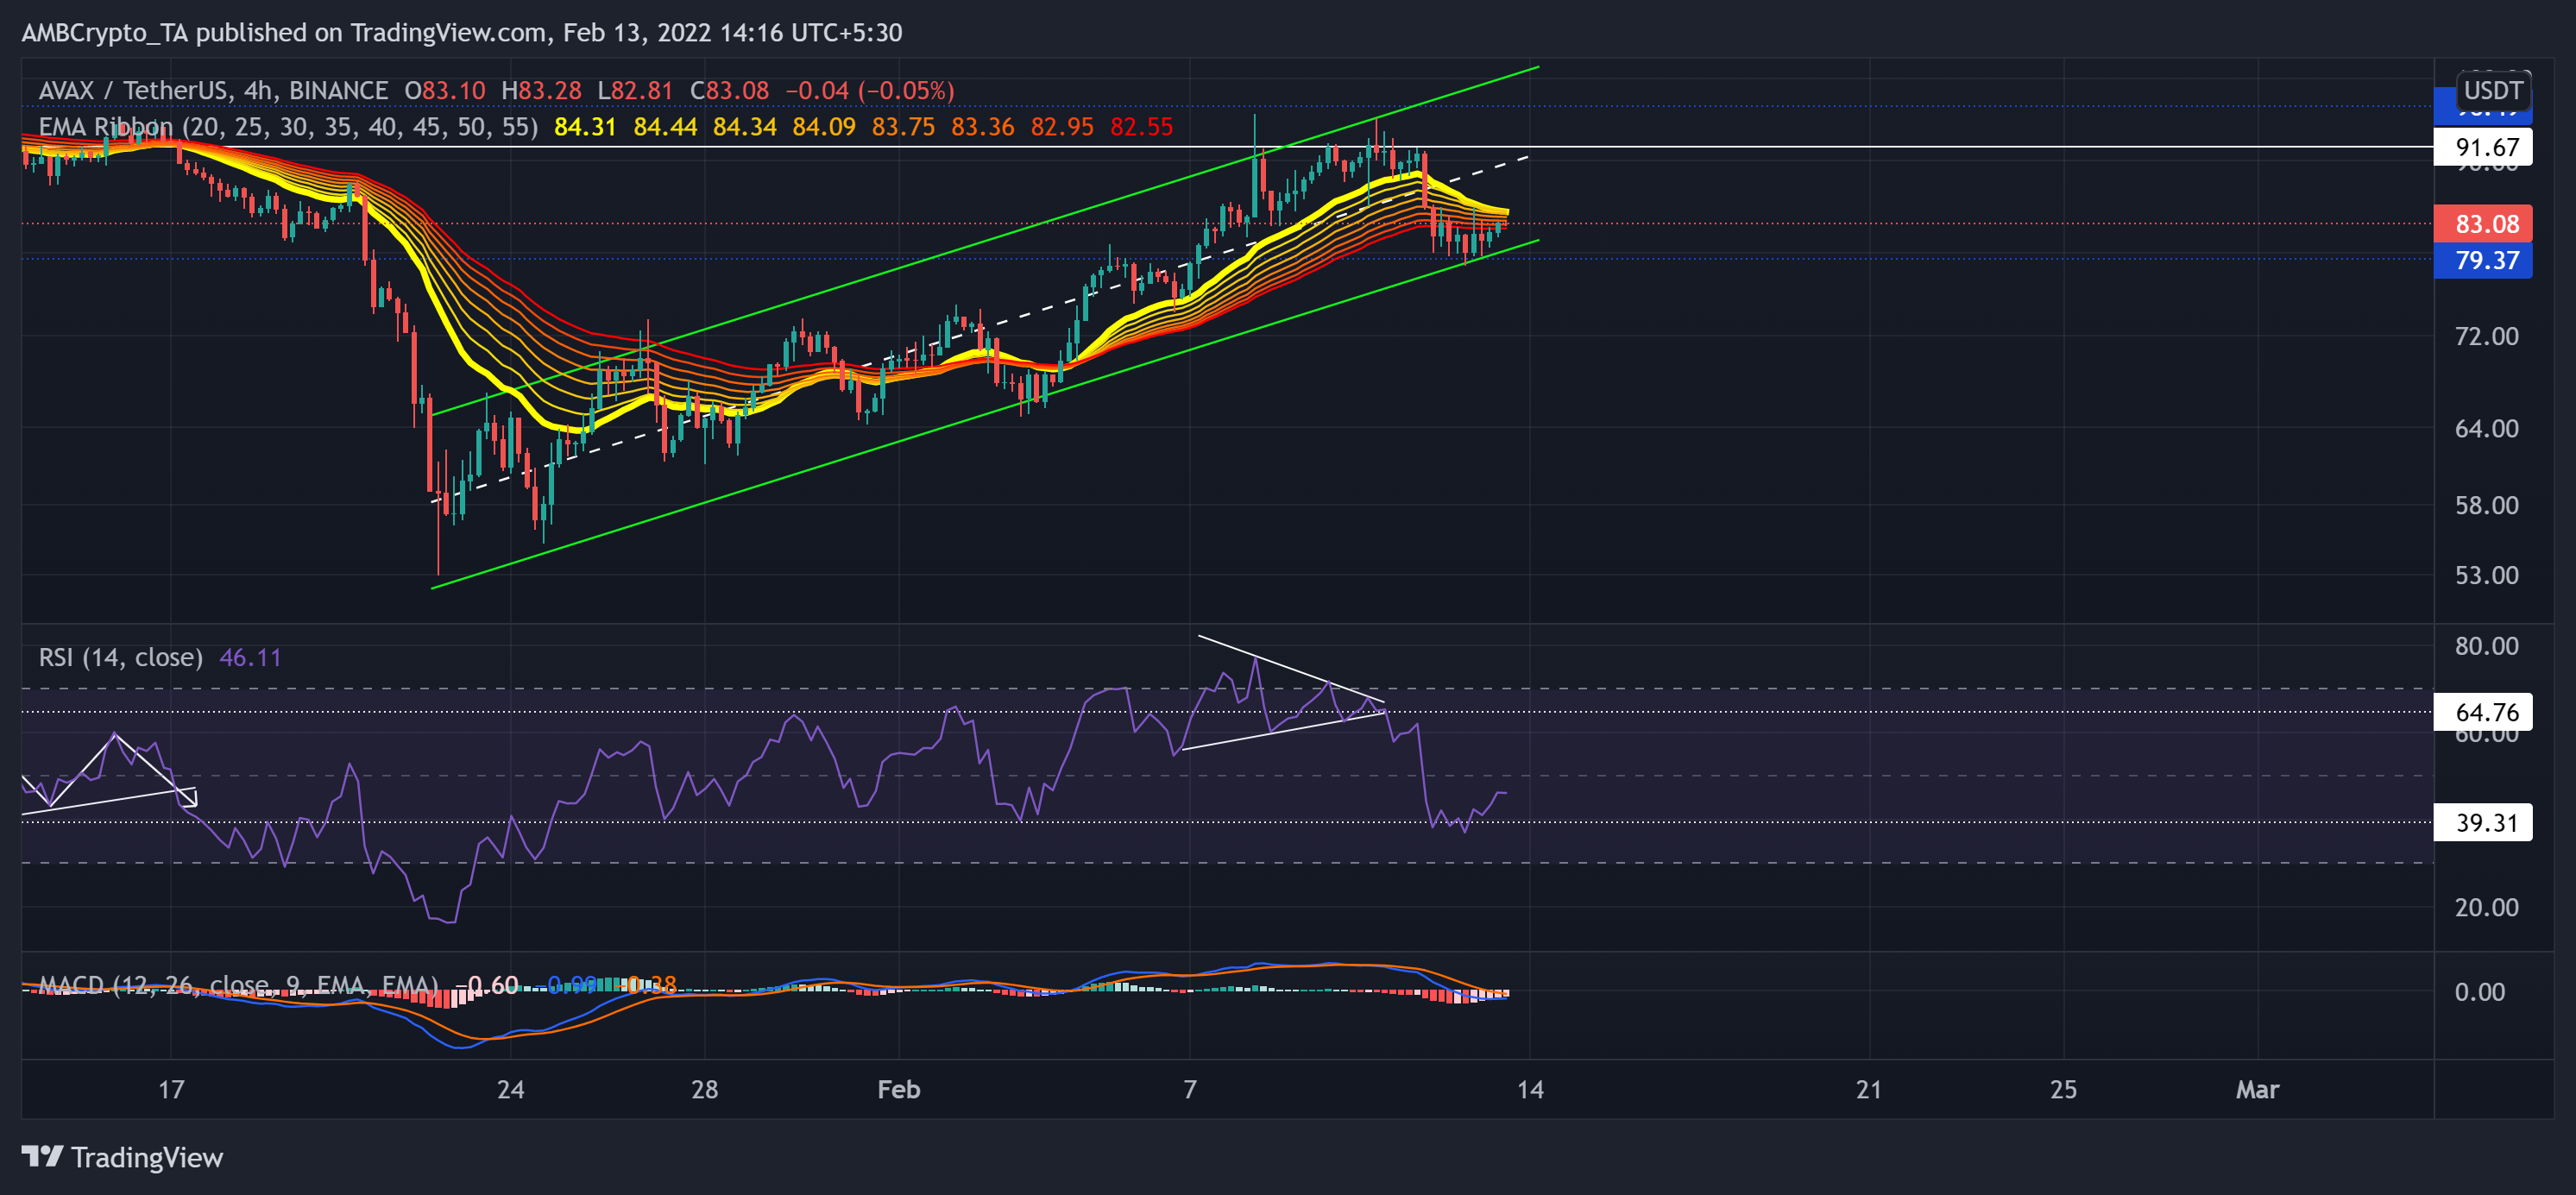
The double-bottom breakout on its 4-hour chart failed to cross its month-long resistance at the $96.49-mark. AVAX saw a 54.8% retracement (since 2 January) and poked its 14-week low on 22 January.
Since then, the alt registered an exceptional 78.4% gain as it poked the $95-mark on 8 February. Over the past two days, it fell below all its EMA ribbons to test the $79-support. Now, the bulls endeavored to reclaim the 20 EMA support.
At press time, the AVAX traded at $83.08. Since its symmetrical triangle (white) breakdown, the RSI tested the 39-point support before a slight recovery. It still swayed sideways, favoring the bears. However, the MACD histogram showed improvement as it approached the half-line. But its lines still struggled to find a bullish crossover.


