Ethereum: Here’s how market bulls can prove they are back

Disclaimer: The findings of the following analysis are the sole opinions of the writer and should not be considered investment advice
In recent months, macro factors have had a bearish impact on the price of cryptocurrencies. Even though the past three weeks have seen a bullish price movement on the charts for Ethereum, it was unclear whether Ethereum can climb back towards the $4000 mark. The latest CoinShares report highlighted that positive sentiment could be seen once again for Ethereum, despite the sharp drop in transaction fees and demand for Ether in the past four months. Will this shift in sentiment see a shift in market structure on the charts as well?
ETH- 12H
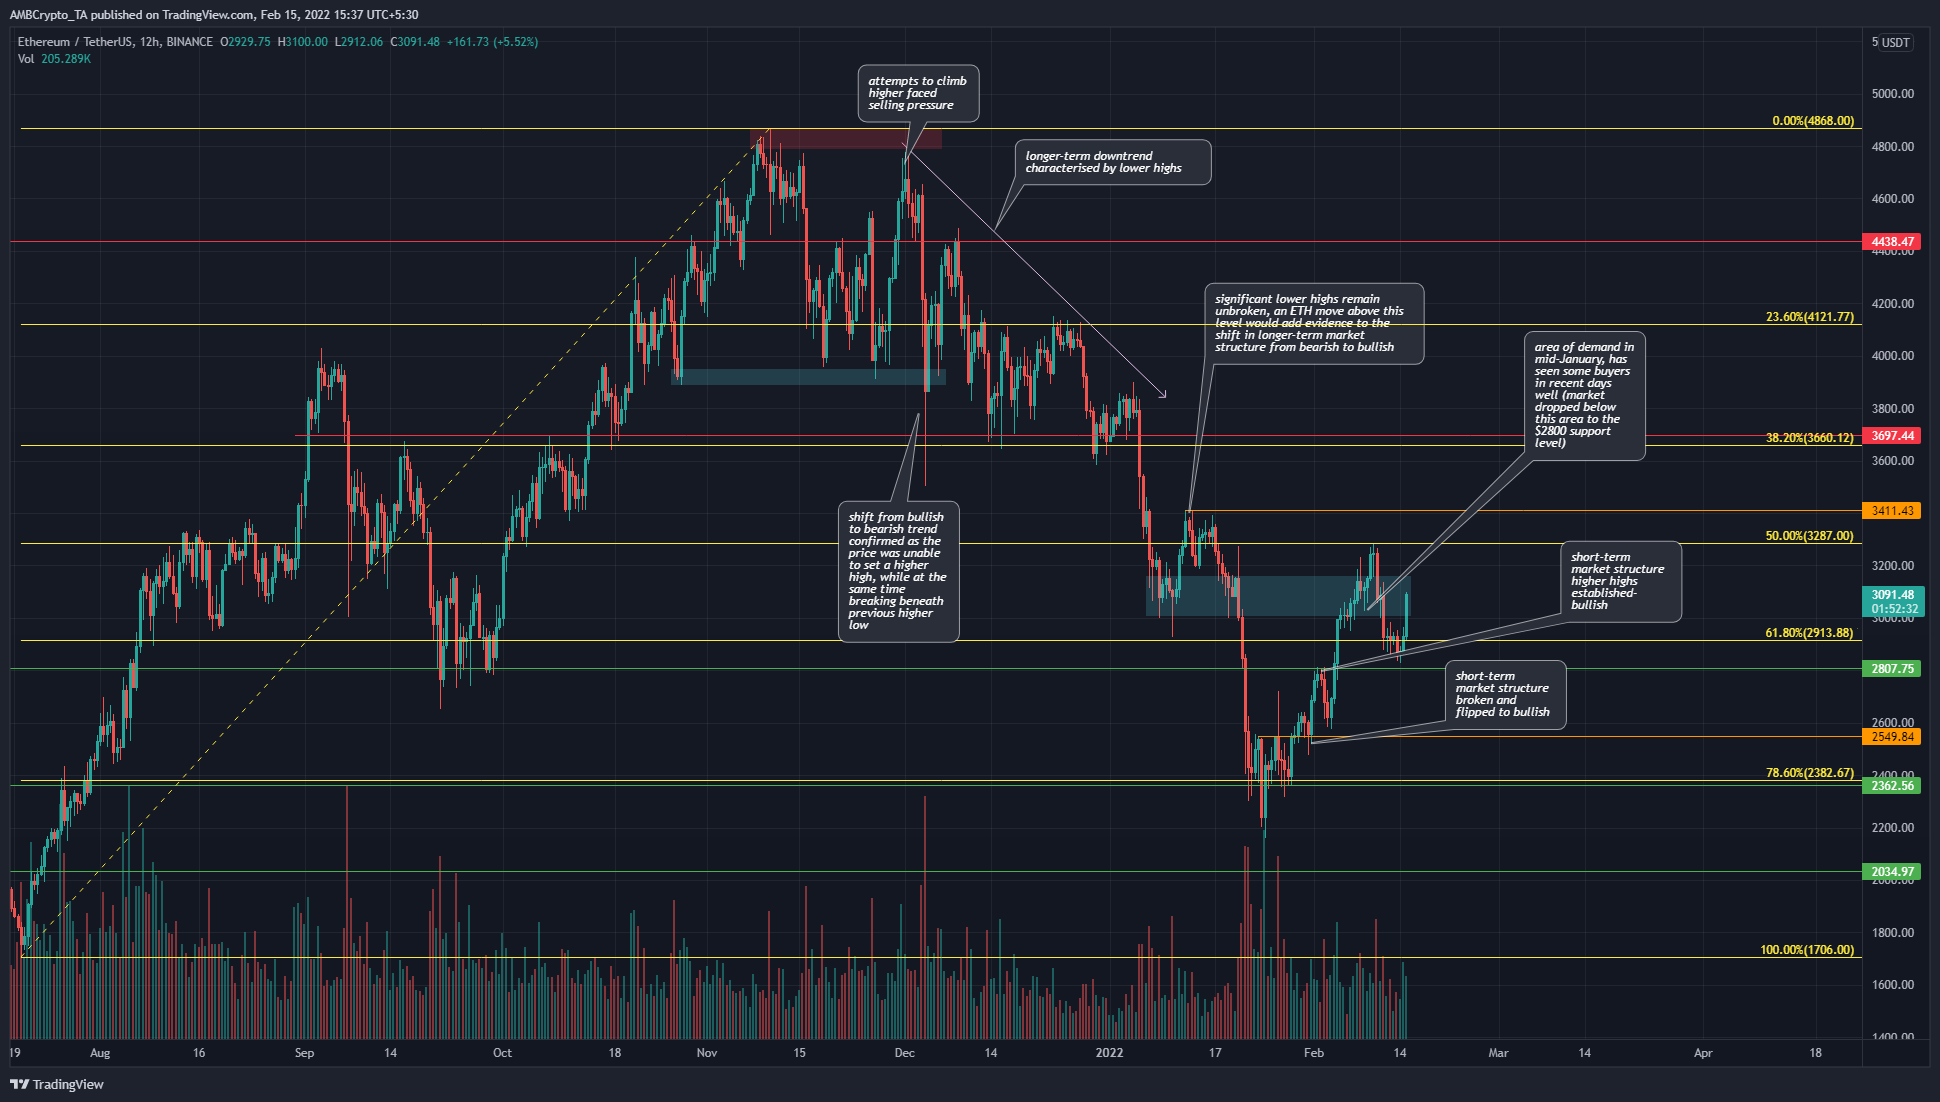
As highlighted on the charts, the downtrend established when ETH dropped below $4121 in December was followed by further, sharper falls that took ETH to $2171 in January. Since then, some demand was seen and has pushed prices toward $3000.
The $3411 level was marked (orange) as the previous lower high to beat to flip market structure to bullish on a longer-term outlook. The market structure was already bullish in the past two weeks, despite the sharp, recent pullback from $3283 to $2829. $2807 was a long-term horizontal support level, while $3287 was the 50% Fibonacci retracement level (yellow).
The $3150-$2950 (cyan box) was highlighted as a buying opportunity. ETH dipped lower than this area but has subsequently bounced back as well.
Rationale
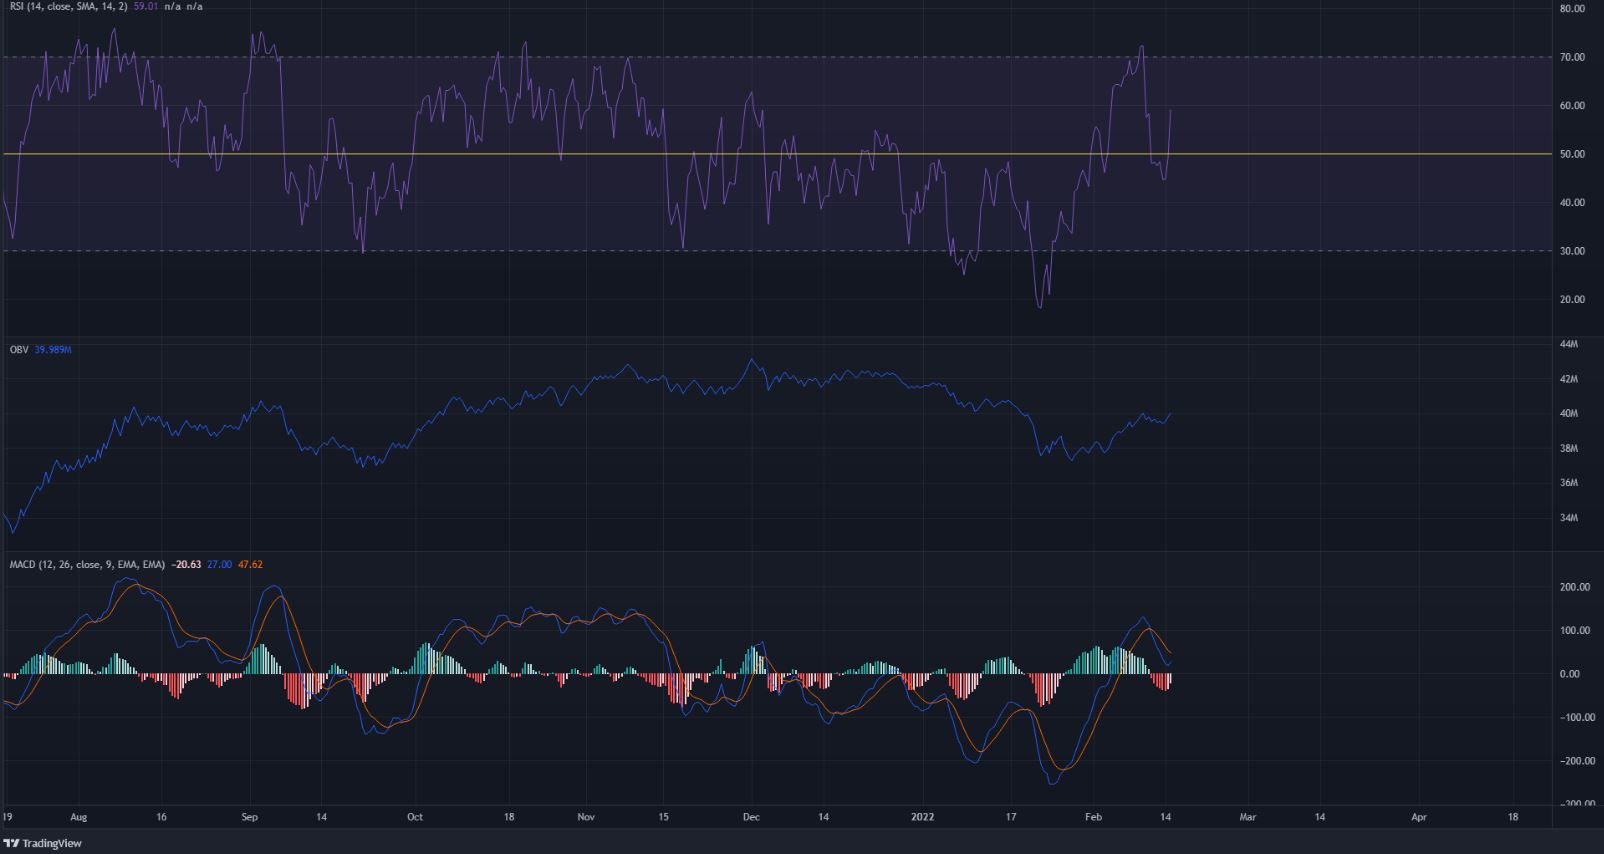
The RSI on the 12-hour chart rose just above 70 in recent days, pullback to 45 and has since then climbed back above neutral 50. While this was highly volatile, this was also a sign of strong recent bullish momentum. The MACD also climbed above the zero line, and stayed in bullish territory despite the pullback.
The OBV has also been trending upward in the past couple of weeks, but, like the price, has been on a downtrend since November.
The market structure remained bearish, but momentum has been turning in recent weeks.
Conclusion
The indicators showed bullish momentum on the rise recently, but the $3411 level has to be broken and retested as support to provide evidence that bulls are likely back in the driving seat.


