MATIC: The how and why of what must happen before a trend change

Disclaimer: The findings of the following analysis are the sole opinions of the writer and should not be considered investment advice
After a steady rally towards its ATH on 27 December, MATIC vigorously declined by piercing through some critical price points and turning them to resistance.
Now, a sustained close above the $1.4-zone would set the alt up for a patterned breakout. Alas, a close below the trendline resistance (white) would reaffirm the bearish divergence with its RSI. This would push MATIC back into its patterned oscillation.
At press time, MATIC was trading at $1.465, up by 3.34% in the last 24 hours.
MATIC 4-hour chart
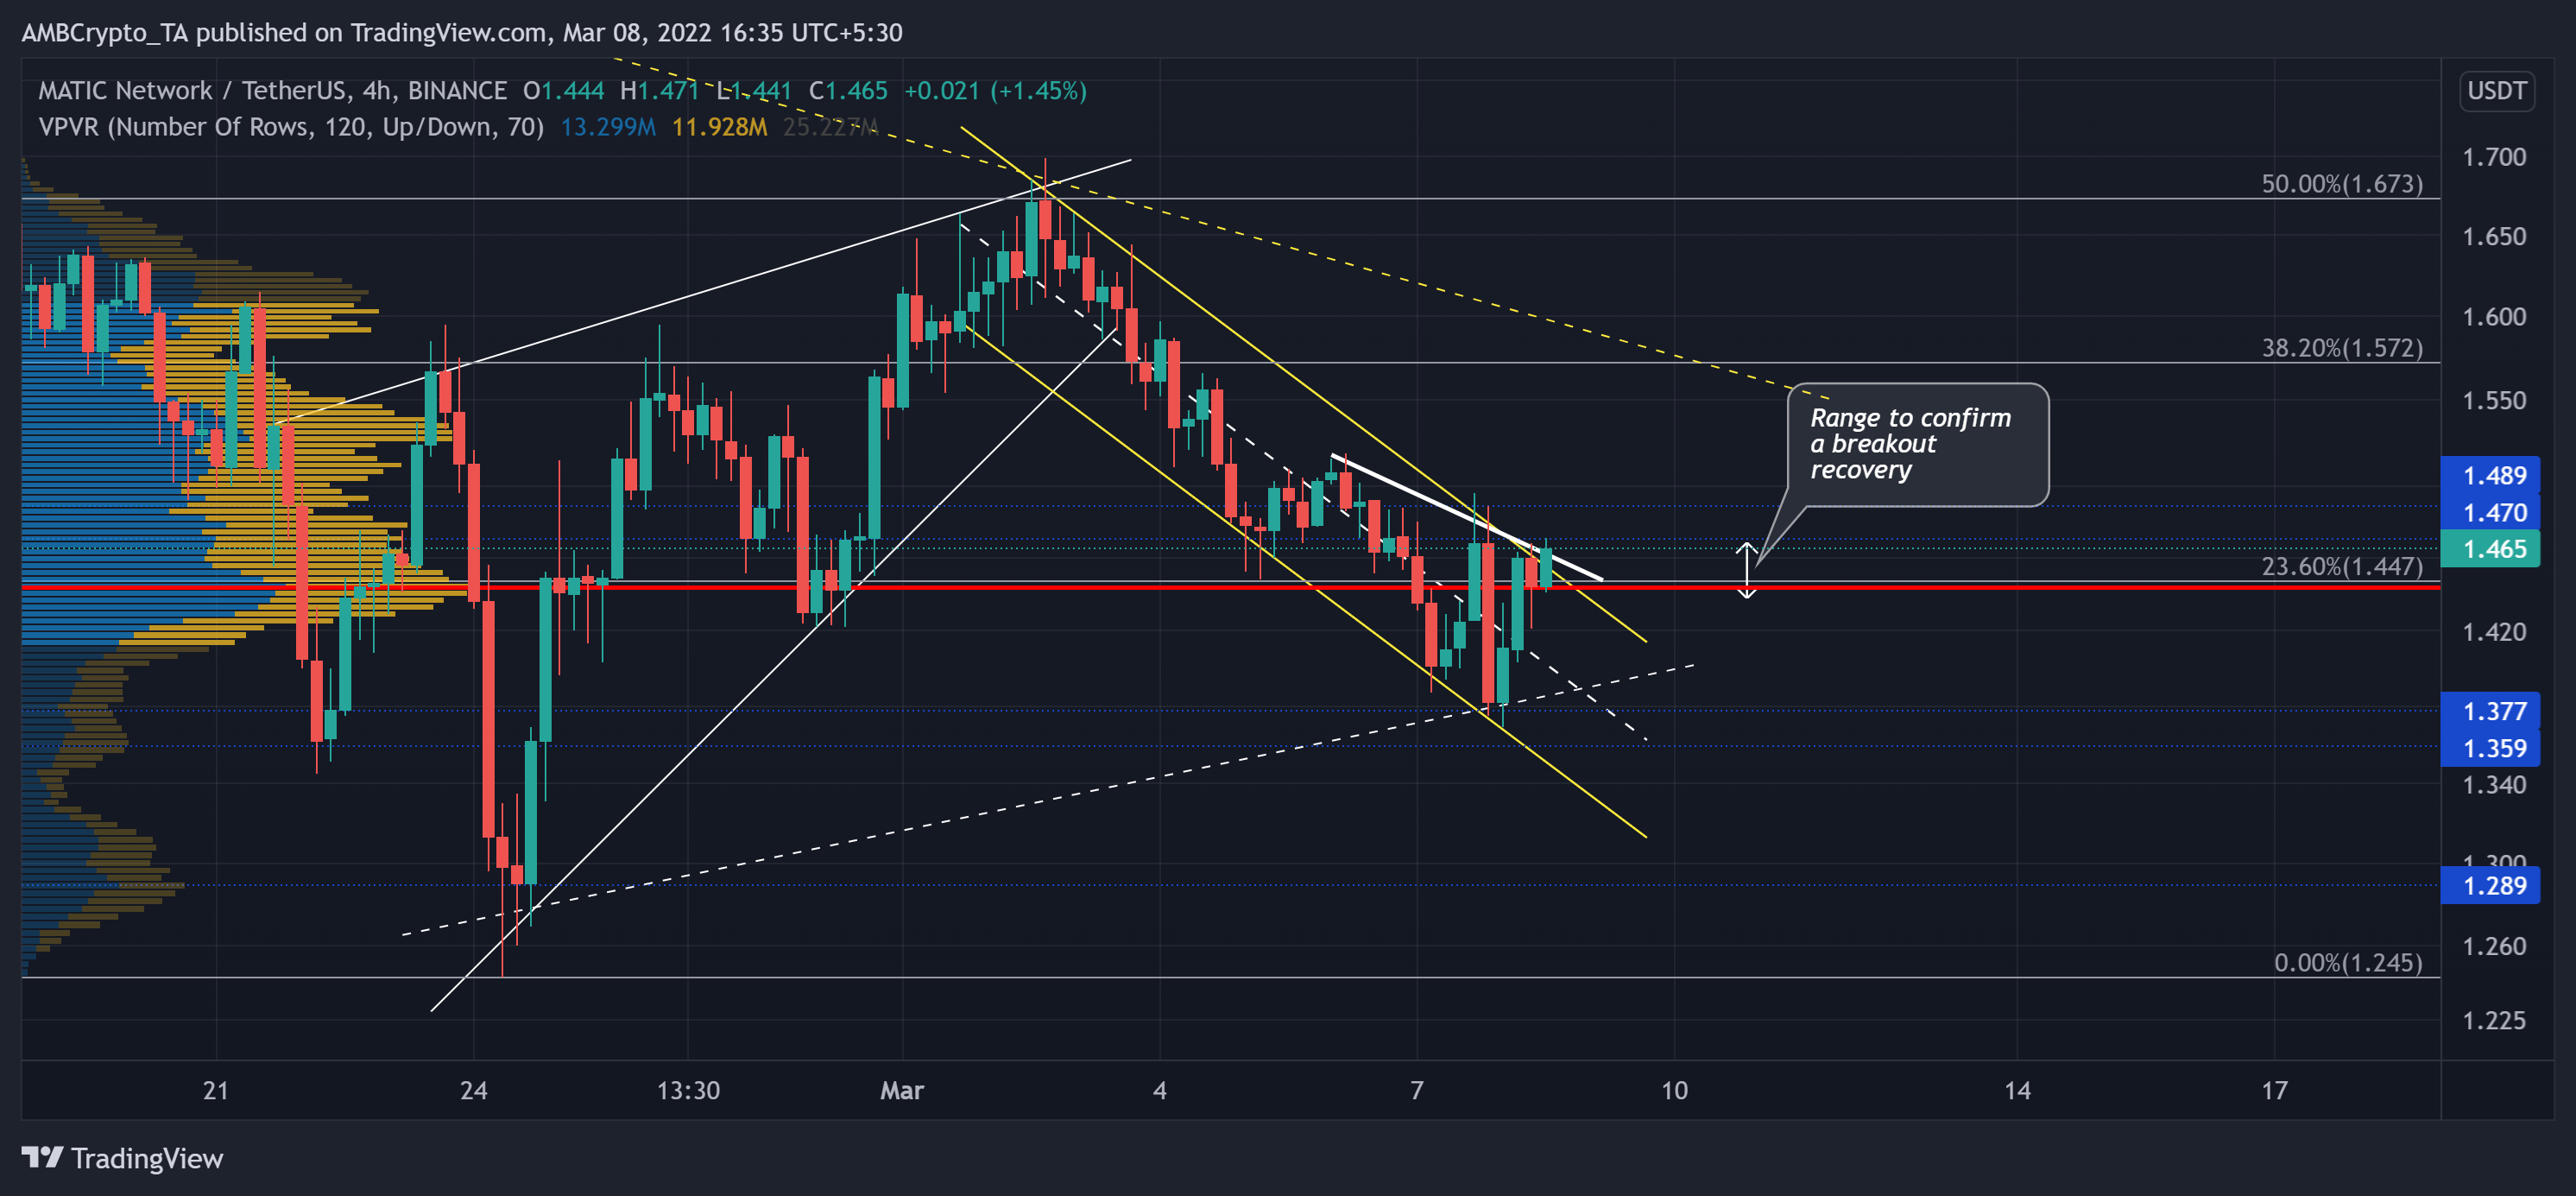
From its ATH of $2.92, MATIC fell to witness a 57.39% decline and hit its four-month low on 24 February. But the bulls stepped in at the $1.2-mark and propelled an upturn towards its trendline resistance (yellow, dashed). This resistance also coincided with the 50% Fibonacci level.
Following the same, the bears initiated a down-channel rally below its Point of Control (POC). As the $1.3-support stood sturdy, MATIC bulls initiated a strong recovery over the past 24 hours. At press time, they eyed an overturn of the existing pattern.
From here on, a convincing close above $1.47 would open up possibilities for a test of the 38.2% Fibonacci resistance. Overcoming its immediate trendline resistance is critical for an unrestrained near-term recovery. A close below the trendline resistance (white) could lead to a $1.3-retest before a bullish comeback.
Also, over the past few months, a close above this POC has led to recovery towards the $1.5-level. Can it repeat history?
Rationale
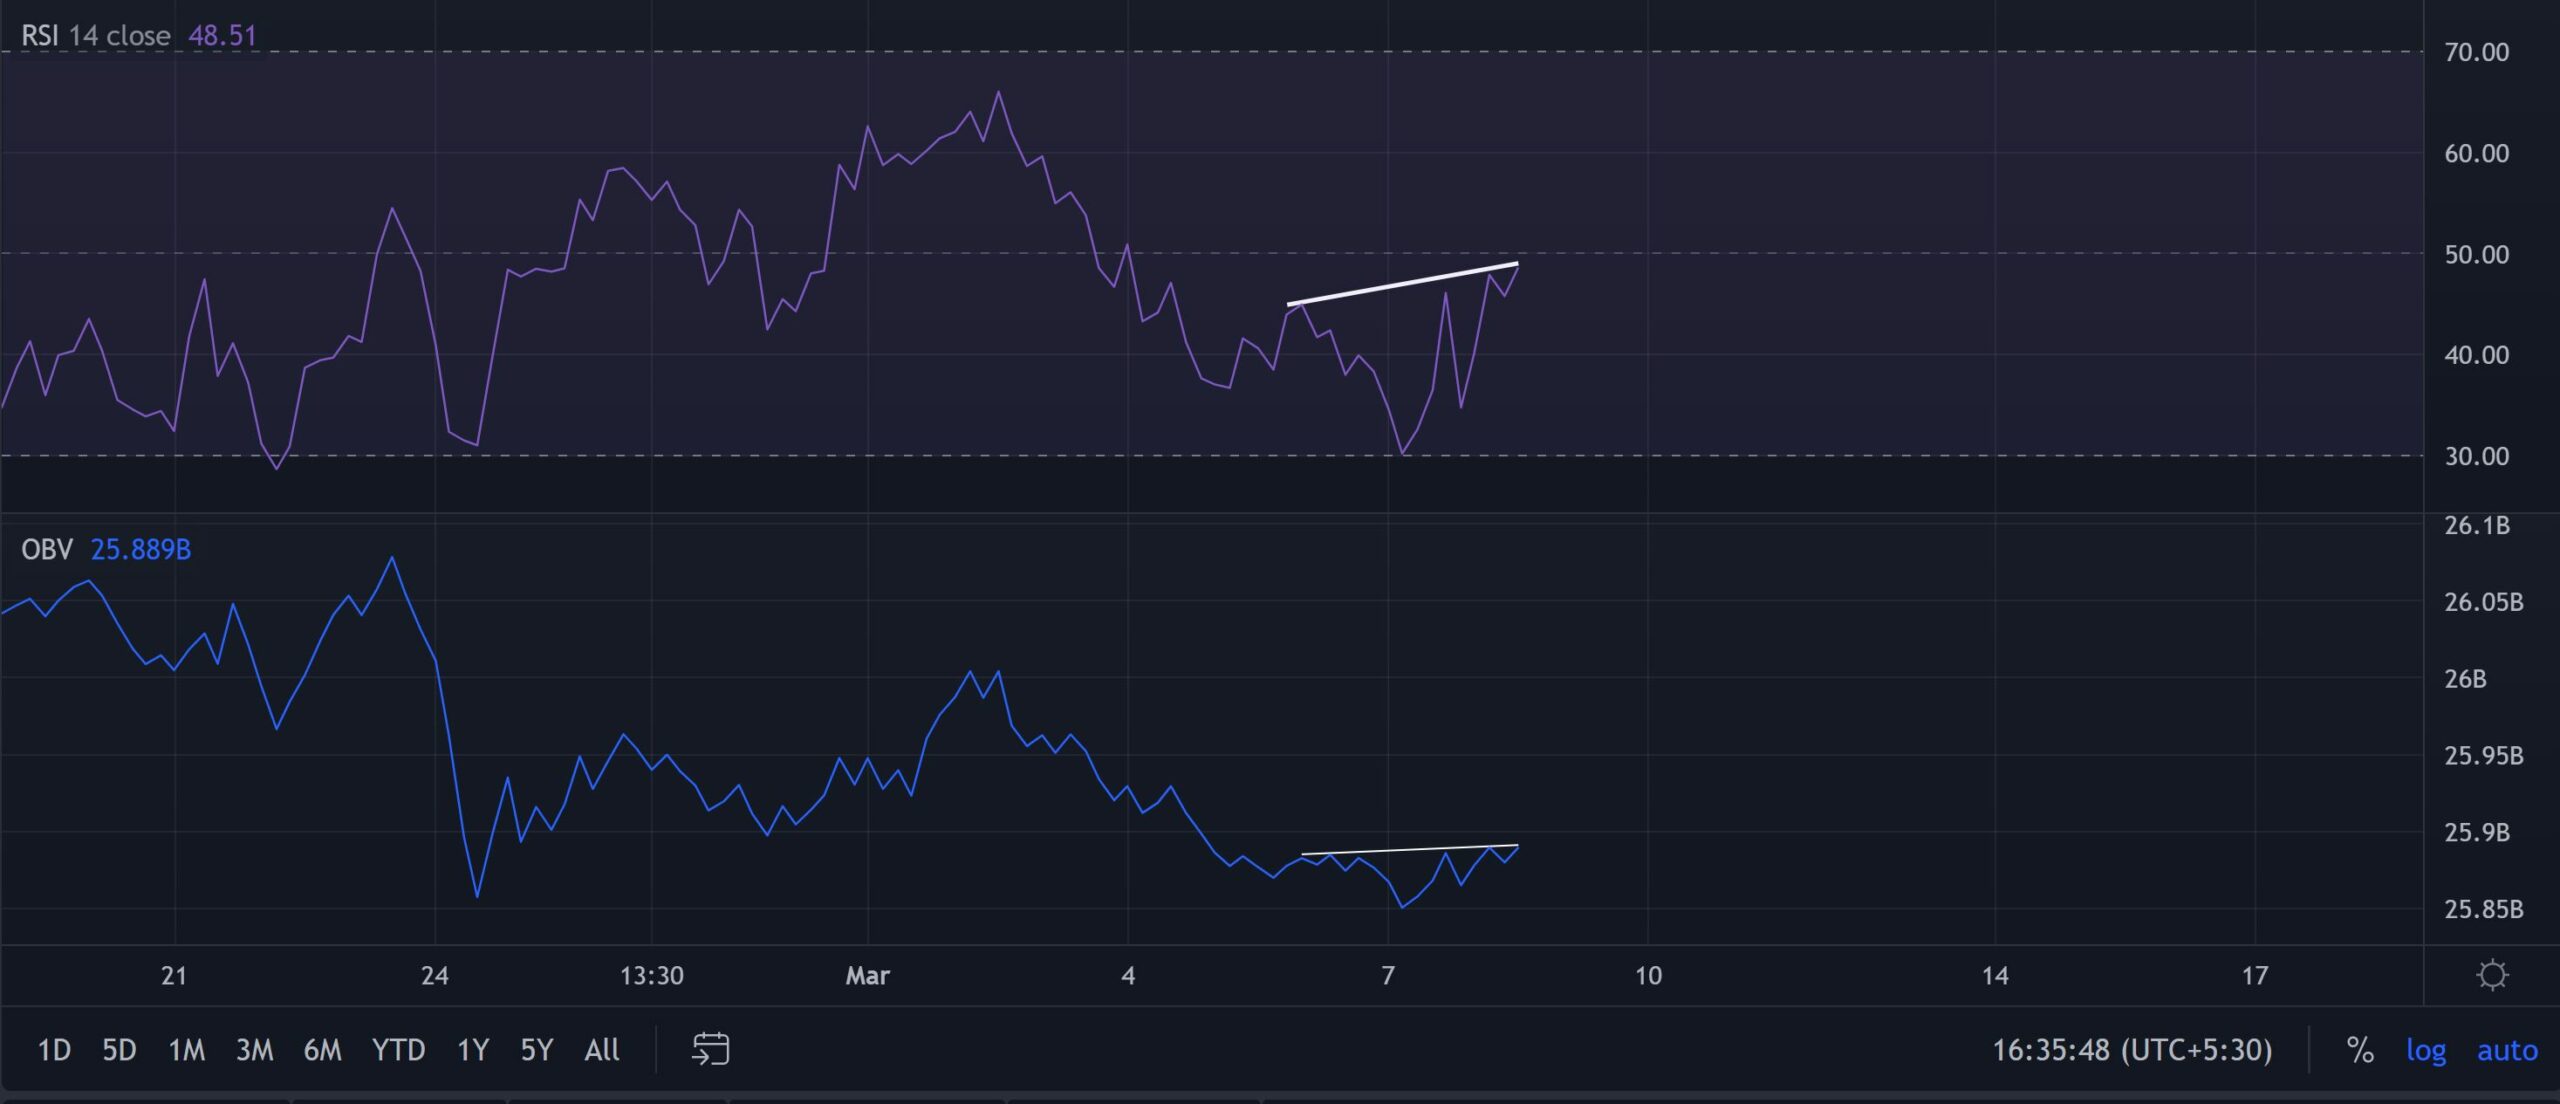
The RSI pictured impressive recovery from its oversold territory. Now, as it eyes a challenge of its equilibrium, a close below its resistance would affirm a hidden bearish divergence.
Also, the OBV has rather maintained its peaks while the price kept declining over the last two days. This would confirm the build-up of increasing buying influence.
Conclusion
Considering the uptrend in RSI and OBV, the chances of a recovery from this point remain bright. Even so, any close below the resistance would confirm the hidden bearish divergence.
The investors/traders must keep a close eye on Bitcoin’s movement as MATIC shares a whopping 90% 30-day correlation with the king coin.