XRP’s latest buying buildup – Can it achieve something?

Disclaimer: The findings of the following analysis are the sole opinions of the writer and should not be considered investment advice.
XRP bulls were seemingly keen on a revival from the January lows as they reclaimed their mark above the Point of Control (POC, red).
From here on, while the immediate trendline resistance (yellow) stood sturdy, a fall towards the $0.76-mark before a revival seemed likely. Following this, the bulls could try to capitalize on improved sentiment and continue the buying spree until reversing from the $0.8-zone. At press time, XRP traded at $0.7873, up by 2.11% in the last 24 hours.
XRP 4-hour chart

Since falling below its long-term Point of Control (red) at the $0.77-mark, XRP plunged to touch its six-month low on 22 January. Post that, the bulls stepped in to defend the 10-month $0.56-support.
Consequently, with a 67.4% revival since, XRP poked the $0.9-mark resistance. Since then, the alt gradually declined as it witnessed a trendline resistance (now support) (yellow, dashed) on its 4-hour chart. Over the last few days, XRP saw a rising wedge (white) that helped the alt find a close above its 20/50/200 EMA (green).
Any retracements from here would find testing grounds near the 50 EMA (cyan) that coincided with the POC. With the recent buying buildup, a possible recovery from the POC would be likely. In which case, XRP eyed to test the $0.8-zone before falling back to hit the lower trendline of the wedge.
Rationale
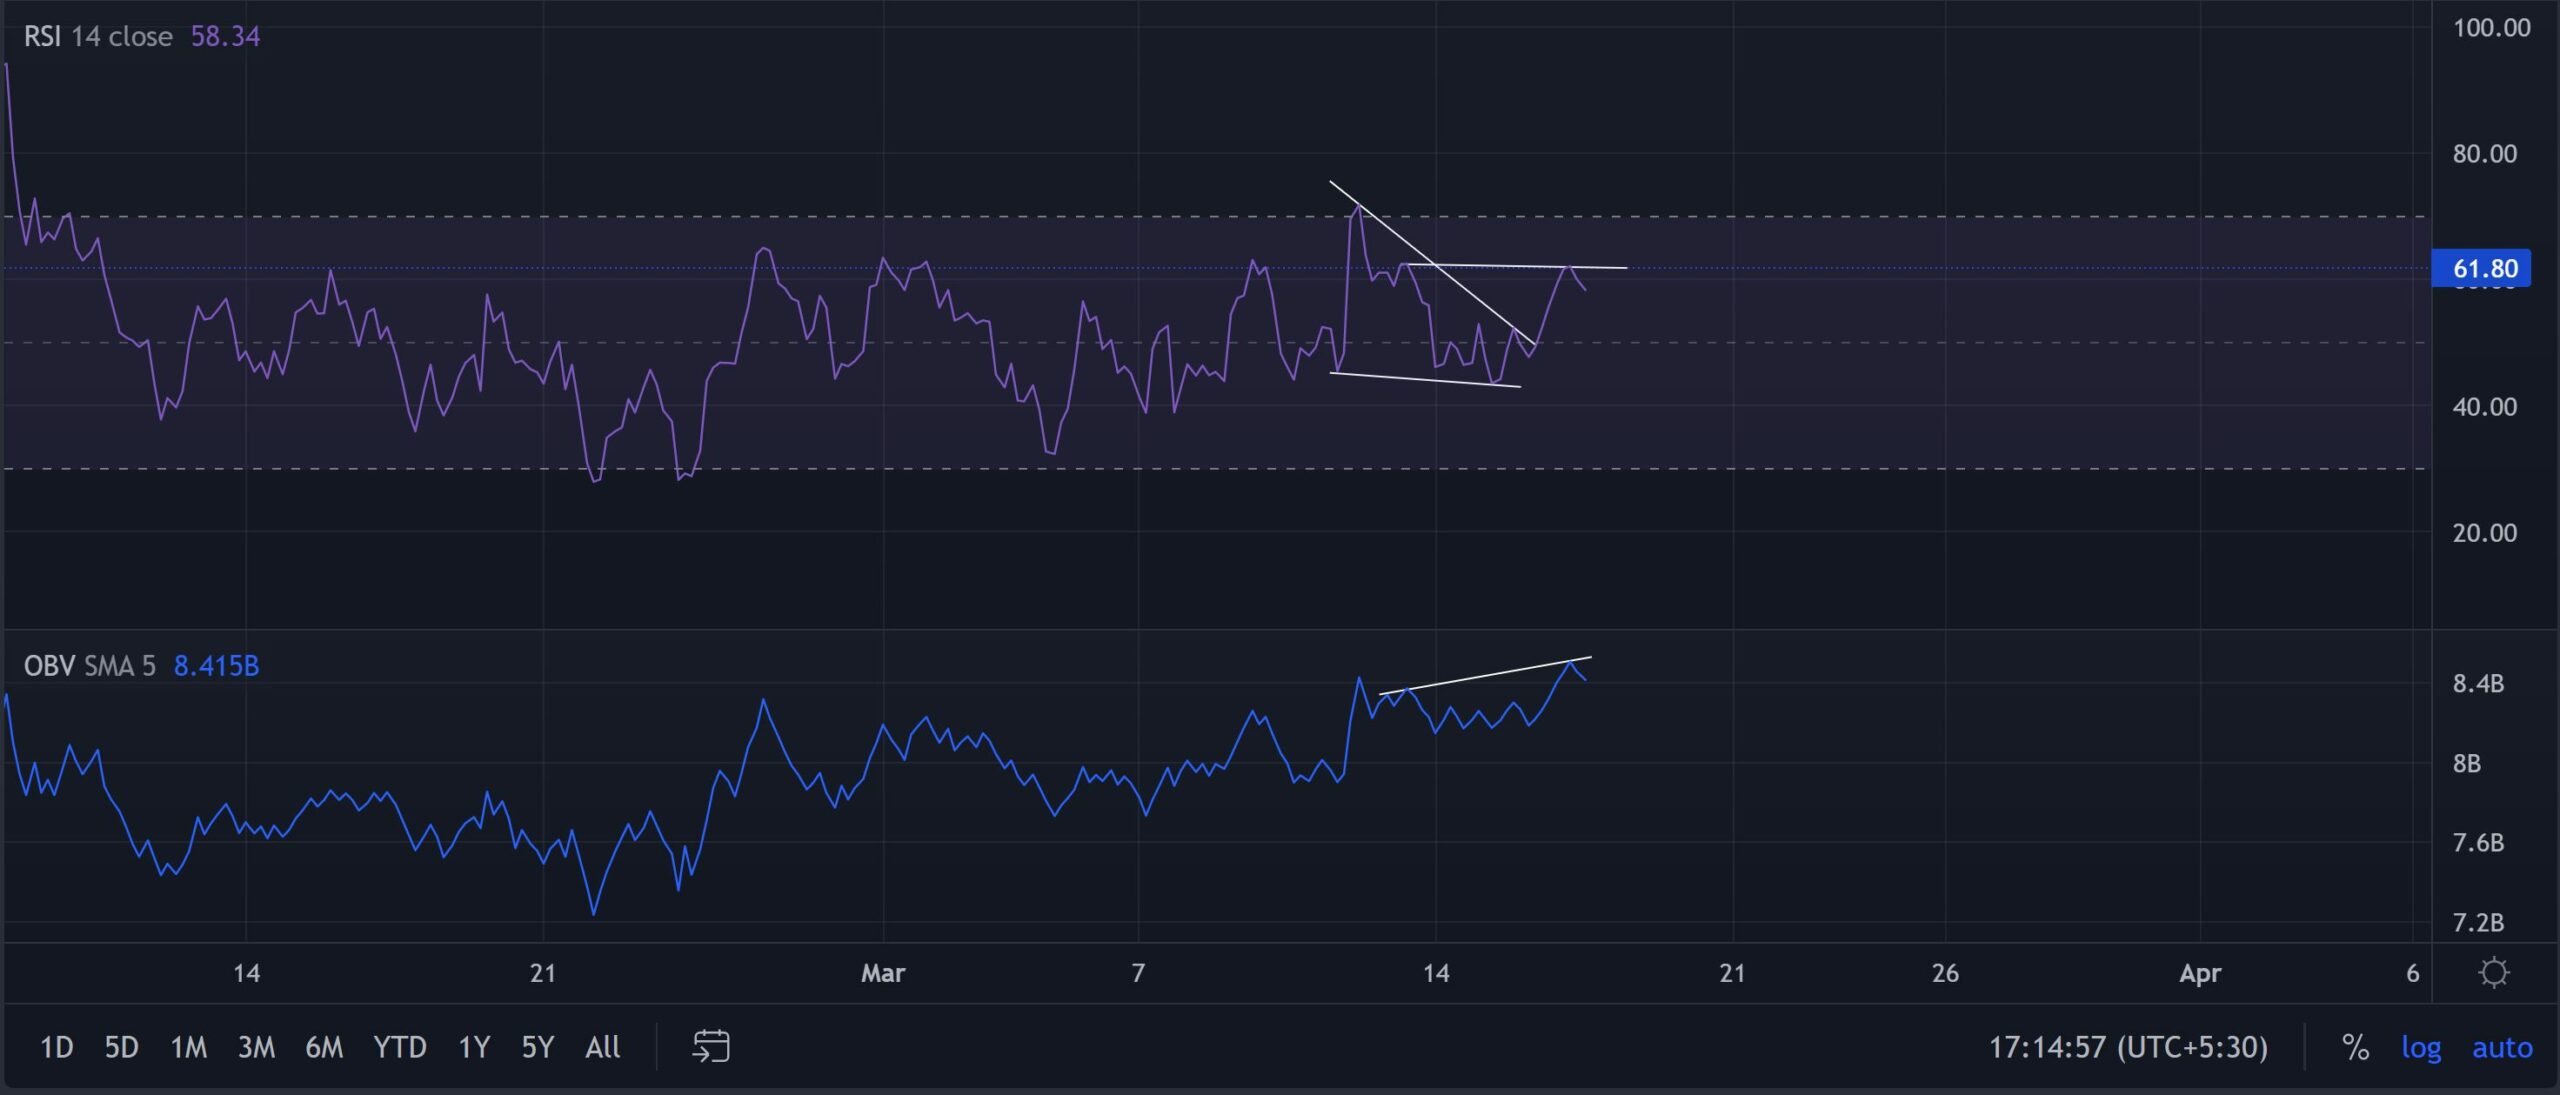
Since getting into the overbought region on 12 March, the RSI descended below the equilibrium in a falling wedge. Over the last day, it saw a patterned breakout that tested the 61-mark resistance. Over the last four days, the RSI maintained its resistance level, but the price marked lower peaks. Thus, revealing a hidden bearish divergence.
Furthermore, the OBV also diverged with price while reaffirming the hidden bearish tendencies. So a near-term pullback towards the POC before a lift-off could be conceivable.
Conclusion
Considering the divergences on its RSI and OBV, a short-term pullback towards the 50 EMA seemed likely before the bulls gather thrust to enter the $0.8-zone. Even so, keeping an eye on Bitcoin’s movement and the broader sentiment would be important to complement the aforementioned analysis.


