Polkadot: Here’s the full scope of the roadblocks to DOT’s gains

Polkadot’s price, at press time, was picturing a slowdown of momentum and the likelihood of a reversal. The timing here is interesting, especially since Bitcoin also seemed to be hinting at a potential retracement. Therefore, investors need to exercise caution and be aware of a sudden downswing.
A confluence of bearish signals
Polkadot’s price has rallied by 47% since 24 February, setting a swing high of $20.74. While impressive, this move has stopped prematurely since a significant resistance barrier is present at $22.46. Moreover, the price action since 8 February has created lower highs, suggesting that the uptrend has not begun yet.
Therefore, investors need to remain cautious and be on the lookout for a sudden correction. $15.83 is a suitable support level that is likely to absorb the selling pressure, allowing sidelined buyers to accumulate DOT at a discounted price.
Supporting this outlook for Polkadot’s price is the Relative Strength Index (RSI). This has produced a higher high relative to the swing highs produced by DOT on 8 February and 22 March. If observed, this technical formation is known as a bearish divergence and forecasts a change in trend for the asset.
Hence, the bearish outlook has more momentum with this new signal, hinting that a pullback might be plausible for Polkadot’s price.

No hope? Really?
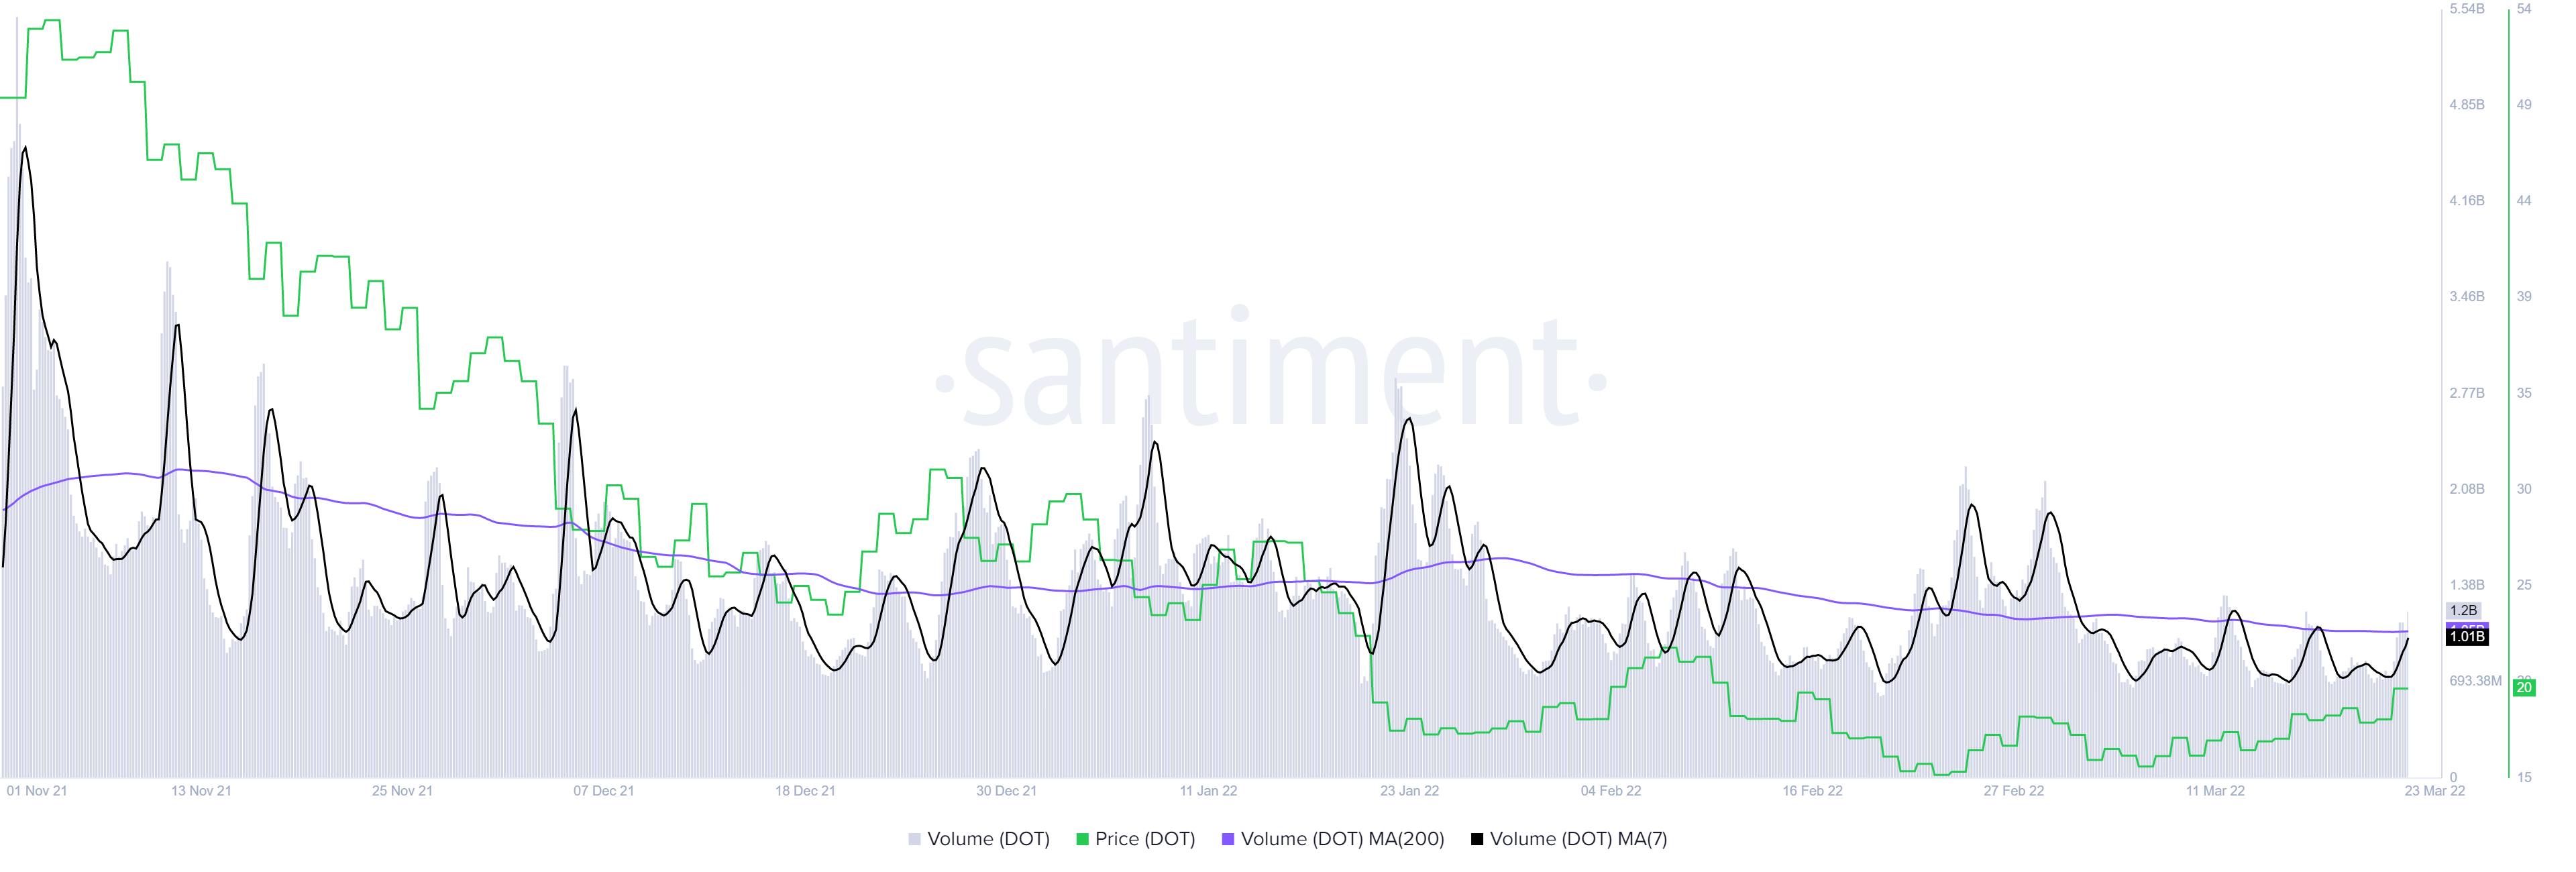
In addition to the bearish outlook from a technical perspective is the on-chain volume for Polkadot. It does not seem to be doing well either as it was hovering around 1.2 billion DOT – Well below the 200-day Moving Average (MA).
To make matters worse, the 7-day MA is also hovering below the 200-day MA, indicating the lack of interest among participants interacting with Polkadot’s blockchain. This state of investor activity shows that an uptrend for DOT is not only unlikely, but a retracement seems to be in the works.
All in all, the outlook for DOT’s price does not seem to be suggesting anything bullish from both the technical and on-chain perspectives. On the contrary, it looked bearish and suggested that DOT might undo some of the gains seen over the past month.
A daily candlestick close below $15.83 will invalidate the bullish thesis for DOT’s bulls. This development could also potentially trigger a steep correction that could cause Polkadot’s price to nosedive to July 21’s swing low of $10.36. This is a level where long-term investors might rush to accumulate, giving the bullish outlook another go.


