Terra, Chainlink, Ethereum Classic Price Analysis: 28 March
The crypto fear and greed index finally entered the ‘greed’ zone after over four months. Hence, Chainlink saw a jump above its 20/50/200 EMA while depicting an overbought position on its near-term technicals.
Also, Ethereum Classic poked its four-month high on 28 March while its bulls needed to ensure the RSI equilibrium support. Moreover, Terra revealed a bullish edge after ensuring its 23.6% Fibonacci support.
Terra (LUNA)

After reversing from its long-term resistance at the $101-mark, LUNA lost over 57% of its value. Consequently, it plunged towards its two-month low on 31 January. This level coincided with the 61.8% Fibonacci support. Thus, the bulls could gather enough force to propel a rally above the $90-zone.
After more than doubling its value from the February lows, LUNA continued its gradual upturn after marking bullish trendline support (white, dashed). A pullback from here would continue to find testing support at the above support followed by the 23.6% level.
At press time, LUNA was trading at $94.38. The bullish RSI hovered above the midline after facing resistance at the 66-mark. After a hidden bearish divergence (white), it showed slowing signs as it attempted to test the 58-level. Also, the CMF revealed a bullish edge after jumping above the zero-line.
Chainlink (LINK)
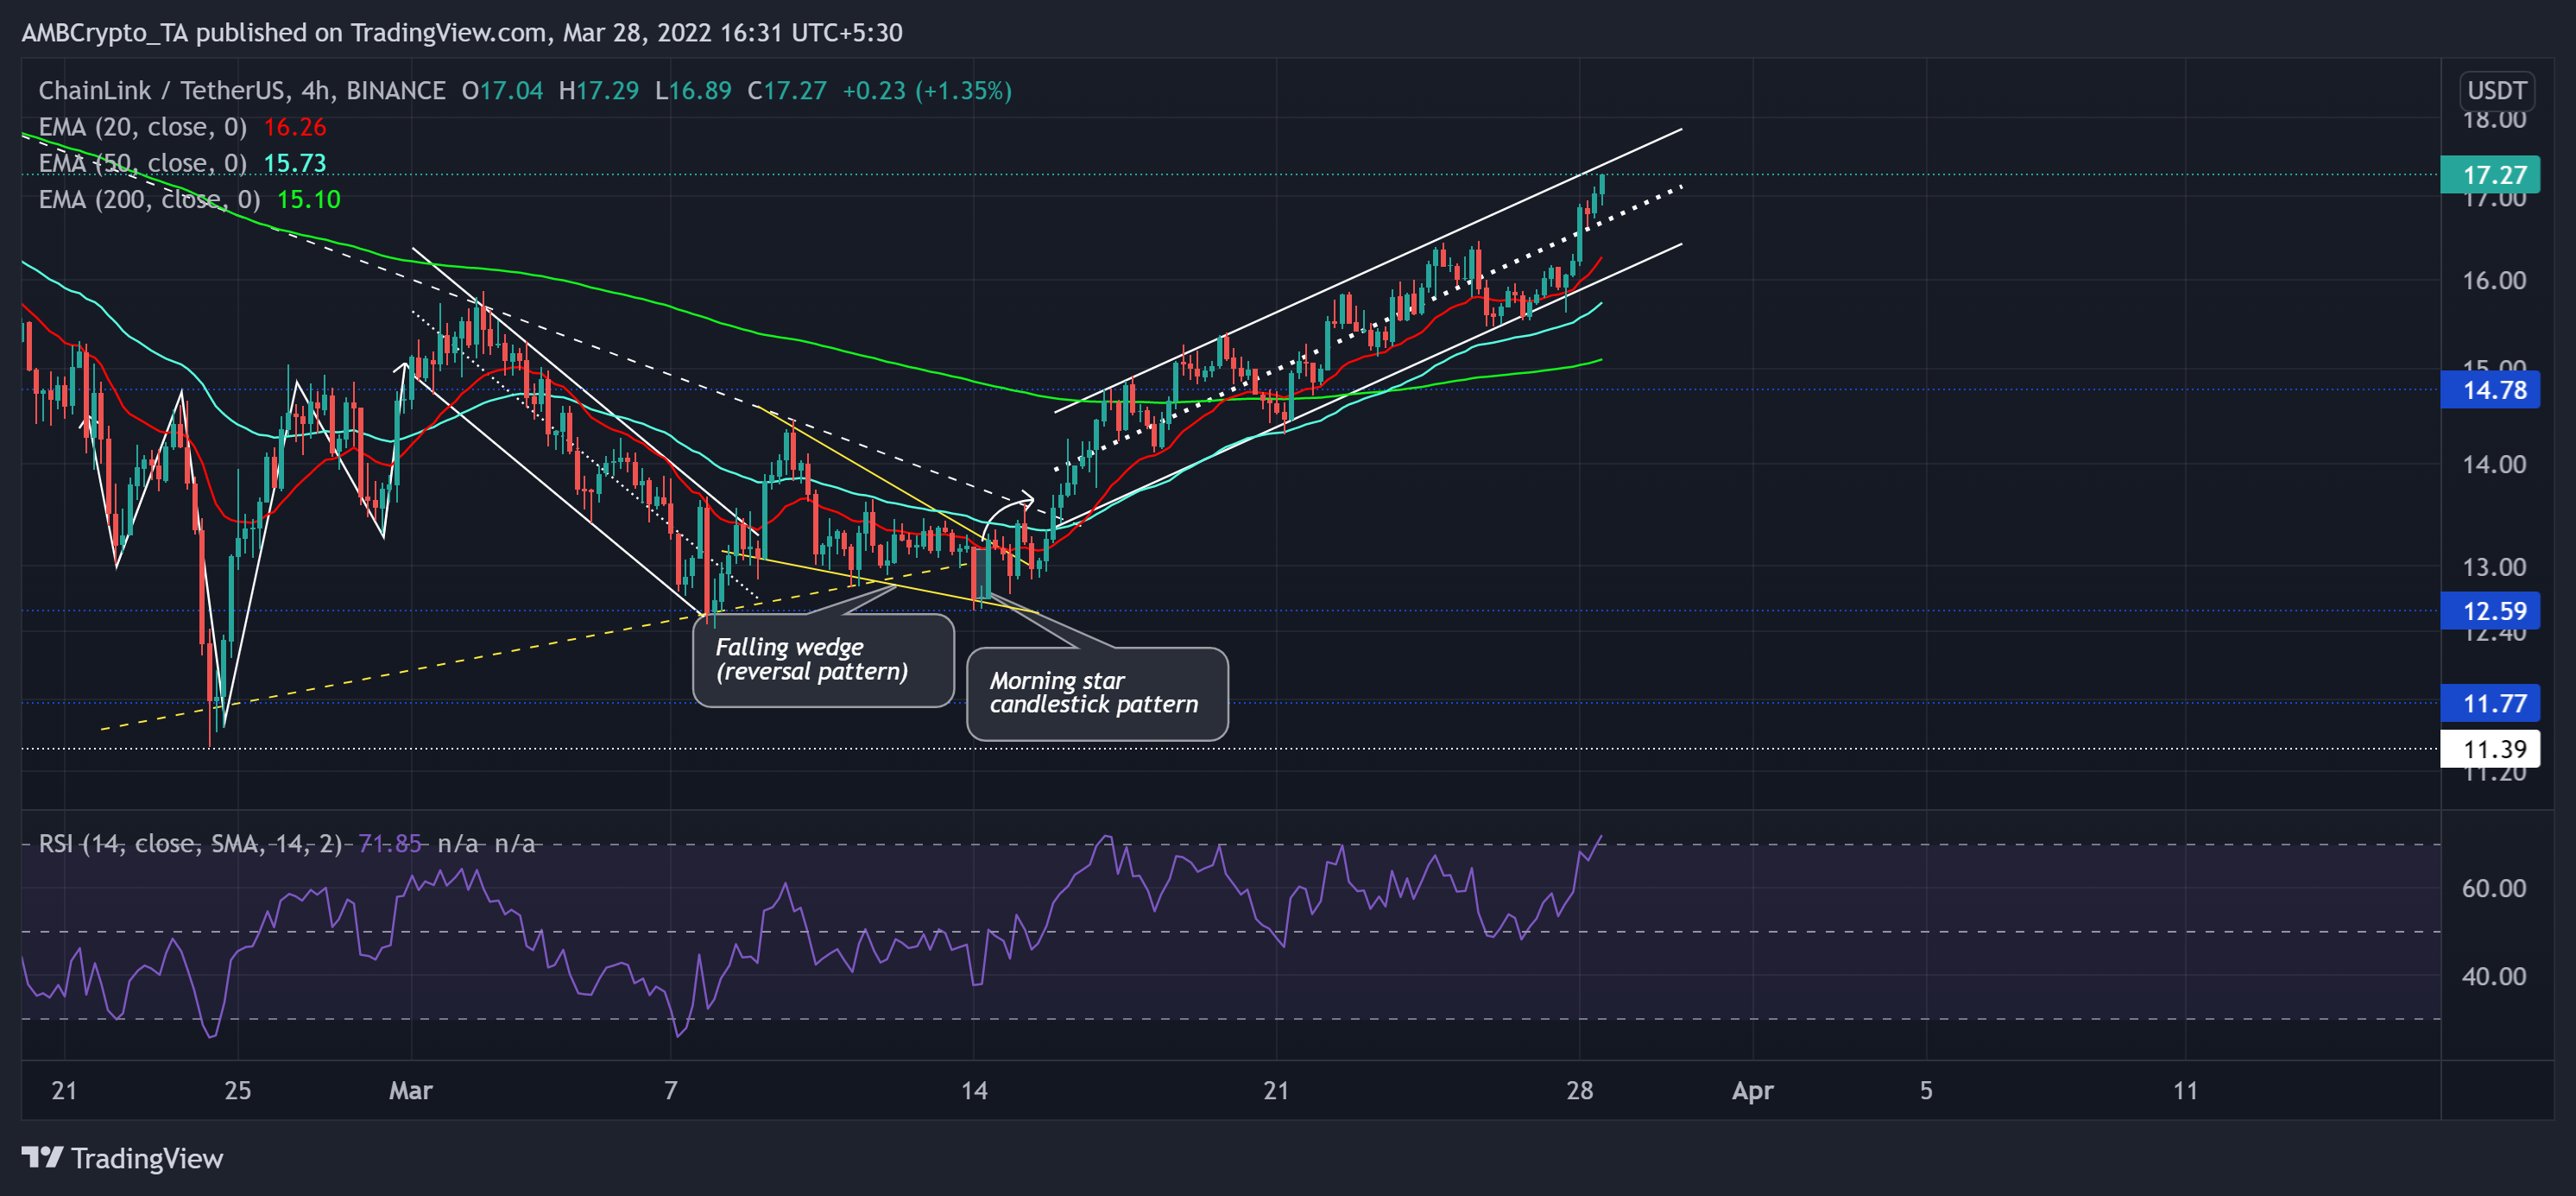
The selling pressure heightened after the bulls lost the $25.75-level. As a result, the LINK plunged to hit its 14-month low on 24 January. However, the bulls finally showed up at the $11.3-mark as the alt recorded over 50% gains since then.
After witnessing a morning star candlestick pattern on its 4-hour chart, LINK entered into a price discovery to push the value above the 20/50/200 EMA. Also, with the 20 EMA still looking north, the bulls had control in their hands.
At press time, the LINK traded at $17.27. After testing the midline support multiple times, the RSI set its foot in the overbought region. A possible reversal from this zone could be conceivable in the near term.
Ethereum Classic (ETC)
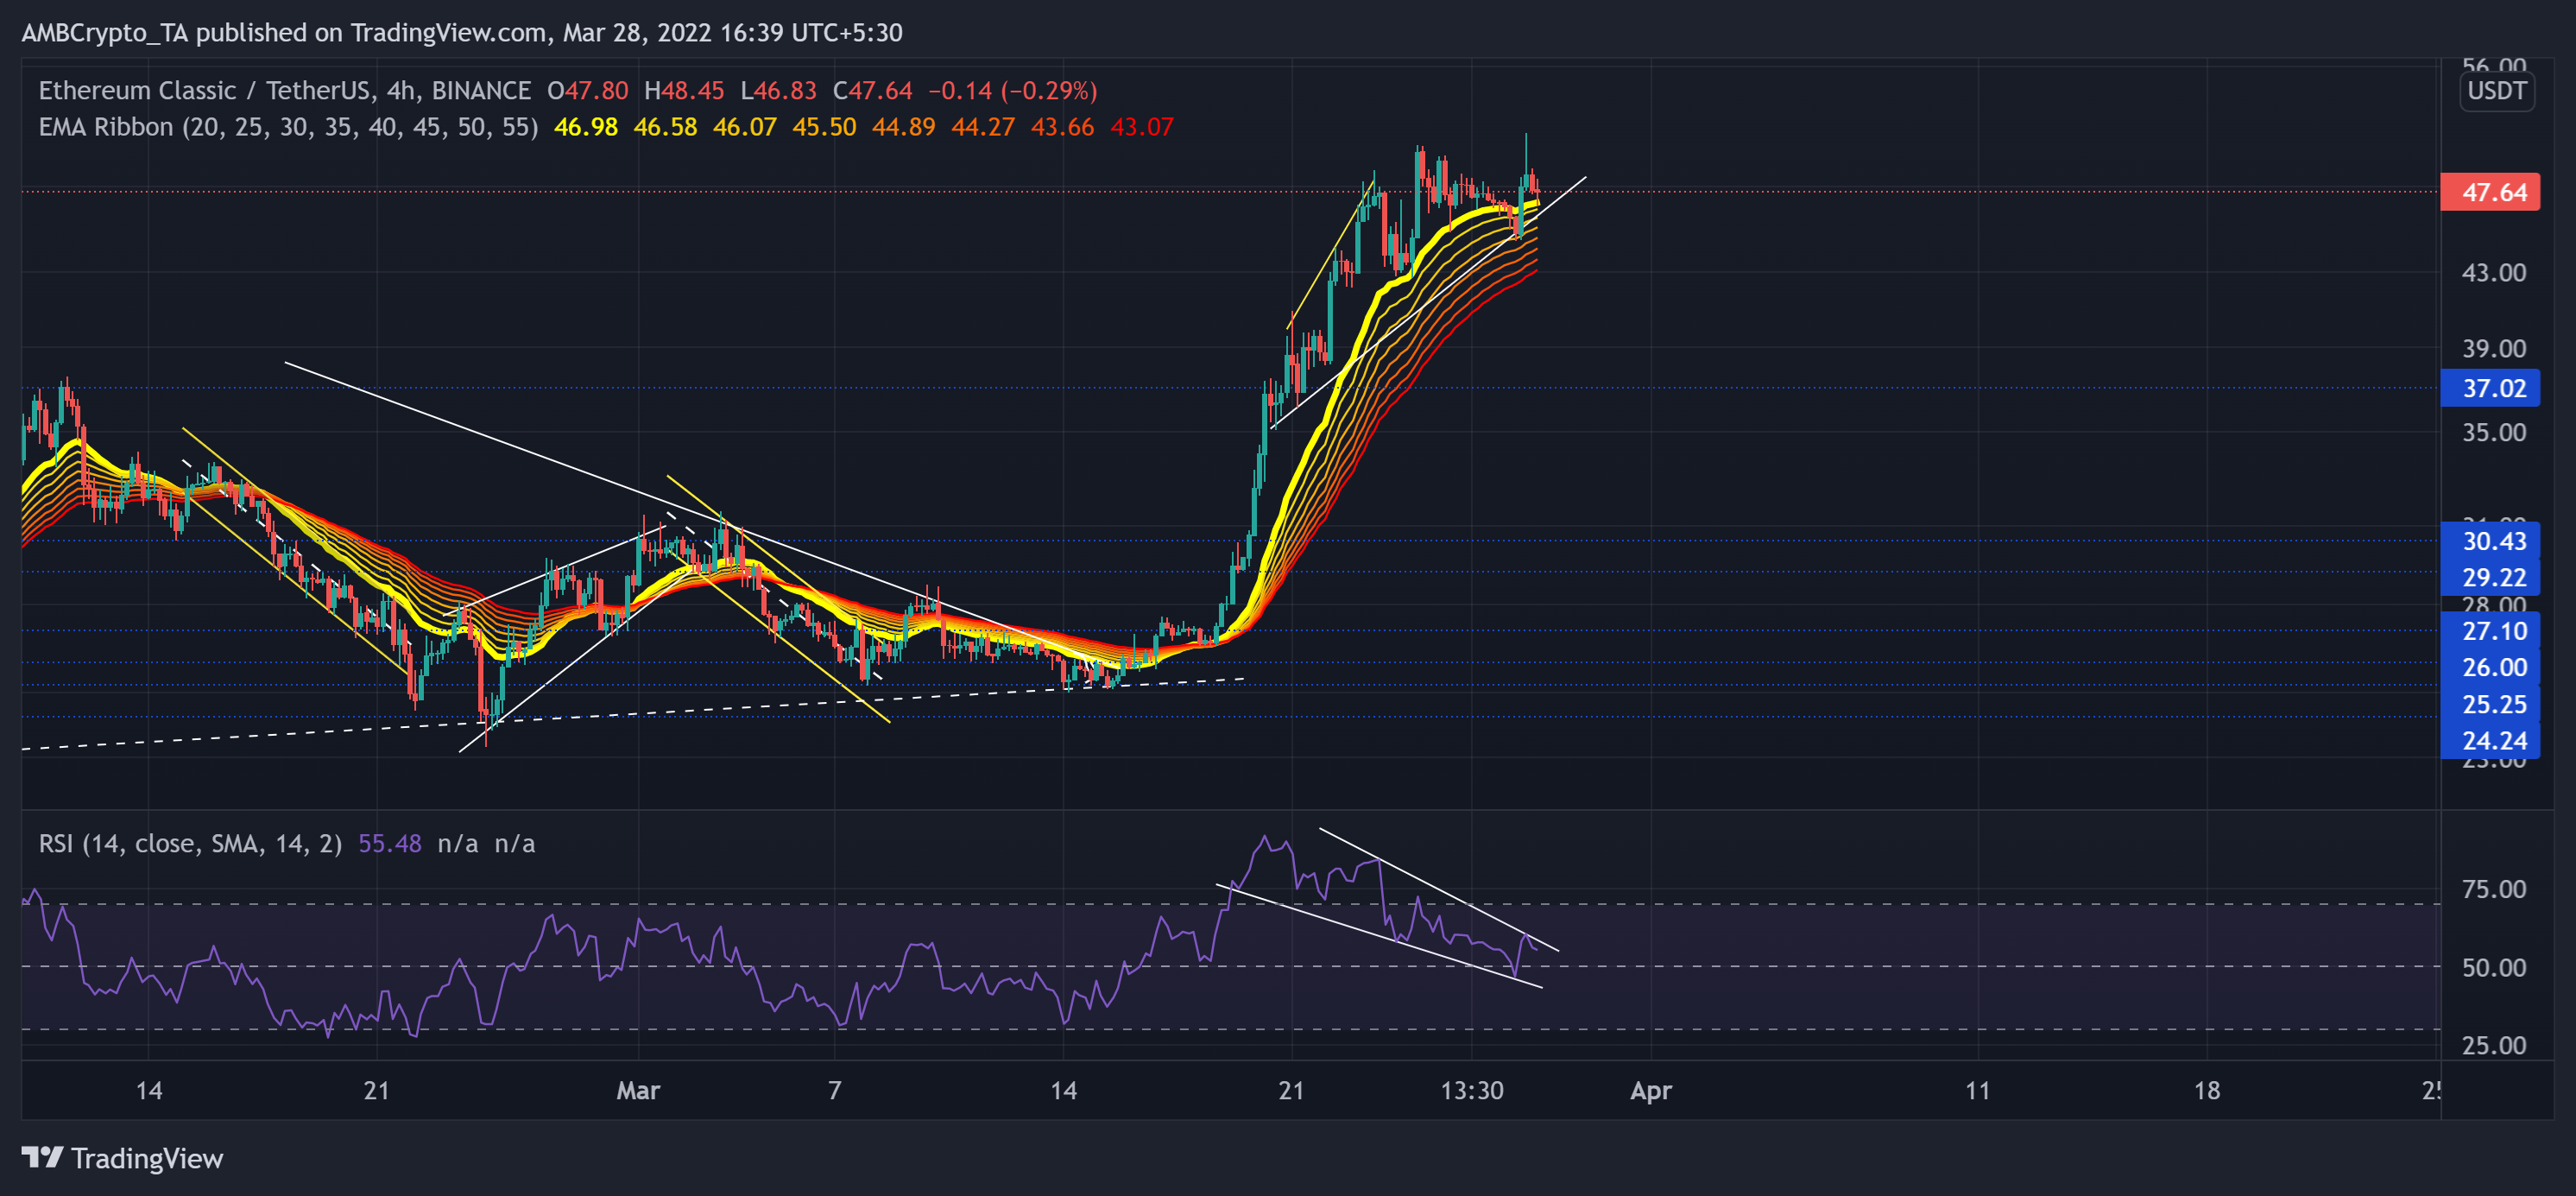
ETC lost more than a third of its value (from its 11 February high) and touched its one-month low on 24 February. Since then, the altcoin has been on a roll as it saw a staggering 87.9% ROI in just the past 11 days.
After entering into reclaiming the $37-mark, ETC jumped above its EMA ribbons and flashed a one-sided bullish momentum. Consequently, it touched its four-month high on 28 March.
At press time, ETC traded at $47.64. The RSI was on a downtrend as it declined between a falling wedge. The bulls needed to ensure the midline support to cause a possible breakout of the reversal pattern and avoid a further fallout.