Why SAND still holds promise despite a reversal playing out on the charts

For over seven weeks, SAND found an oscillating range between the $2.7 and $4.8-mark. Thus, the bulls propelled a strong recovery from the $2.7 base level while marking a rising wedge on its 4-hour chart.
From here on, the bulls could steer the price to test the $3.6 mark before facing some resistance at that level. A close below this level could cause a test of the $3.5-zone before the bulls would try to snap the resistance. At press time, SAND traded at $3.5707.
SAND 4-hour chart
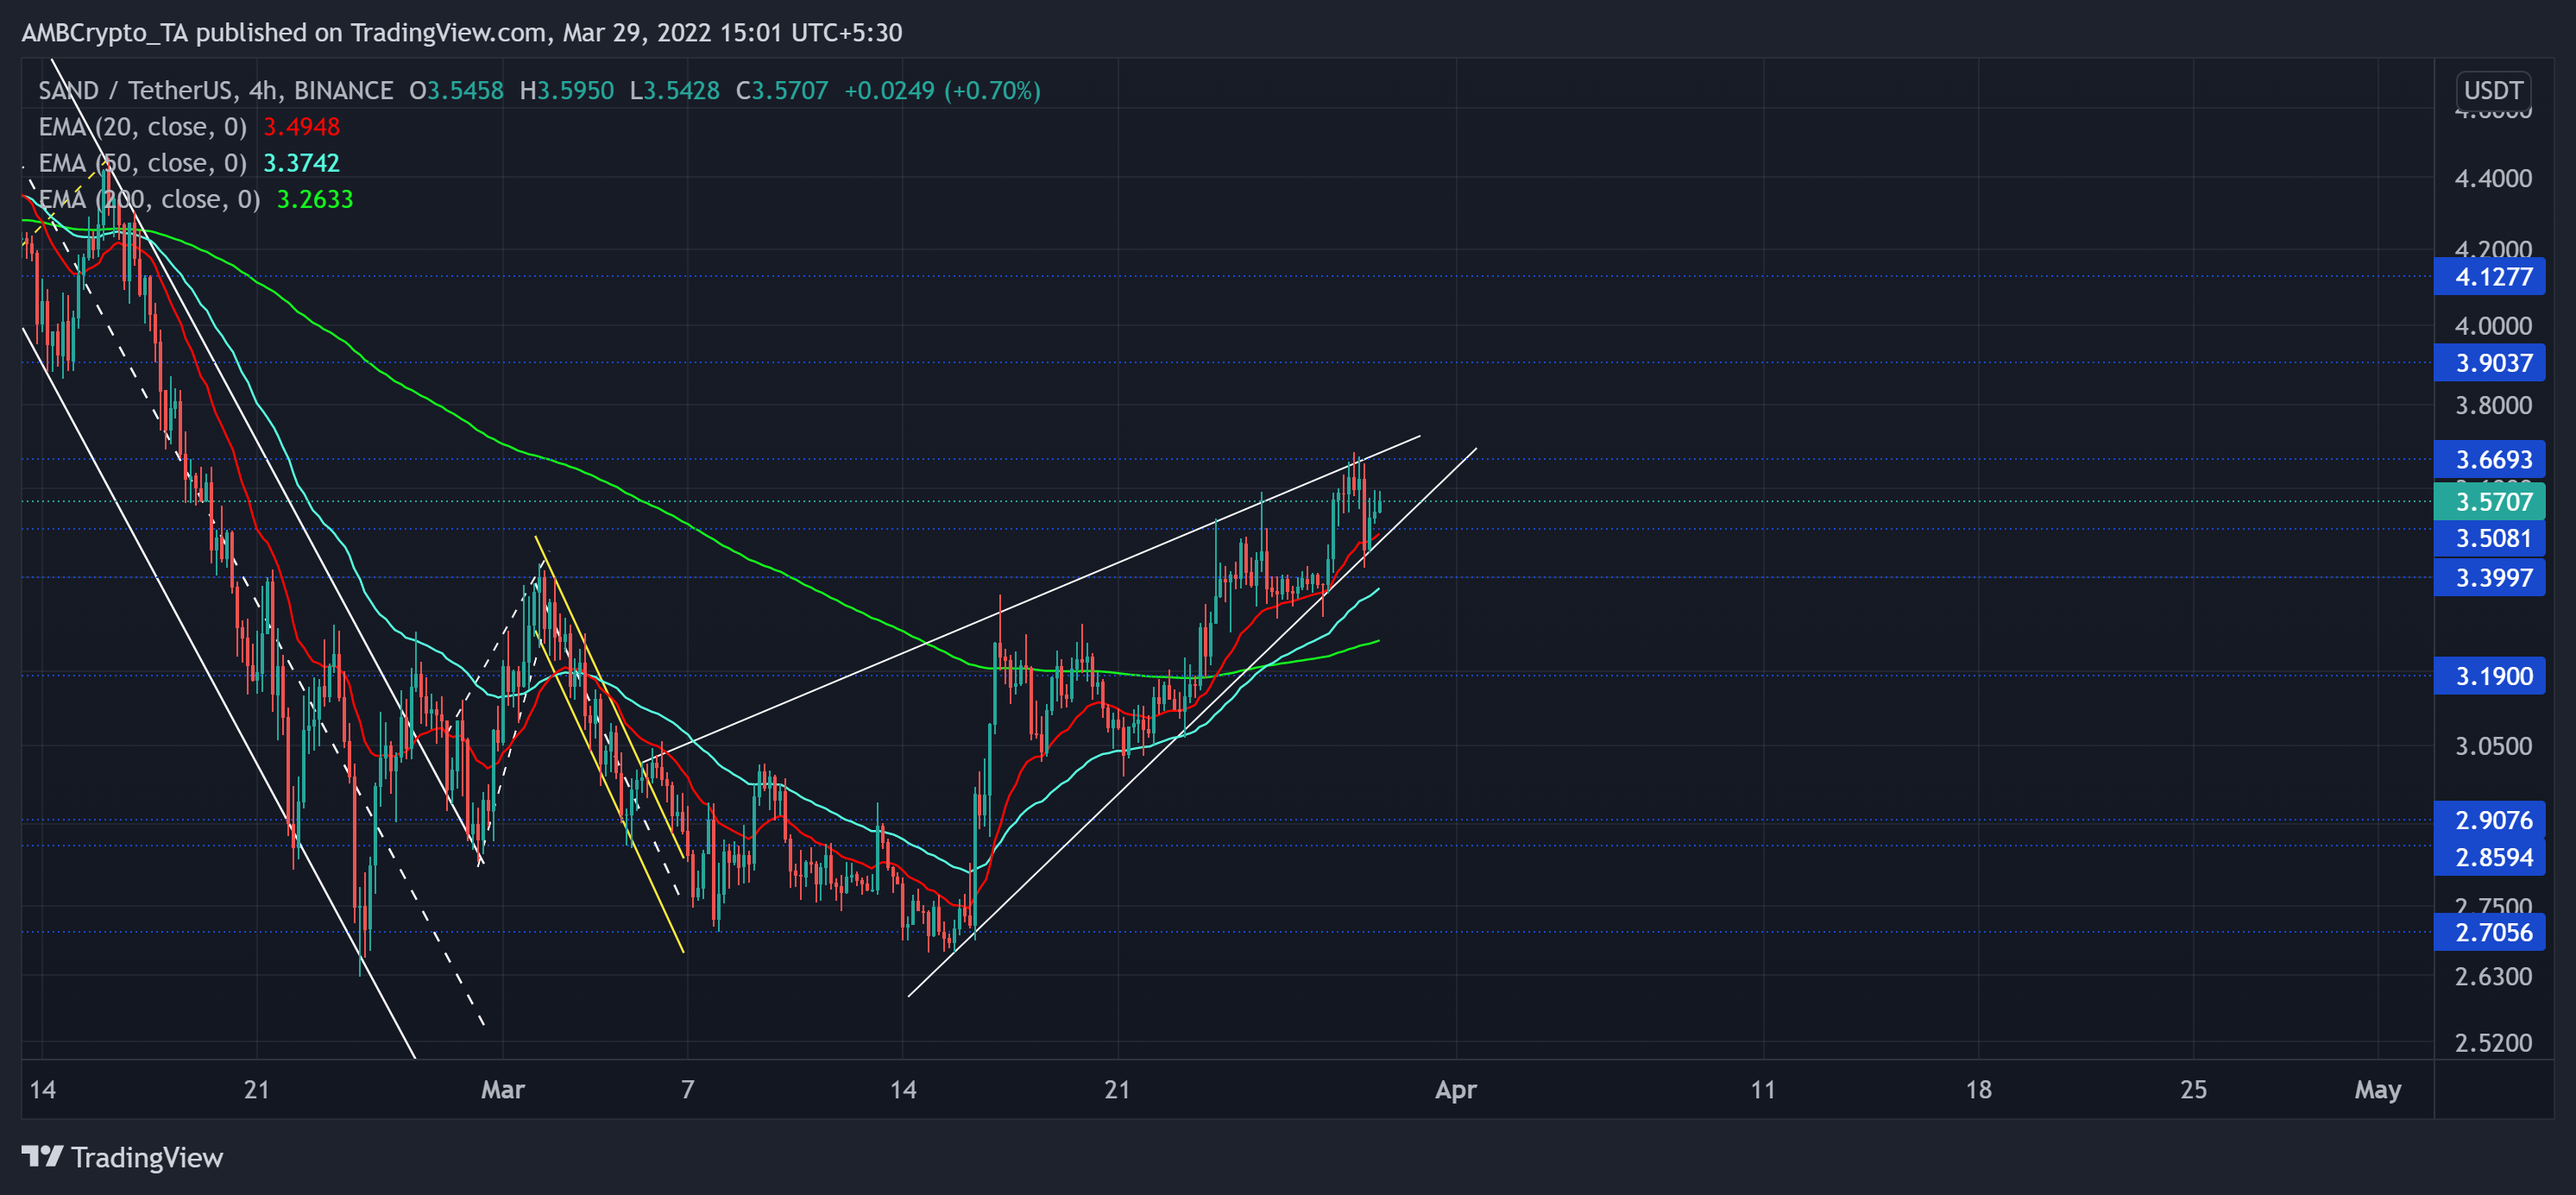
The previous uptrend saw exceptional gains as the altcoin touched the $4.8-resistance. However, as the bears turned the tide in their favor, they propelled a steep downturn towards its long-term $2.7-$2.8 support range.
Meanwhile, SAND noted a 45.7% decline (from 9 February) as it fell towards its one-month low on 24 February. Since then, SAND broke out of its down-channel but struggled to find a strong rally until last week. The alt saw a 34.2% ROI over the last two weeks as it closed above its 20/50/200 EMA.
Now, the current buying spree would help SAND to test the $3.6-mark resistance. As the bears have defended it for more than a month, a possible reversal from there could propel a test of its 20 EMA (red). Any fall below that would affirm a trend reversal. Finally, a close above the $3.6-mark would open up recovery gates towards the $3.9-$4 zone.
Rationale
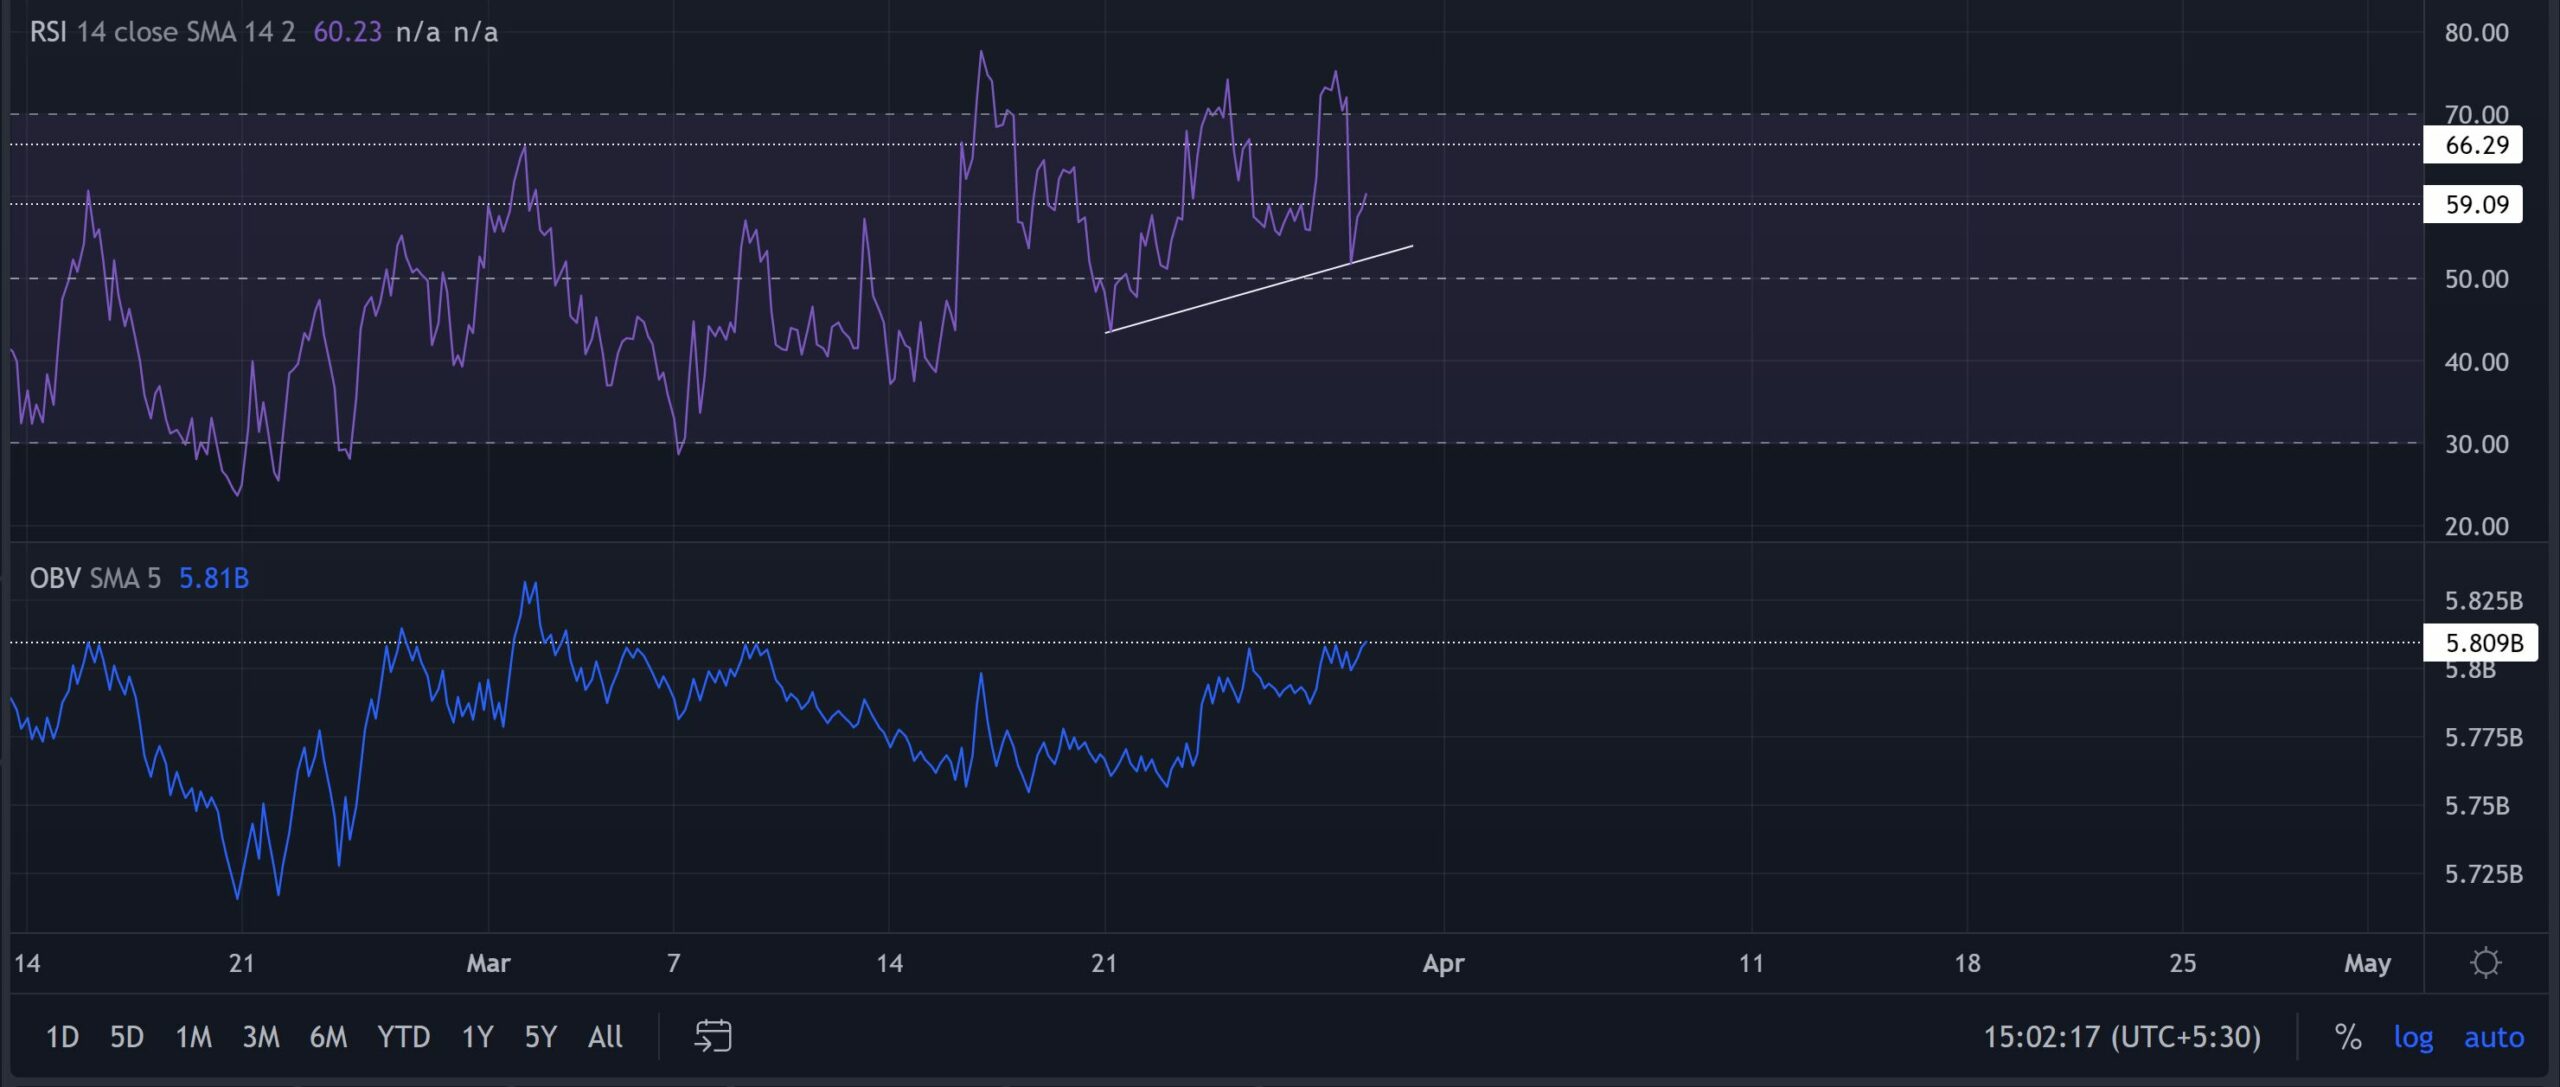
After an impressive recovery, the RSI positioned itself above the equilibrium and favored the buyers. The recent close above the 59 mark has set it up for a likely test of the 66-level. A reversal from that level could see a short-term setback for SAND before the continued upturn.
Also, recently the price action marked higher peaks while the OBV maintained its current resistance point. This reading kept the possibilities of a pullback alive.
Conclusion
Considering the reversal pattern and the flatter OBV peaks, a possible setback towards the $3.4 zone could be likely. But with the 50 EMA jumping above 200 EMA, SAND could continue its up-rally. And gradually aim to step its foot in the $4-mark in the days to come.
Moreover, the alt shares a staggering 80% 30-day correlation with the king coin. Hence, keeping an eye on Bitcoin’s movement would be vital to complement these technical factors.


