Zilliqa: Consolidation or a short term downside, here’s what the charts say

Disclaimer: The findings of the following analysis are the sole opinions of the writer and should not be considered investment advice
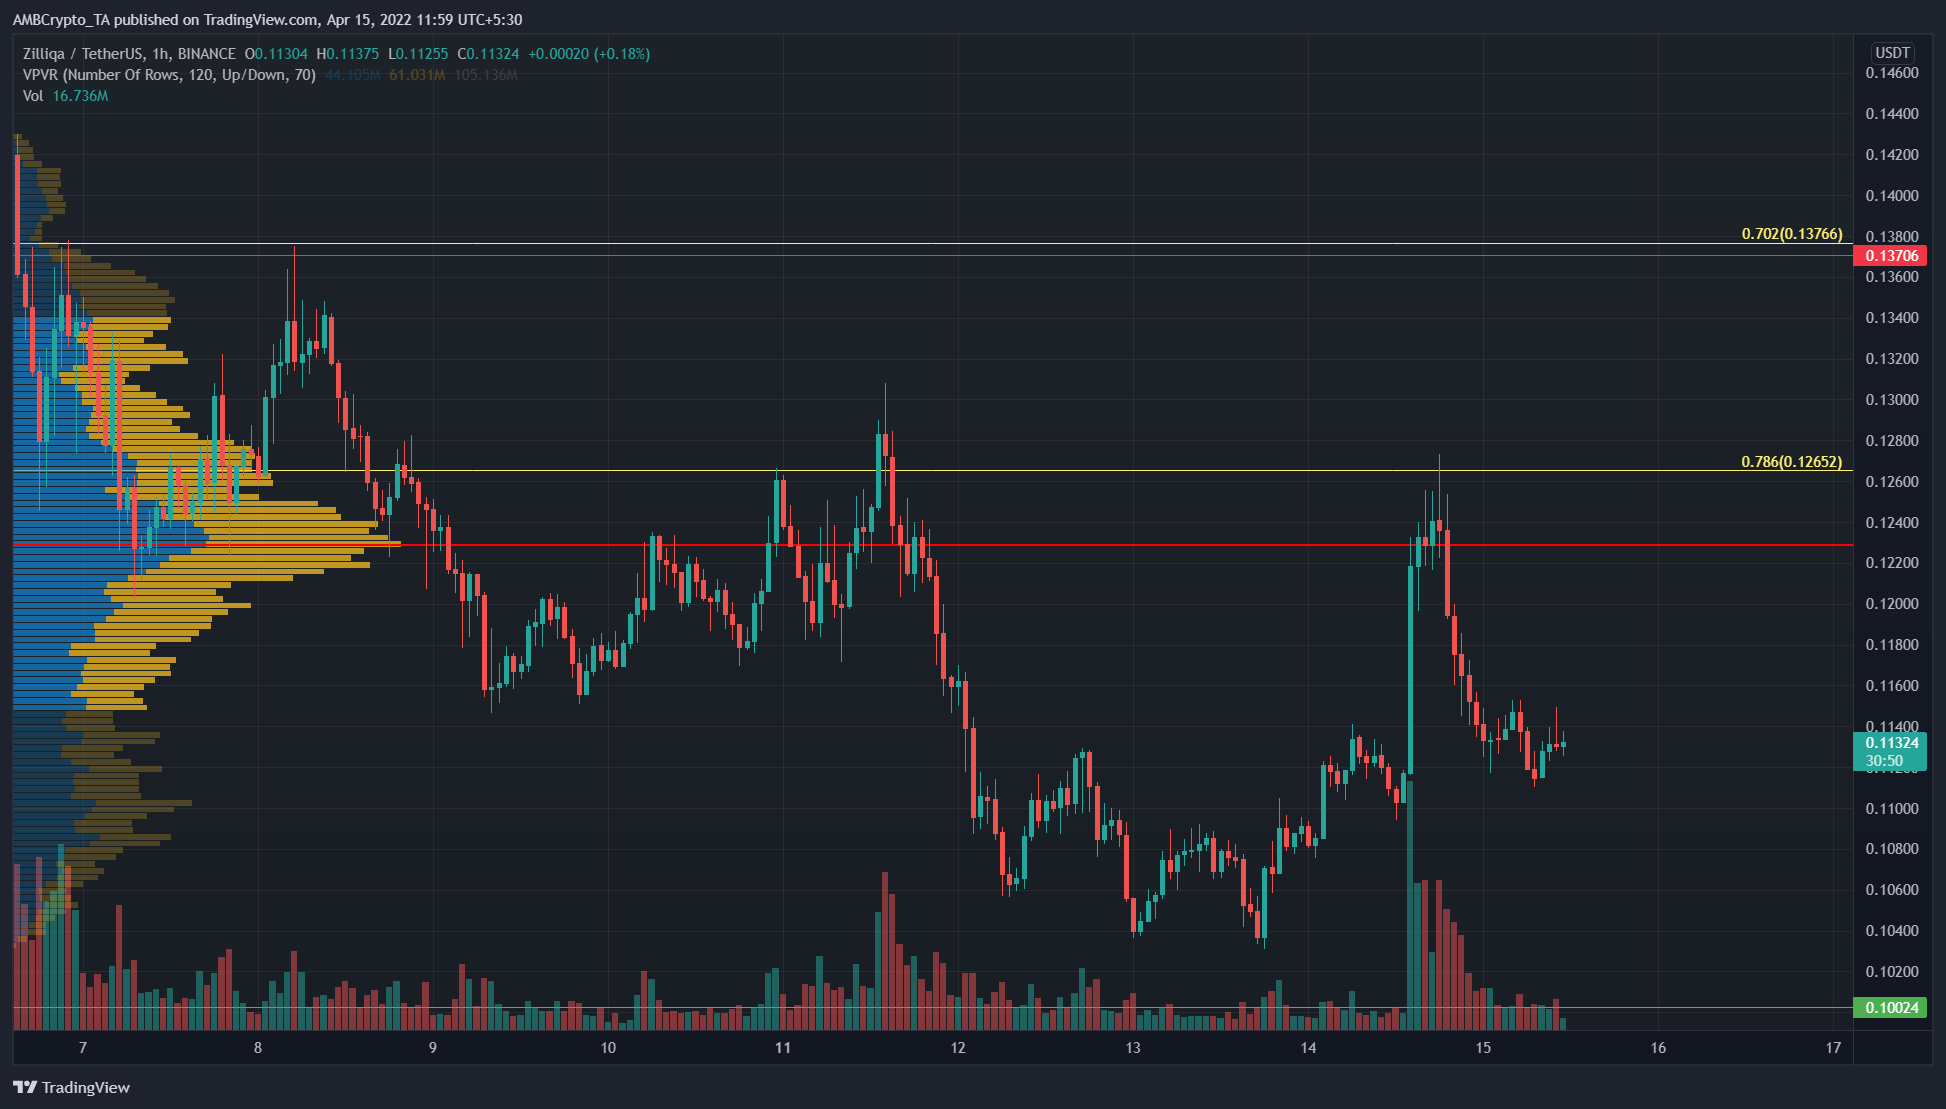
The crypto market has been moving sideways in the past few days as Bitcoin established some near-term support at $39.4k, but at the same time was unable to climb past the $41.4k-$41.8k area of resistance. Zilliqa has also bounced from a level of support, but it was unclear if the coin had found its near-term bottom. There was strong selling volume which suggested Zilliqa might be forced lower once more.
ZIL- 1 Hour Chart
The Volume Profile Visible Range showed the Point of Control to lie at $0.123. This indicated that the largest volume of trading for the visible price chart was seen at the $0.123 level, which meant it was a strong level of resistance.
The price was also beneath the Value Area Lows at $0.115. If ZIL can move past $0.115 and retest it as support, it could be a short-term buying opportunity.
Lower down the charts, some support could be seen at the $0.1 mark. The price does have a bearish structure considering the price action of April. On the other hand, this could also be a phase of accumulation before an expansion upward for the price.
Rationale
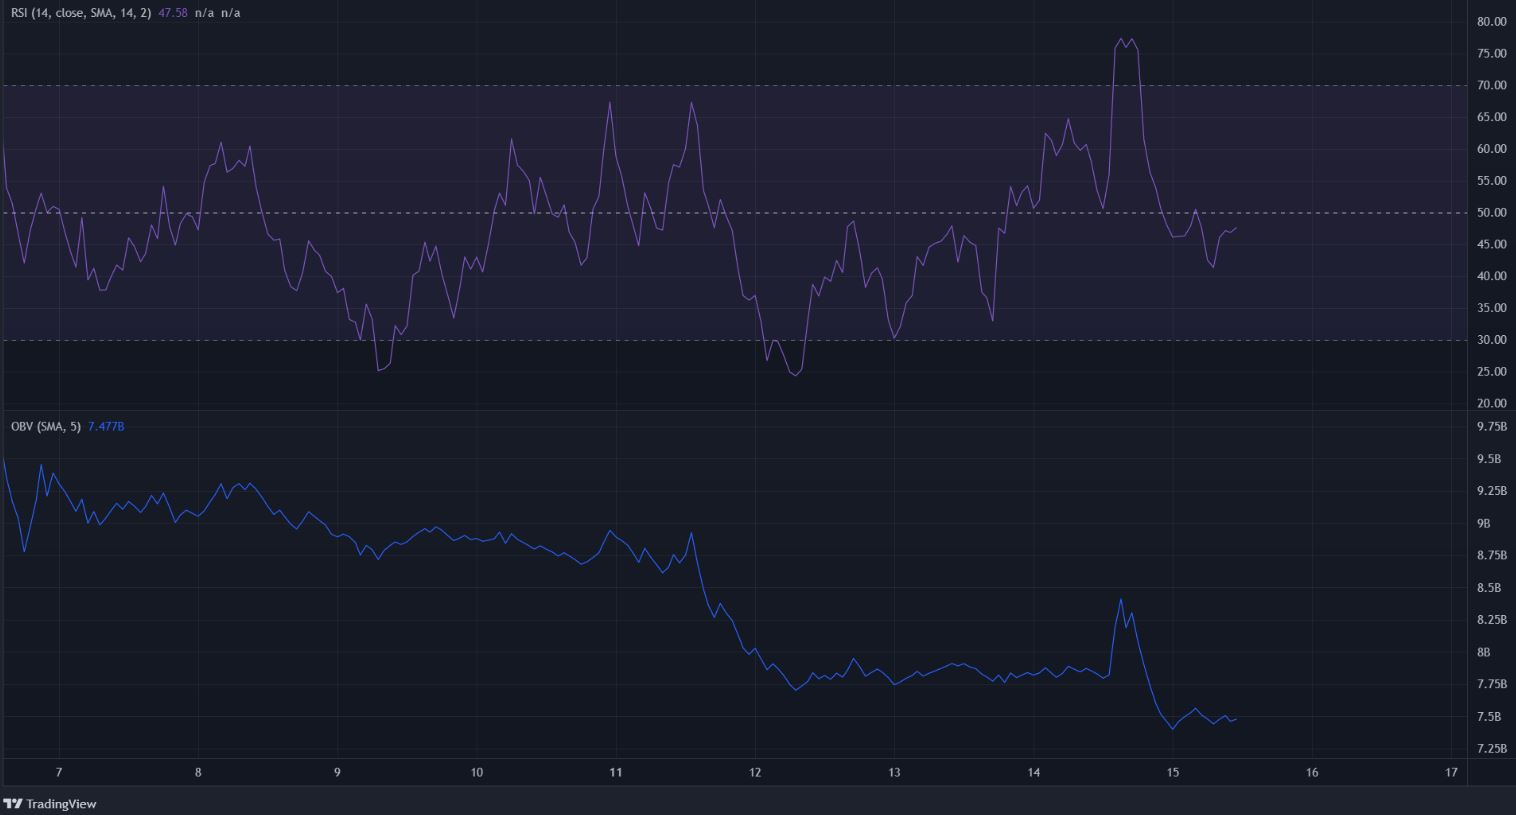
In the event of an accumulation, we would expect the OBV to be steadily rising. However, it has been the opposite for ZIL in the past two weeks. The OBV has been dropping, even as the price held on tenuously to levels of support.
The RSI slipped beneath the neutral 50 line and looked to be headed lower, as the bullish momentum of the past two days reversed.
Conclusion
The price has slipped beneath the 78.6% retracement level, which meant that it was likely to go to the 100% (complete retracement of the bullish move) level and even lower. To back this idea, the OBV has also been descending, while the market structure was bearish.
It was possible that ZIL would see consolidation/accumulation just above the $0.1 mark. Yet, the short-term charts suggested a further downside is possible.


