Fantom sees a bullish divergence, but how high can it bounce

Disclaimer: The findings of the following analysis are the sole opinions of the writer and should not be considered investment advice
Fantom has been in a downtrend for nearly three months now. The trend remained bearish, but the price did hit a zone of demand, and a bounce can be expected over the next few days. However, a bounce would not mean that the downtrend has been broken.
In other news, the Fantom-based “profit optimizer”, Redemption Defi, suffered an attack the previous day wherein their own tokens tripled in price due to malicious interference. The team promised a post-mortem Medium article with details on the targeted attack.
FTM- 12 Hour Chart
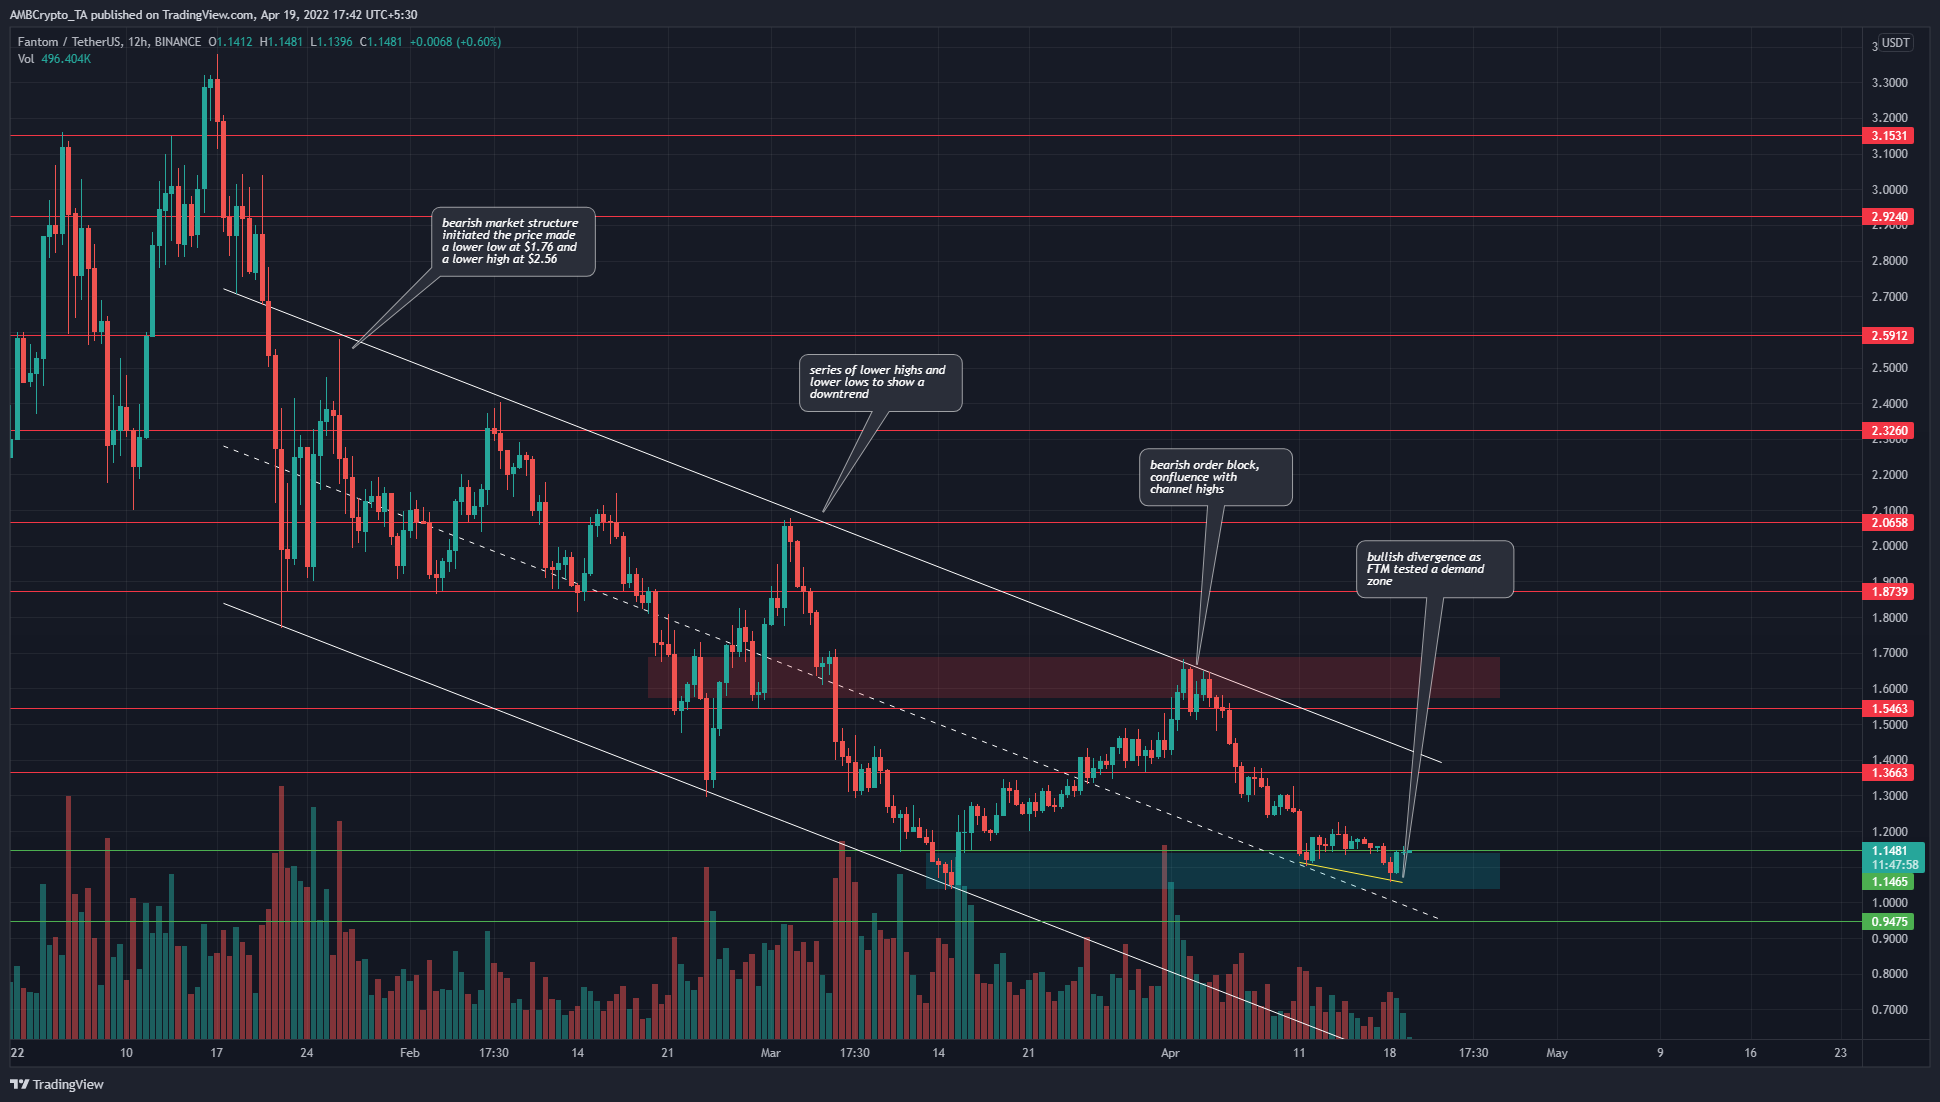
The most recent lower high of the downtrend lies at $1.68 and is the level for long-term FTM bulls to beat. Apart from being a lower high, it is also a zone of significant resistance. The liquidity from the sell orders will have to be overwhelmed by buying pressure, which could take a few tries to achieve.
Until the $1.6-$1.7 area is flipped to support, a long-term buying opportunity might not be present. However, for more risk-loving market participants, a buying opportunity appeared to be brewing at press time.
The $1.05-$1.15 area is a zone of demand for FTM, and a bullish divergence between price and momentum (yellow) was spotted. The confluence of demand zone and divergence, combined with a possible bounce for Bitcoin toward $42k, could see FTM run upwards in the next few days.
FTM has been trading within a descending channel (white), and the channel highs along with the horizontal resistance level at $1.36 could halt a bounce in price.
Rationale
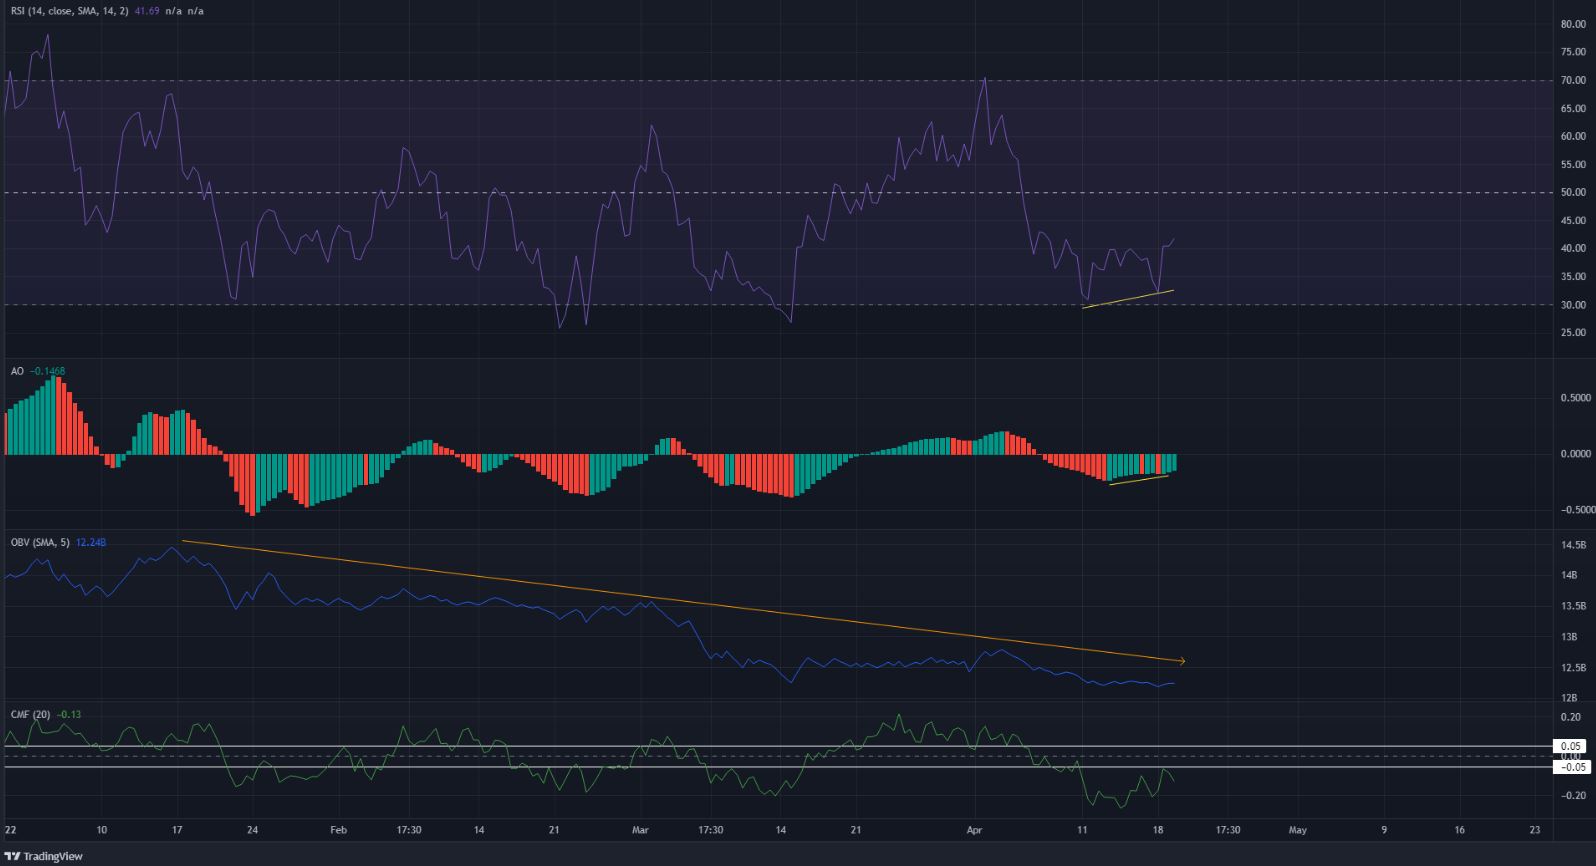
The RSI and the Awesome Oscillator showed weakening bearish momentum (yellow) even as the price formed a lower low, indicative of a bullish divergence.
However, the OBV continued to tread on a southbound path. The CMF was also beneath -0.05. This suggested that there wasn’t sufficient demand yet to show a reversal in trend.
Conclusion
The market structure continued to lean towards the bears, and the $1.36-$1.4 area needs to be beaten to shift this bias. The divergence and possible bounce could be examined on lower timeframes to uncover a place to enter long positions at.


