Why investors must keep an eye on these AVAX price levels this week

Disclaimer: The findings of the following analysis are the sole opinions of the writer and should not be considered investment advice
Like most altcoins, Avalanche (AVAX) noted a substantial diminution in its value over the past month. The sell-off from its six-month trendline resistance (white, dashed) carved out a falling wedge (white) on the daily timeframe.
Trading against the bearish market structure may not be a profitable choice. But, investors must look out for a close above the current pattern for bagging in probable short-term gains. At press time, AVAX was trading at $34.17, up by 15.21% in the last 24 hours.
AVAX Daily Chart
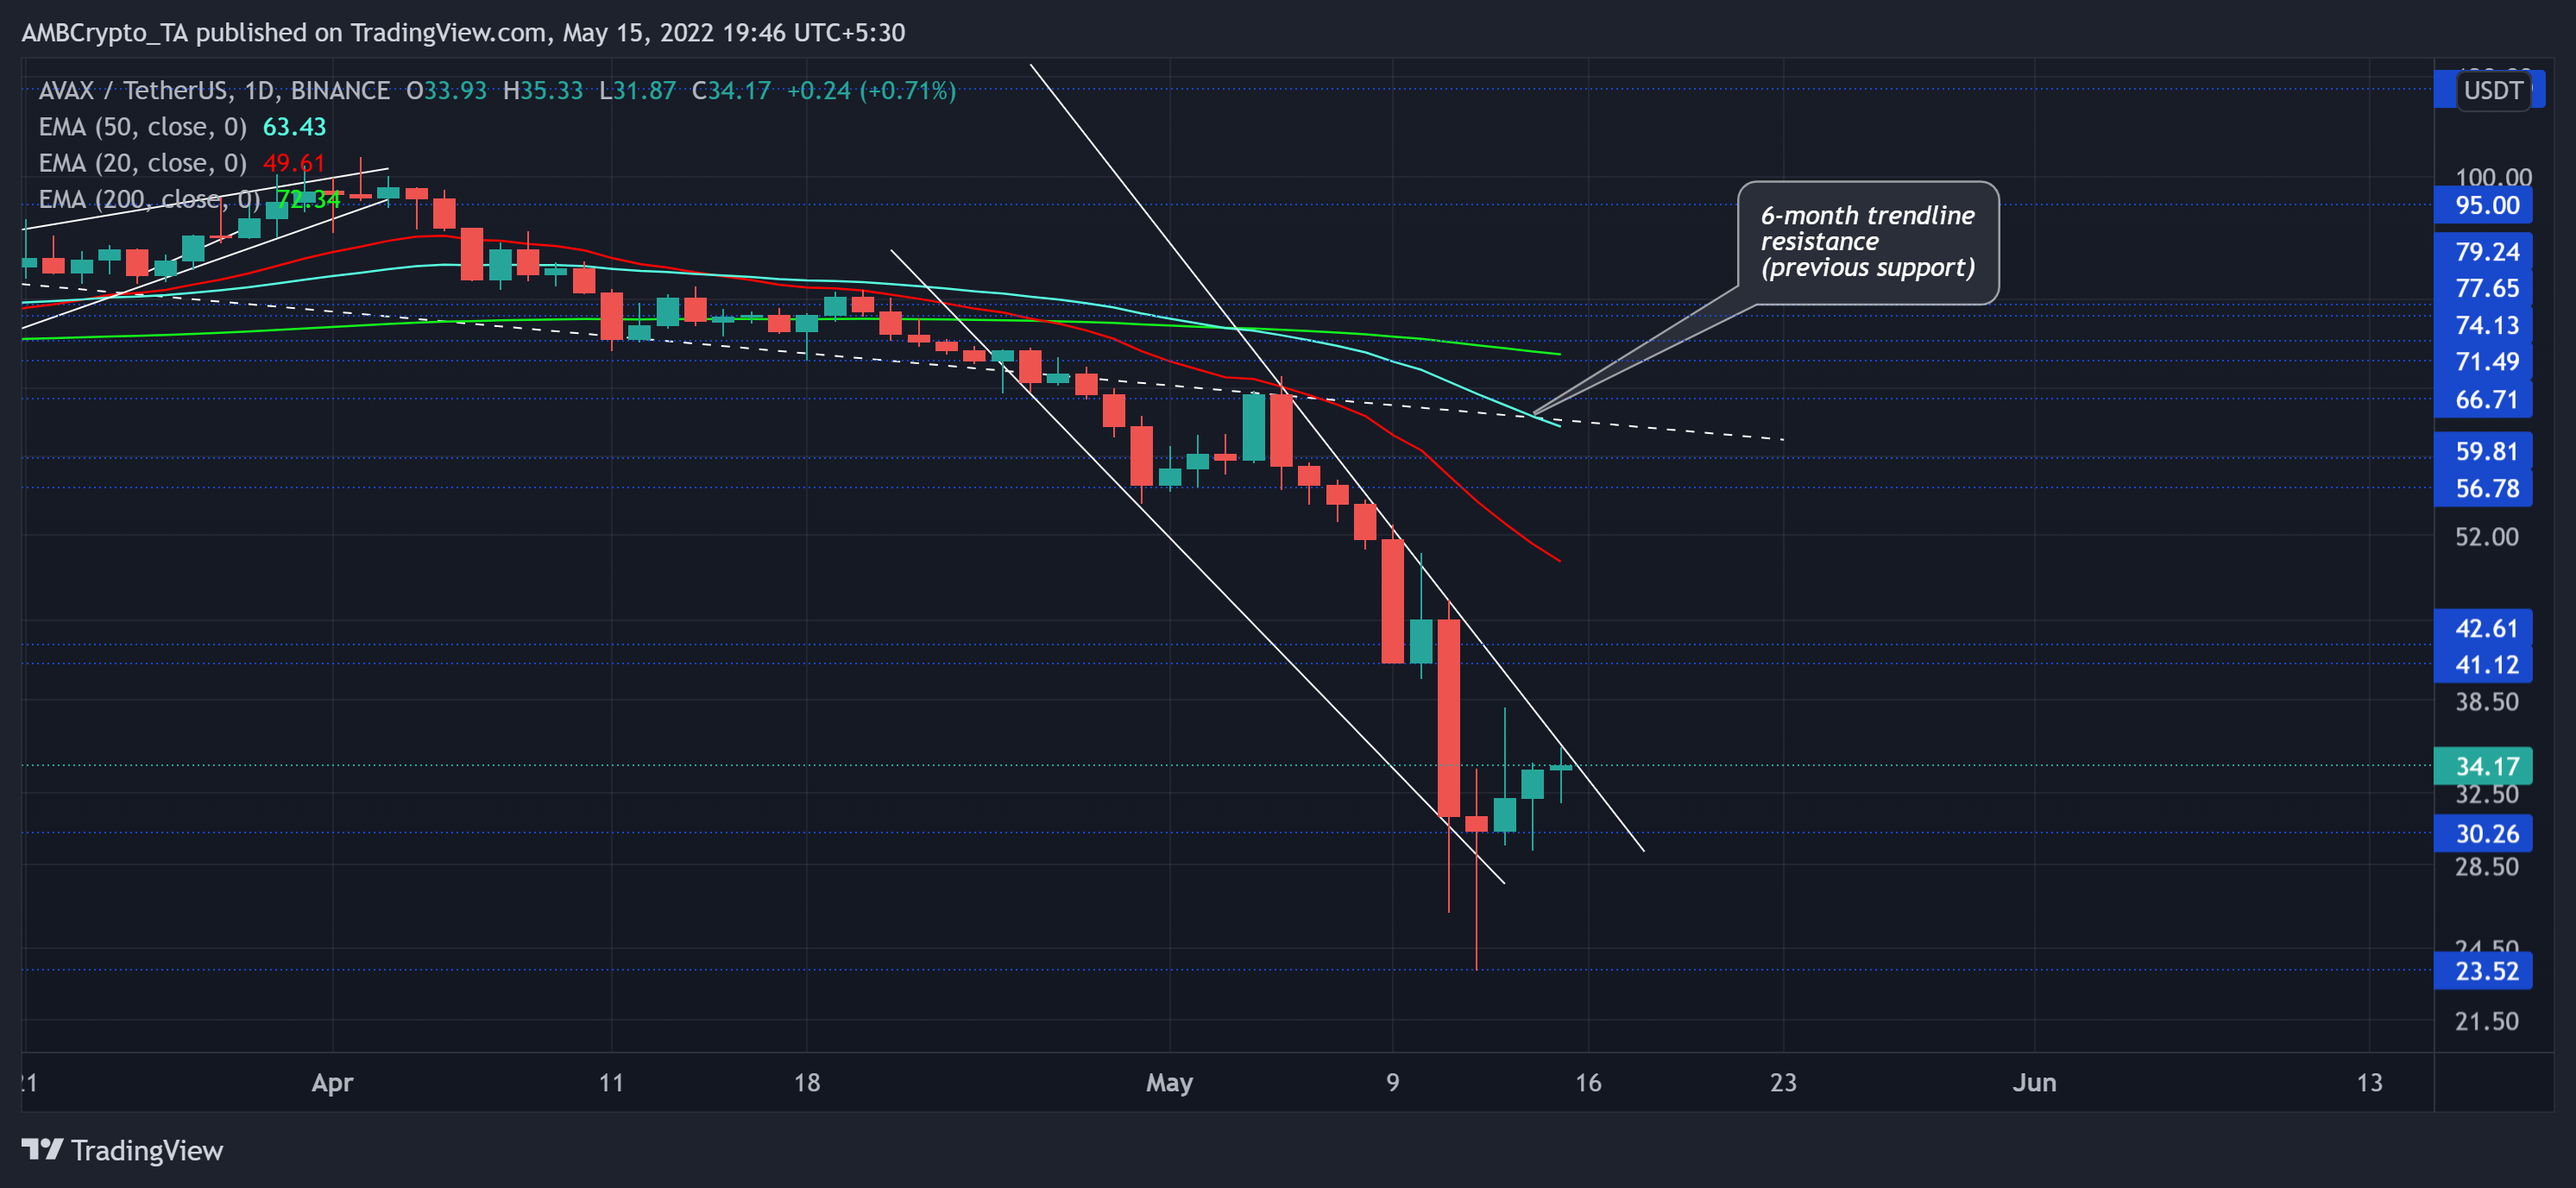
Since hitting its lifetime milestone, AVAX lost more than 84% of its value and plunged towards its nine-month low on 12 May. On its way up from there, the alt tested the upper trendline of the falling wedge. The bullish hammer on the daily chart boosted this revival from the $30.2-level.
Having a bird’s eye view, AVAX has consistently found fresher lows alongside lower peaks since its ATH. Consequently, the 20 EMA (red) jumped below the 50 EMA (cyan) while the gap between them kept rising over the last few days. This reading revealed a clear edge for the sellers in the ongoing market structure. Having said that, a prolonged rising gap could also affirm an overstretched situation. Thus, leading to a likely revival in the coming days.
Any close above the pattern would expose AVAX to short-term gains while it would head to test the $41-$42 range. With relatively weak buying volumes, the chances of a profitable bull run seem pretty slim at this point. On the downside, the $30-level would be vital for the bulls to uphold to prevent a further fall towards the $23-floor.
Rationale

The Relative Strength Index undertook a robust downturn from the 44-level resistance. Despite multiple tries, the bulls have been struggling to undermine the bonds of the 30-mark.
The MACD and the Signal lines have refrained from a bullish crossover for nearly six weeks now. Thus, revealing a visible selling advantage in the current market. Historically, these lines have picked themselves up after taking such a plunge below the -10 level. So, the bulls would aim to further ease the selling pressure in the coming times.
Conclusion
Should the bulls capitalize on the current falling wedge setup, a close above the pattern would open doorways for a $41-$42 range retest. However, the buyers still need to propel an uptick in buying volumes to counter the steady selling pressure.
Last but not least, the investors/traders must keep a close watch on Bitcoin’s movement. This reading would enrich the understanding of the overall market structure and dynamics to complement these technical factors.