Polkadot: This breakdown pattern in DOT can spell bad news for the near term

Disclaimer: The findings of the following analysis are the sole opinions of the writer and should not be considered investment advice.
After flipping one-eighty from its early-April highs, Polkadot (DOT) has been on a persistent decline over the last two months. During this phase, the 38.2% and the 23.6% Fibonacci levels curbed most bullish revival attempts.
The current price setup could play out in favor of the bears as the price action squeezes between a symmetrical triangle (white).
Any reversals from the upper trendline of the triangle could expose DOT to a potential downside in the coming sessions. At press time, DOT traded at $9.86, up by 6.22% in the last 24 hours.
DOT Daily Chart

The recent retracements pulled DOT toward its 16-month low on 12 May after a 55% weekly decline (5-12 May). Since then, the incrementally higher troughs saw a refutal by the bearish peaks. Thus, forming a symmetrical triangle on the daily timeframe.
Gauging the trend from a bird’s eye view, DOT’s previous downtrend could inflict a downside breakout from the triangle. Further, the volumes have gradually declined during this symmetrical triangle’s formation. The traders/ investors should watch for the breakout day volumes to assess the effectiveness of the triangle.
With a confluence of the 23.6% level, the 20 EMA (red), and the two-month trendline resistance (white, dashed), DOT could break down from the pattern. In which case, sellers would aim to retest the $8.6-support. Any fall below this mark would provide further shorting opportunities in the $7.3-$8 range.
However, a bearish invalidation can lead to rather short-lived gains until the 38.2% level in the $11.8-zone.
Rationale
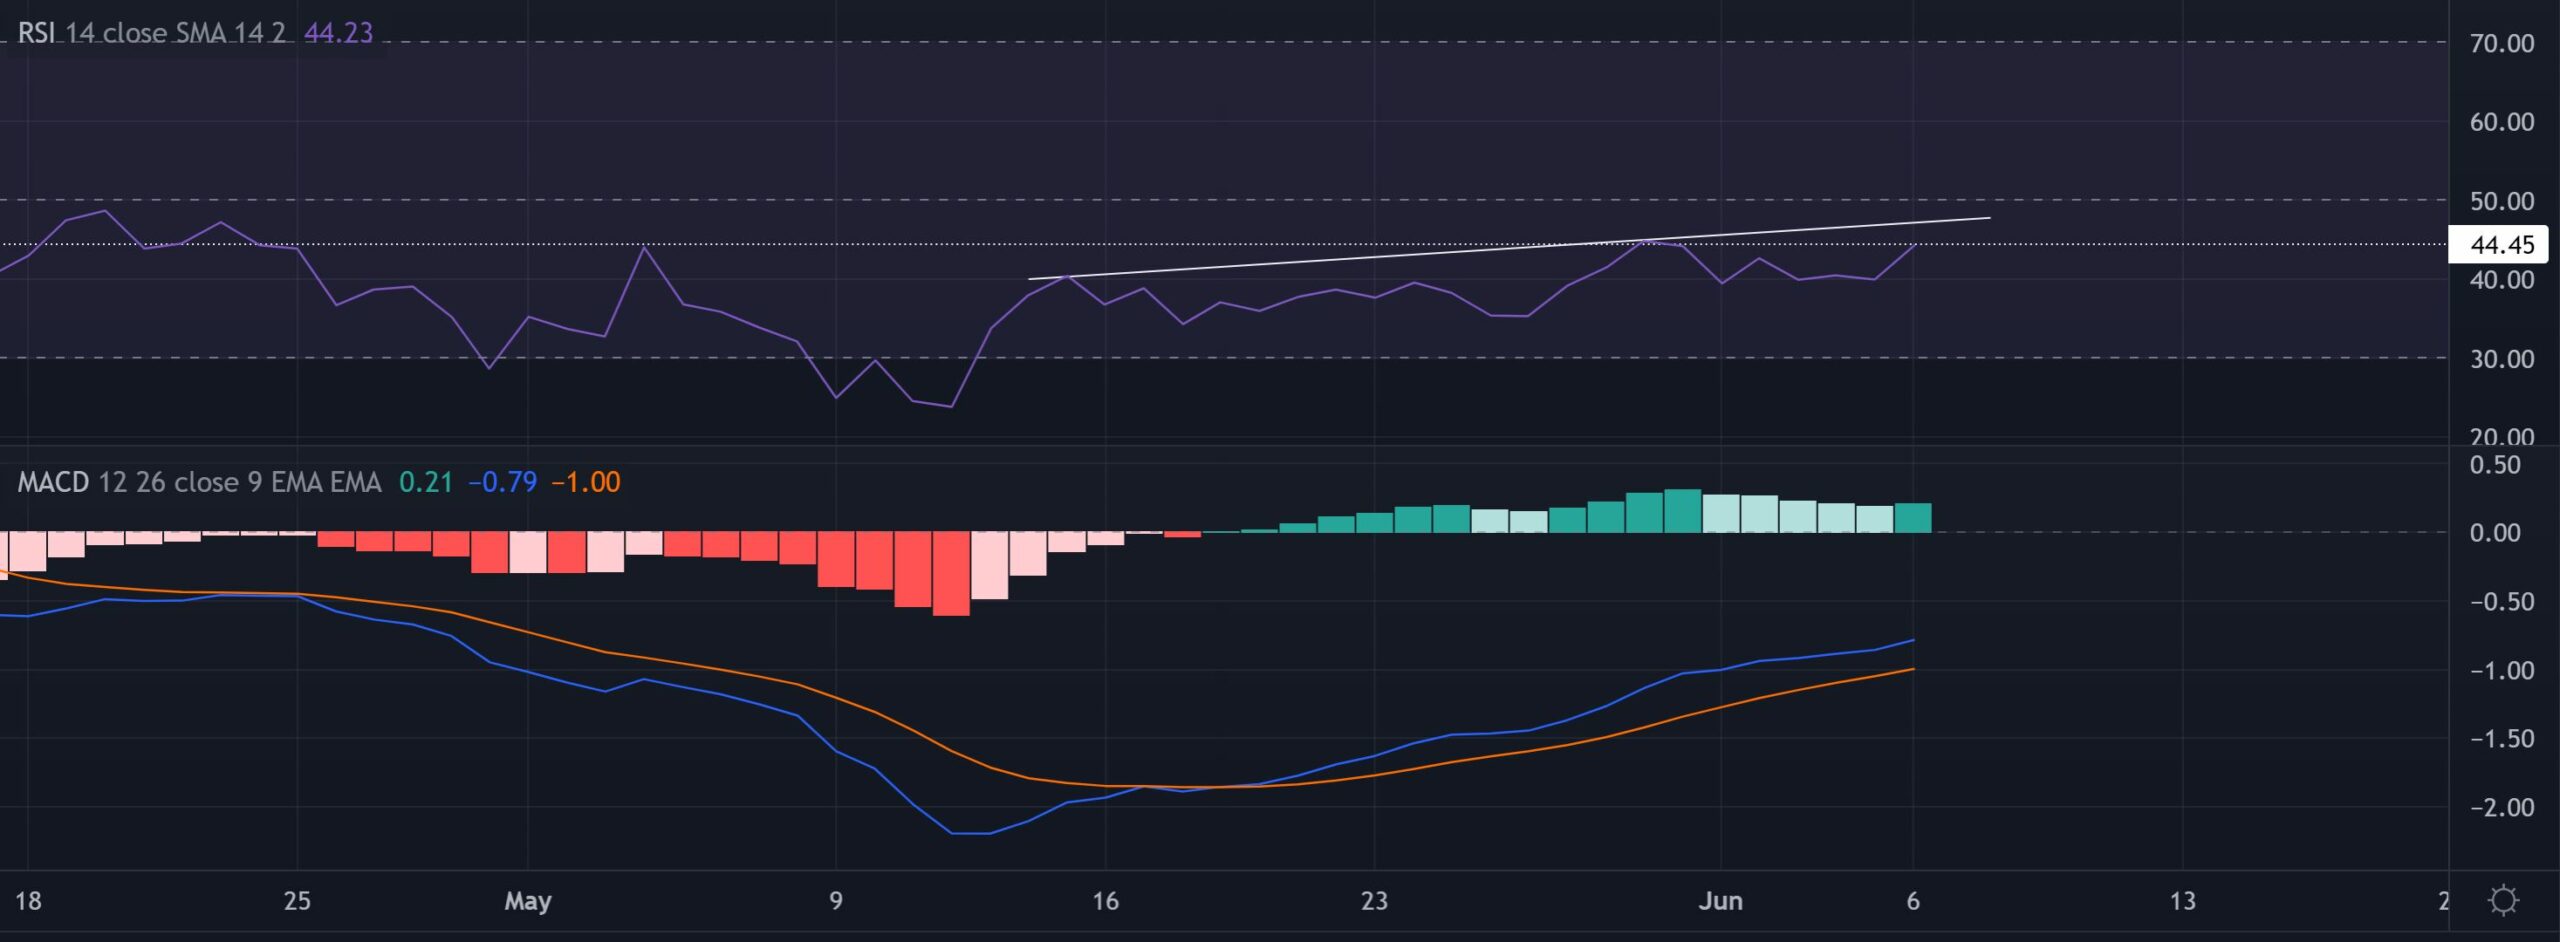
The RSI’s growth from its oversold region has helped it test the 44-mark resistance. Any reversals from this mark or the trendline resistance would affirm a bearish divergence with the price.
The MACD lines have depicted ease in selling power over the last day. But until these lines cross the equilibrium, the buyers would have a tough time turning the tide in their favor.
Conclusion
Looking at the symmetrical triangle squeezing at the confluence of resistances, DOT could face a near-term setback.
A close below the triangle could lead the alt for a test of the $8.6-support followed by the $7.3-zone. If the bulls find renewed buying pressure, a short-term rally could see restrictions at the 38.2% level.
At last, an overall market sentiment analysis becomes vital to complement the technical factors to make a profitable move.


