Tron [TRX] traders can consider these levels before making an exit

The global crypto market cap fell below the $1 trillion level post the market-wide drawdowns. Without a surprise, the crypto fear and greed index gauged the sentiment to be in the extreme fear zone as it plunged to its record low at the time of writing.
Although Tron [TRX] had a bullish rally in April and May unlike most of its peers, the last few days marked a substantial retracement.
A strong bullish effort to prevent a close below the $0.054-mark can help TRX clinch short-term gains. But with the daily 20 EMA (red) falling below the 50 EMA (cyan), the broader movements would support the bearish narrative. At press time, TRX was trading at $0.05547, down by 7.32% in the last 24 hours.
TRX 4-hour Chart
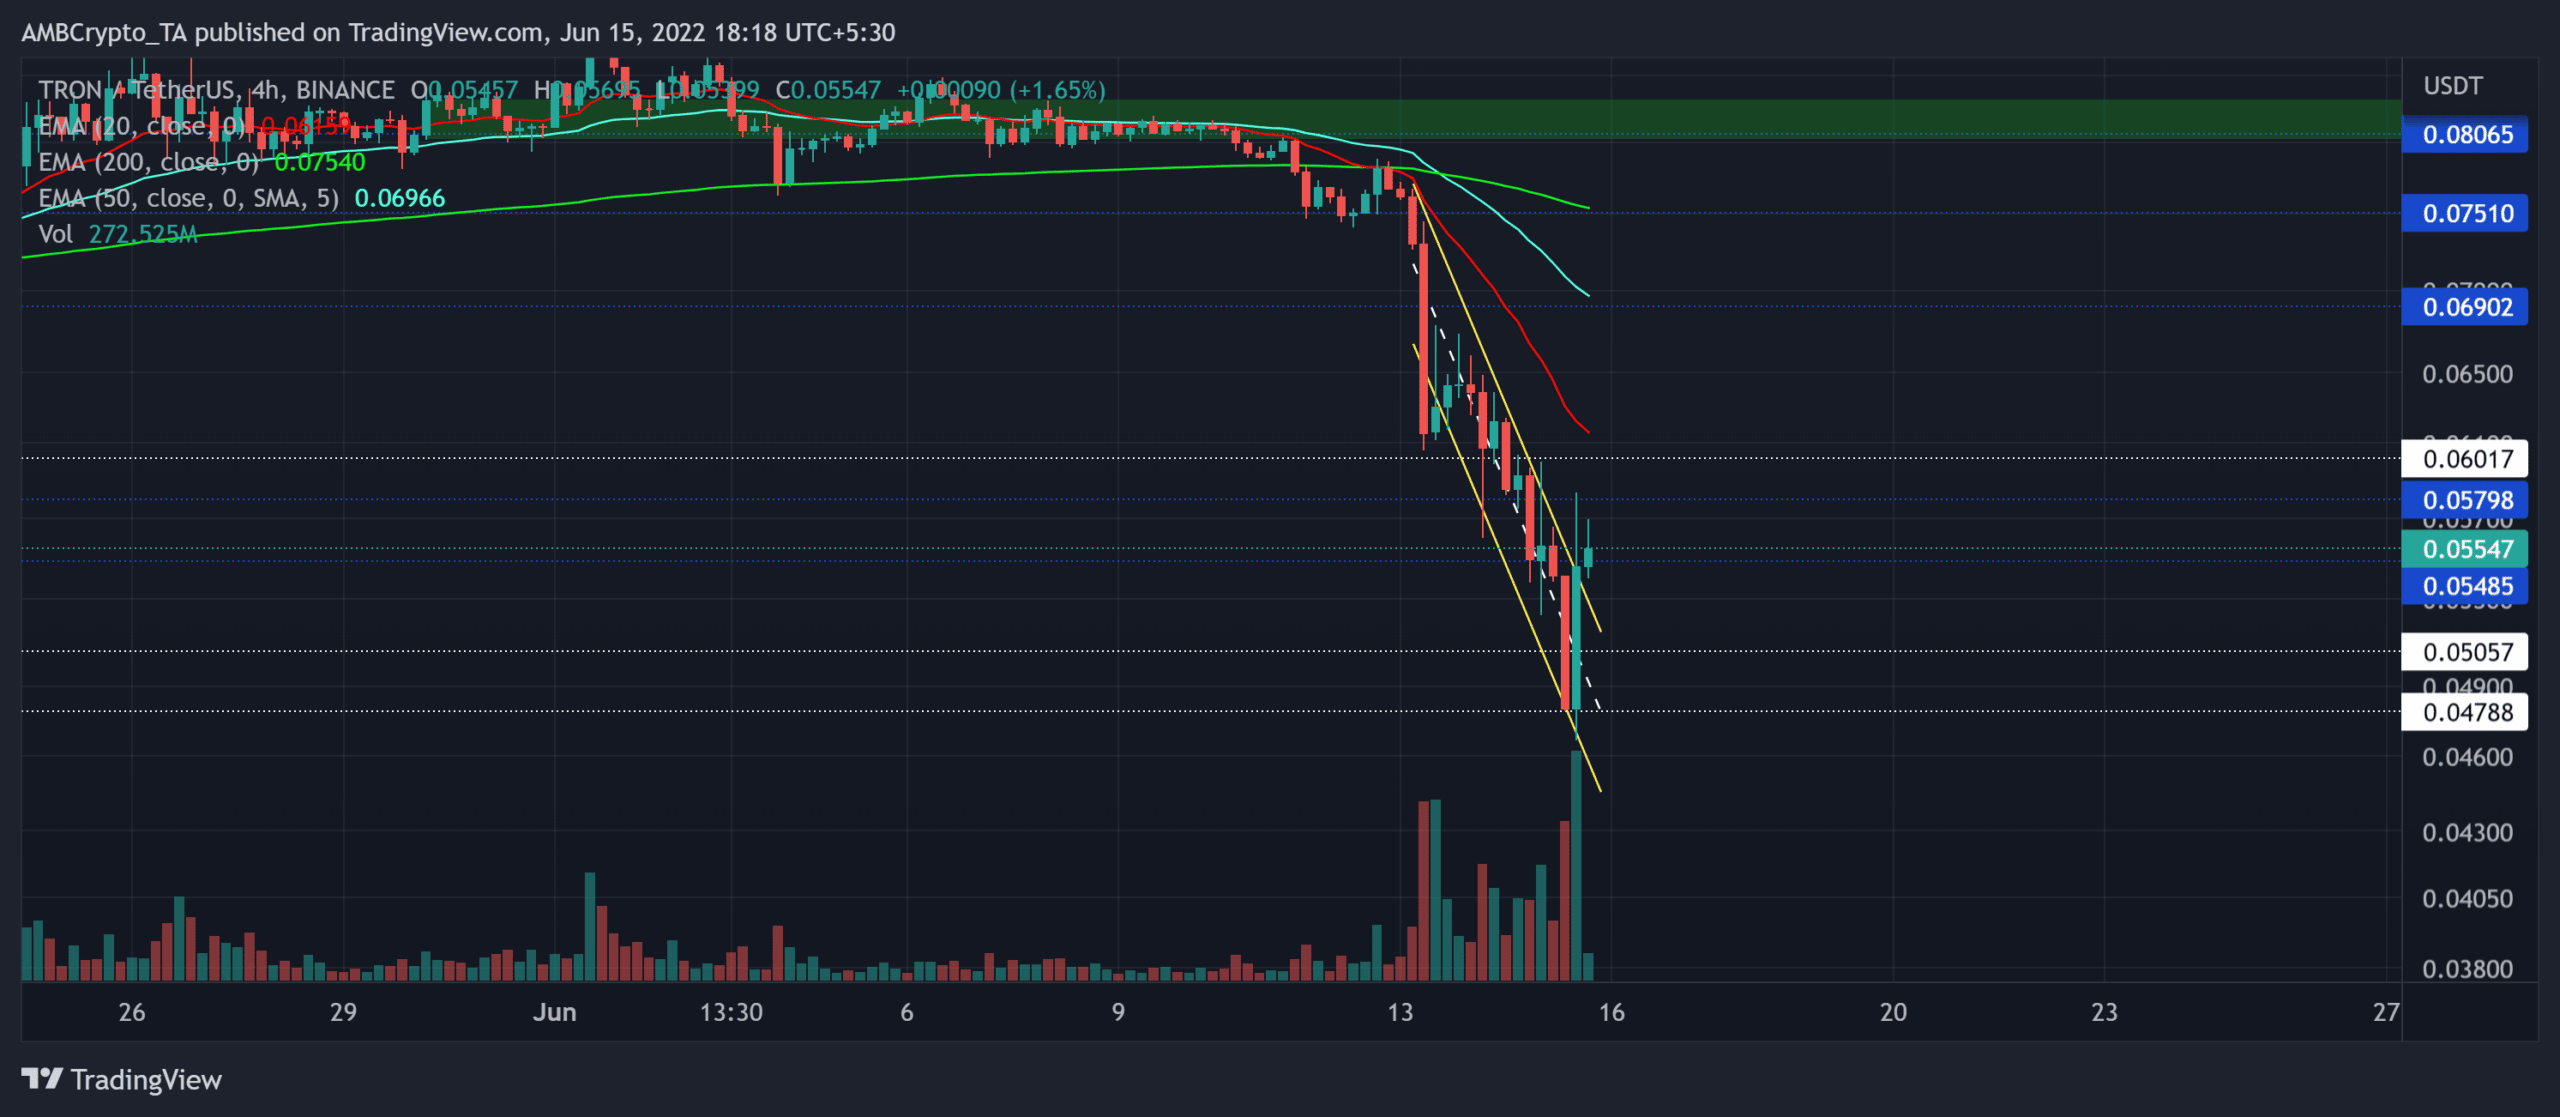
On this timeframe, TRX saw a break above its down-channel (yellow). A sustained close beyond the $0.054-level could aid the near-term bullish efforts to test the 4-hour 20 EMA in the coming sessions. Also, with the recent spike in buying volumes, TRX marked a bullish engulfing candlestick.
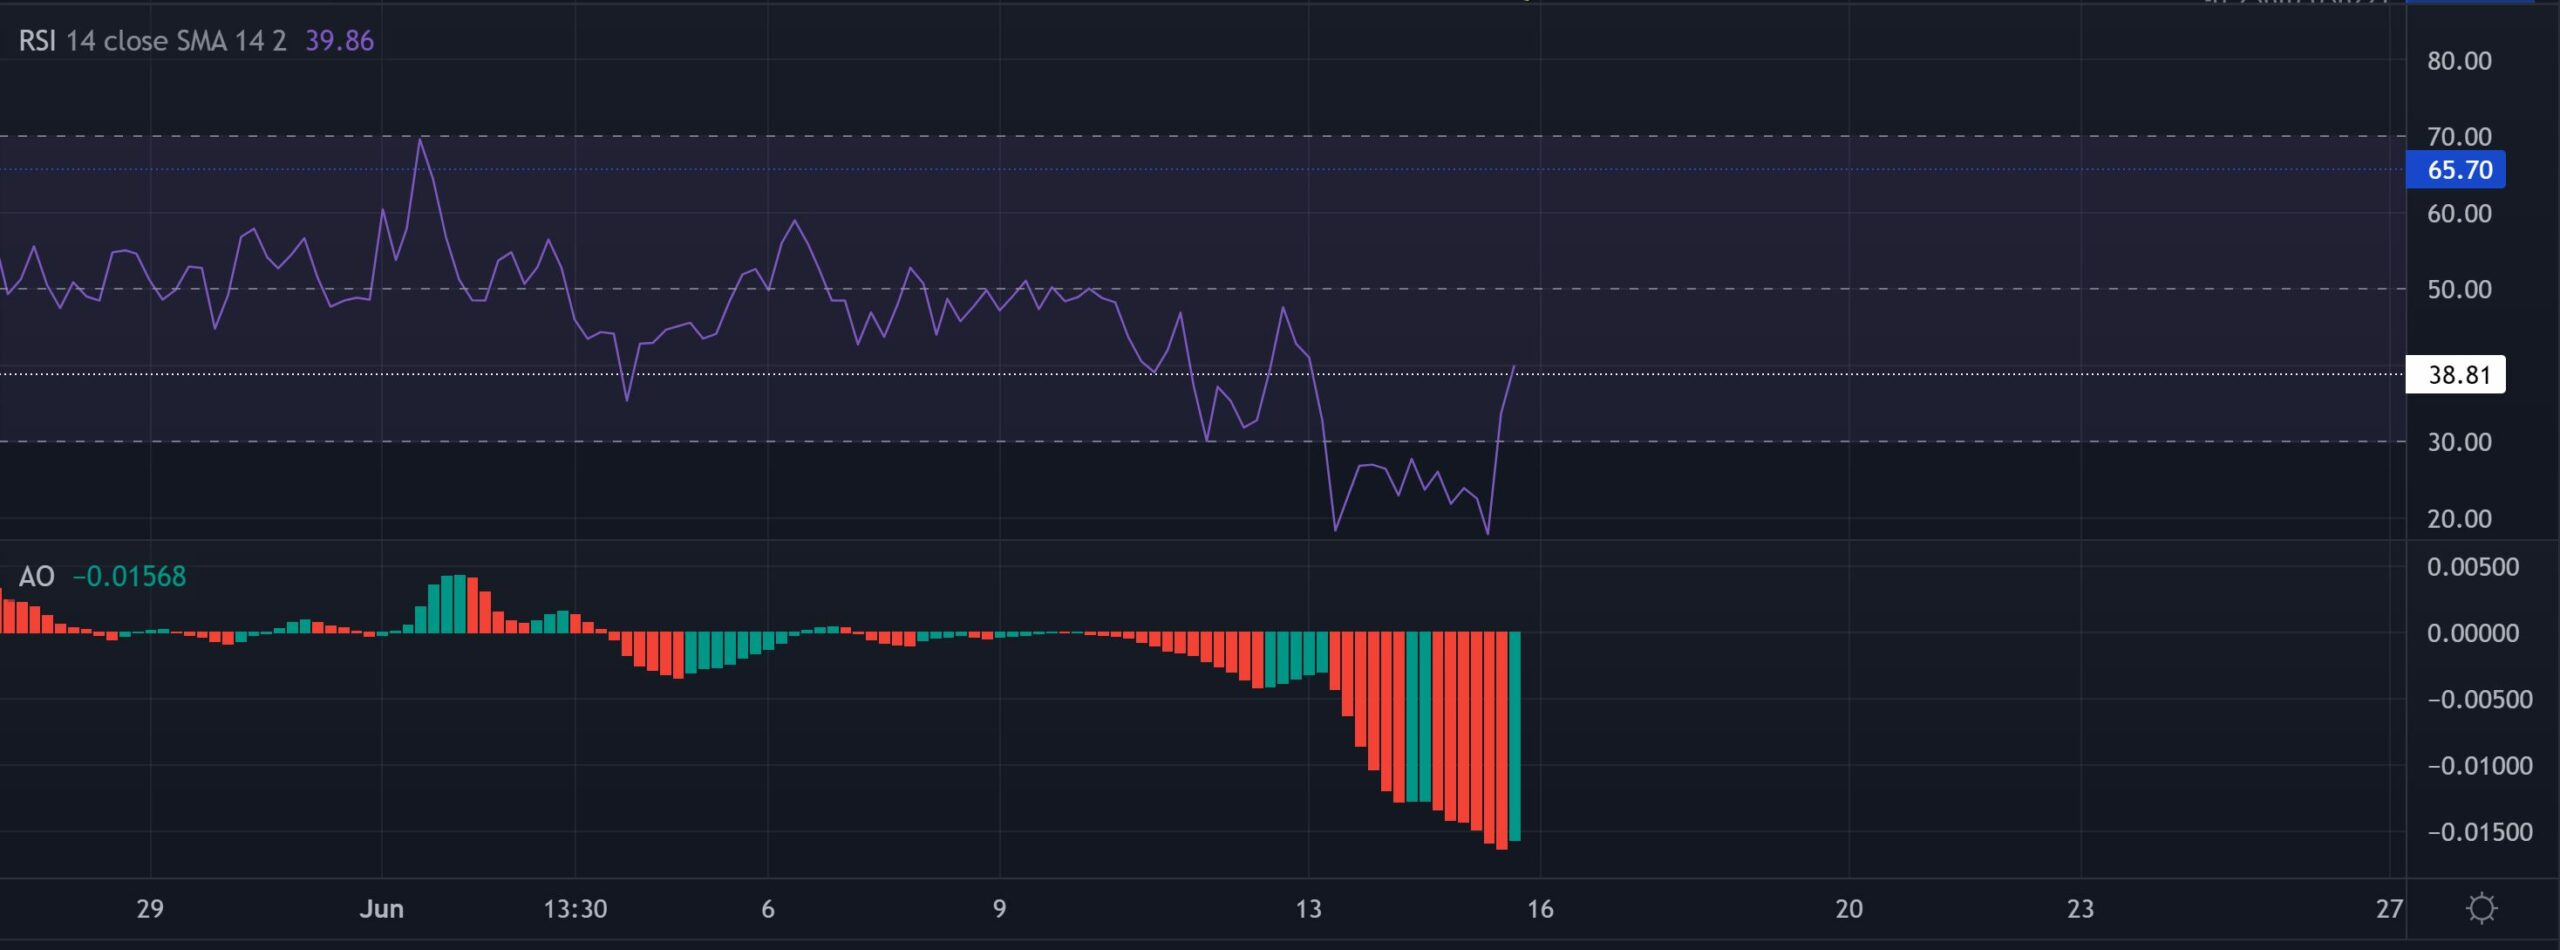
The RSI saw a decent growth after jumping beyond the oversold region. A sustained jump above the 38-mark would open opportunities for a near-term recovery. The AO’s gradual peaks toward the zero-mark would reaffirm the strength of the recent break.
TRX Daily Chart
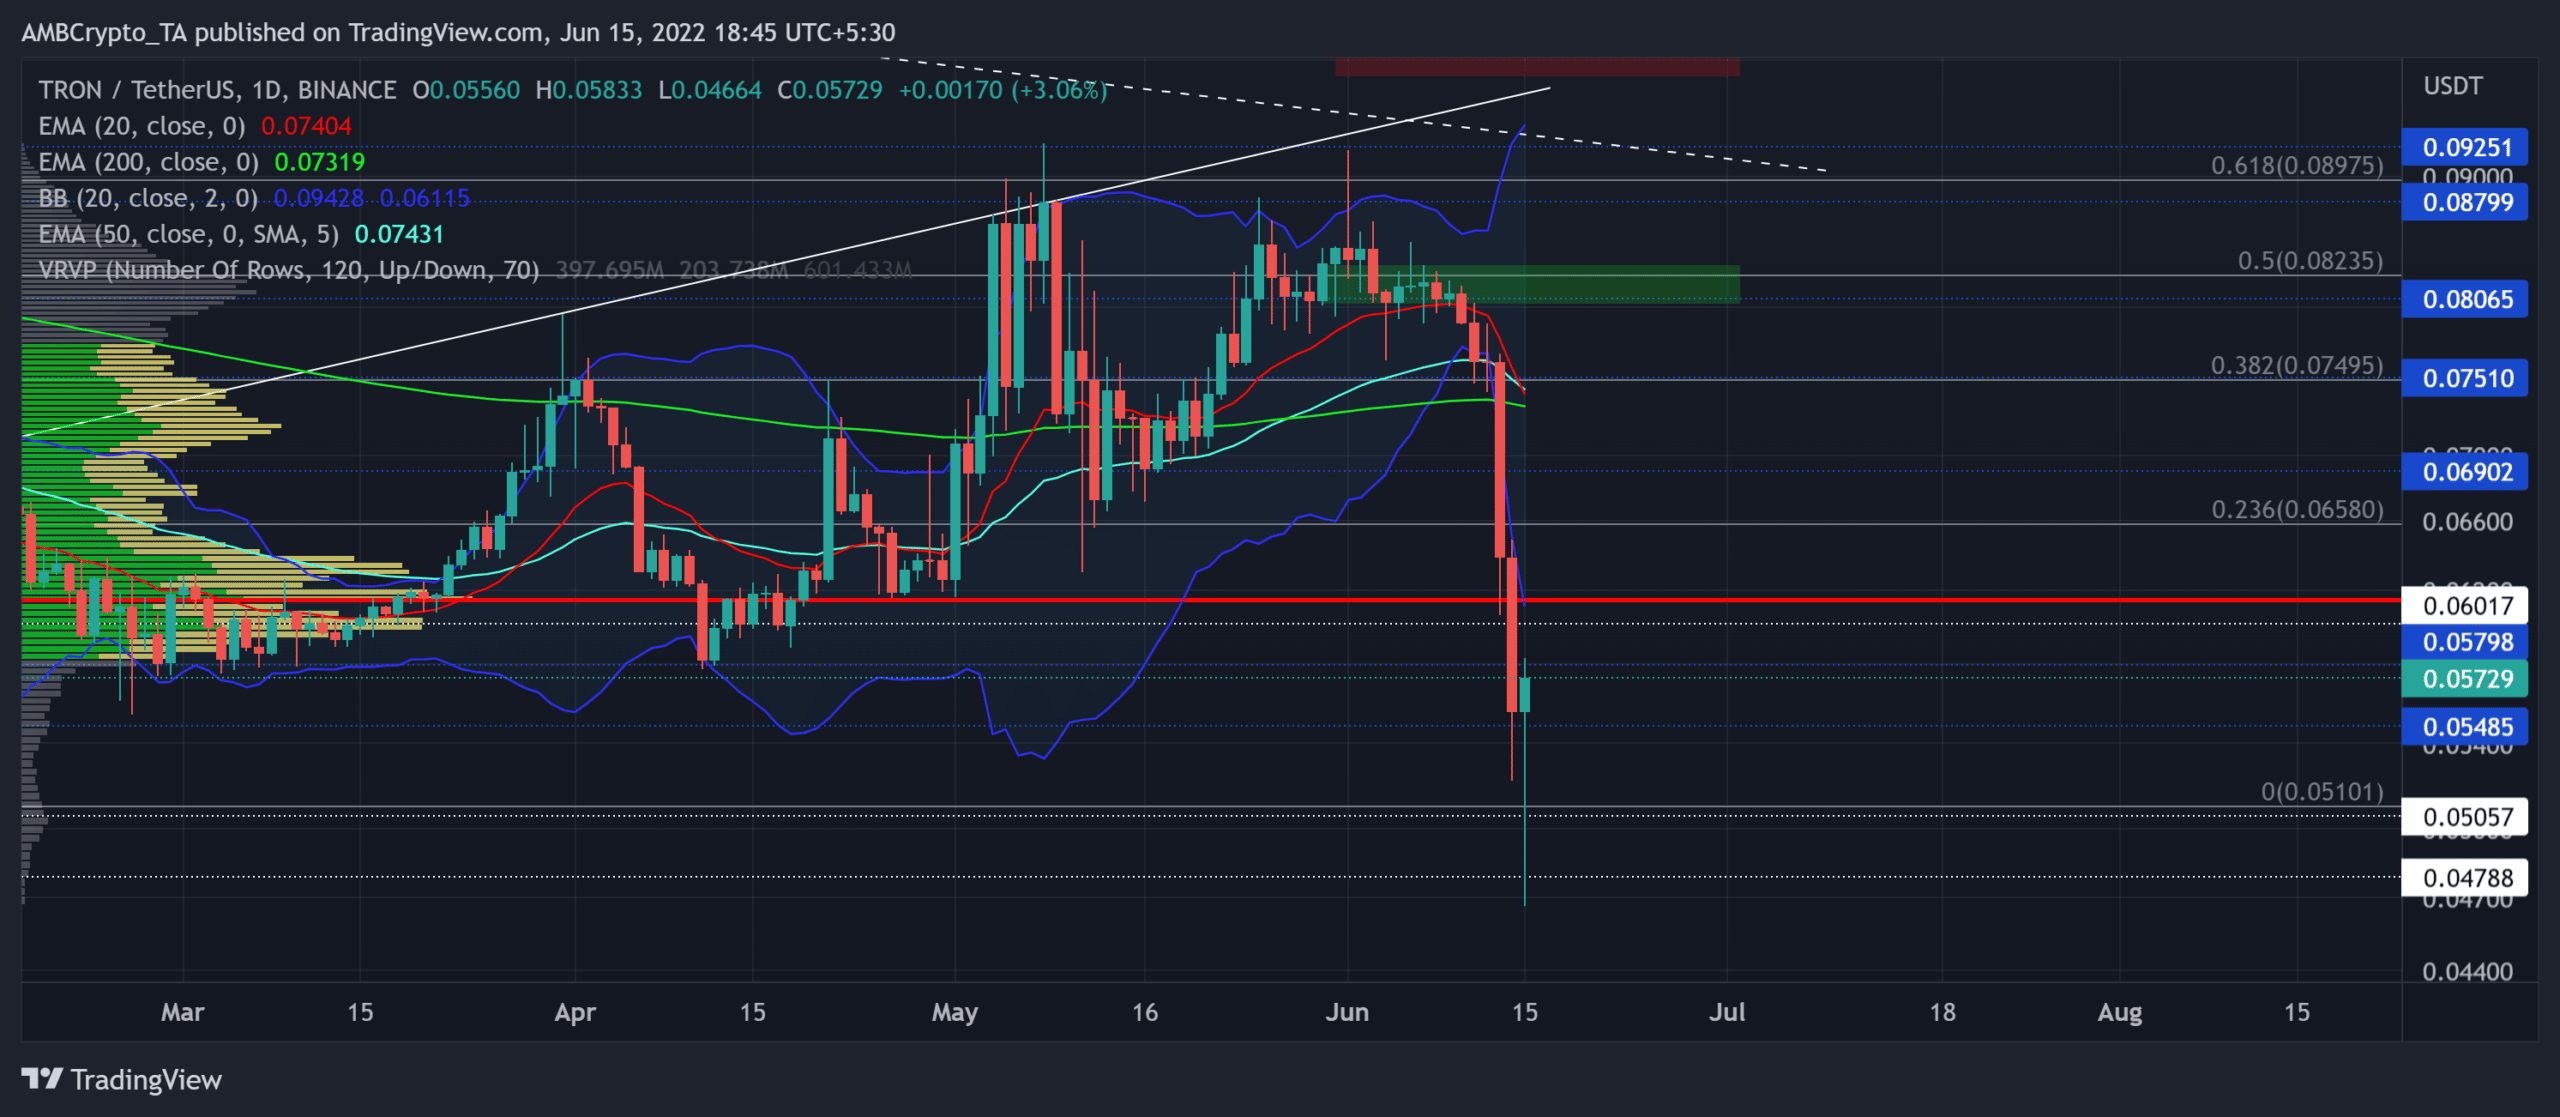
On a relatively broader timeframe, TRX struggled to show any improvements while losing the vital $0.06-mark that coincided with the Point of Control (POC, red).
Interestingly, a strong recovery from the 4-hour chart’s own channel break can confirm a bullish hammer on the daily chart.
However, the daily 20 EMA eyed to undertake a death cross with the 200 EMA. A continued southbound movement of the daily 20 EMA would likely curb the bullish comeback efforts in the $$0.06-$0.065 range.
Also, the extremely oversold readings on the Bollinger Bands (BB) could propel short-term recovery prospects.
Conclusion
The H4 market structure recovery above the down-channel can confirm a bullish hammer on the longer timeframe chart. With this move, the buyers would aim to test the $0.06-$0.065 range.
The death cross on the daily timeframe can substantially impair the bullish comeback chances in the days to come.
Finally, the investors/traders should consider Bitcoin’s movement and its impact on broader market perception to make a profitable move.