Tron: This is where TRX could stabilize before its next big move

It has been a while now since the crypto fear and greed index has refrained from changing its outlook from the ‘extreme fear’ zone. However, after a drop toward the $0.04-level, Tron [TRX] saw a revival while compressing between the two up-sloping converging trendlines (yellow).
A vigorous bearish endeavor to prevent a close above the $0.069 resistance can cause a short-term setback on the chart. At press time, TRX was trading at $0.0678, up by 1.94% in the last 24 hours.
TRX Daily Chart
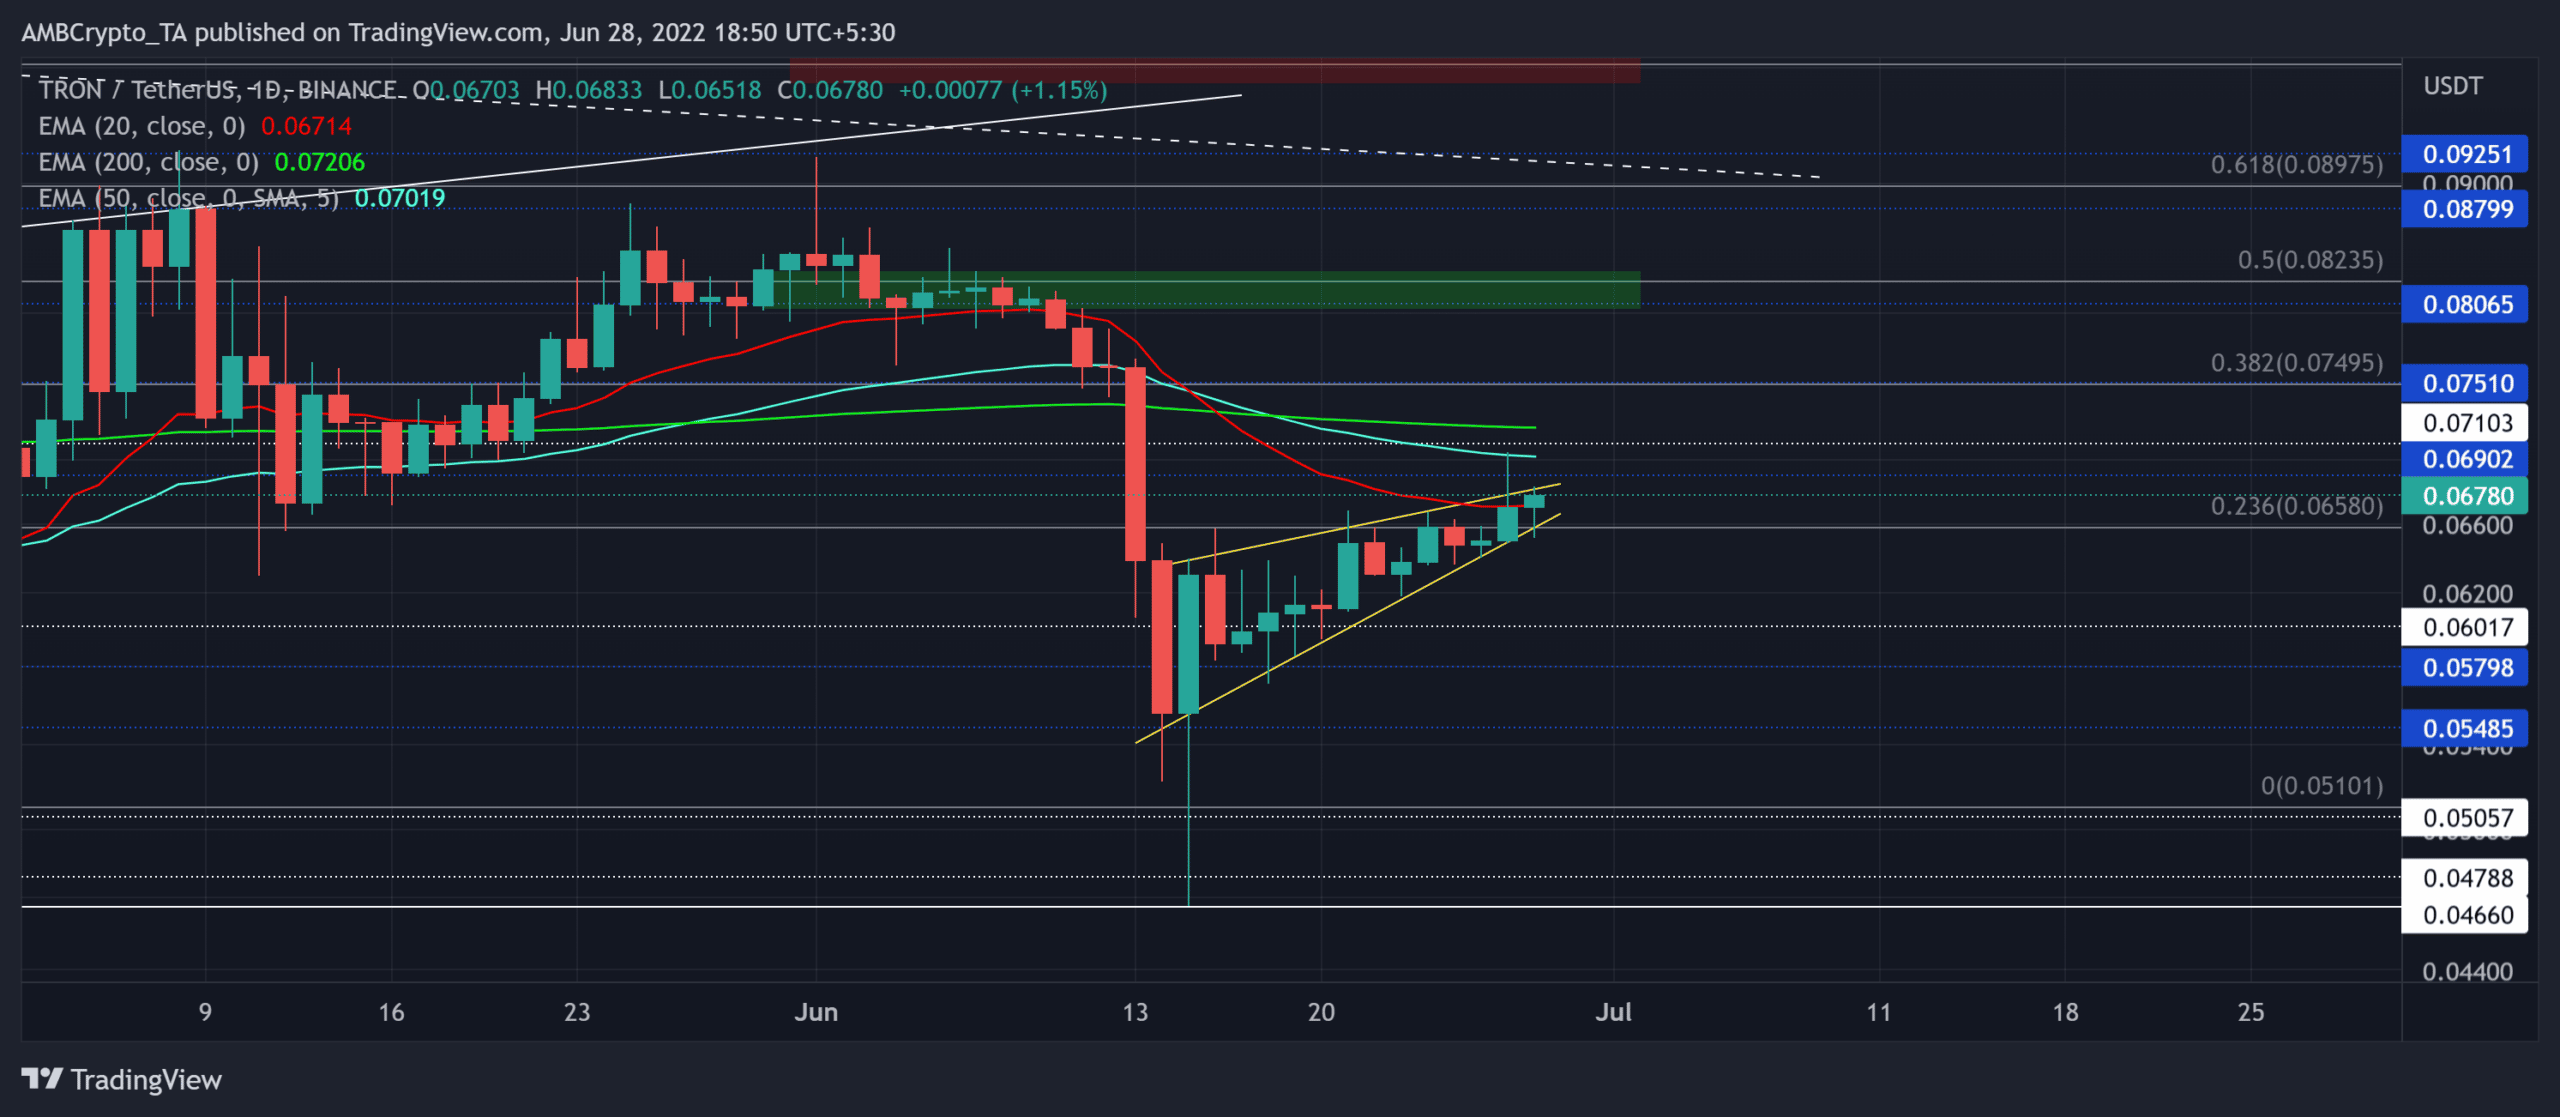
On the daily timeframe, TRX saw improvements after dropping towards its yearly low on 15 June. The recovery from its long-term support entailed a bearish rising wedge-like setup.
With the 20 EMA (red) falling below the 50 EMA (cyan) and the 200 EMA (green), the sellers assumed a stronger control in the current market structure. But the recent growth saw a close above the 20 EMA.
Further, the $0.069 level can undermine the immediate buying effort to test the $0.07-zone. In this case, any reversals from the current pattern would open a doorway to test the $0.057-$0.06 range.
Investors/traders must carefully assess the broader macro-economic sentiments affecting placing long bets. Any bearish invalidations could see relatively short-lived gains from the $0.071-$0.075 range.
Rationale

The Relative Strength Index (RSI) saw strong growth over the past few days from the oversold region. Any reversals from the equilibrium can aid the sellers in propelling a patterned breakdown on the chart.
Also, a reversal from the CMF’s trendline resistance would affirm the existence of a bearish divergence with the price. Also, the oscillator was below the zero-mark for over three weeks now and revealed a strong edge for the sellers.
Conclusion
Given the bearish divergence on the CMF alongside the sturdiness of the $0.069-resistance, TRX could see a setback on its charts. In this case, the take-profit levels would remain the same as above.
However, the investors/traders should consider Bitcoin’s movement and its impact on broader market perception to make a profitable move. An analysis of this would aid the traders in anticipating the possibility of any bearish invalidations.