FTT: Unraveling implications of recent drawdowns on technicals

FTT’s bearish break below the $28.7-level led the alt to retest and eventually breach the $25-support (now immediate resistance). The recent patterned break took a plunge below the seven-week trendline resistance (white, dashed) on the 4-hour timeframe.
A compelling close below the $25-level could expose FTT toward a downside before any bullish revival chances.
Due to the relatively high correlation with Bitcoin alongside the broader sentiment, the altcoin could see trend invalidations. At press time, FTT was trading at $25.127, down by 8.12% in the last 24 hours.
FTT 4-hour Chart

From a near-term outlook, FTT’s rising wedge breakdown has pulled the alt below its 20 EMA (red) and the 50 EMA (cyan). Furthermore, a convincing bearish crossover of these EMAs could impair the near-term buying efforts.
A close below the $25-level could aid near-term selling efforts to test the $23-$24 range in the coming sessions. However, an immediate bounce-back from the $25-zone could delay the bearish tendencies. In this case, the buyers would aim to test the 20 EMA near $26 before a reversal.
FTT Daily Chart
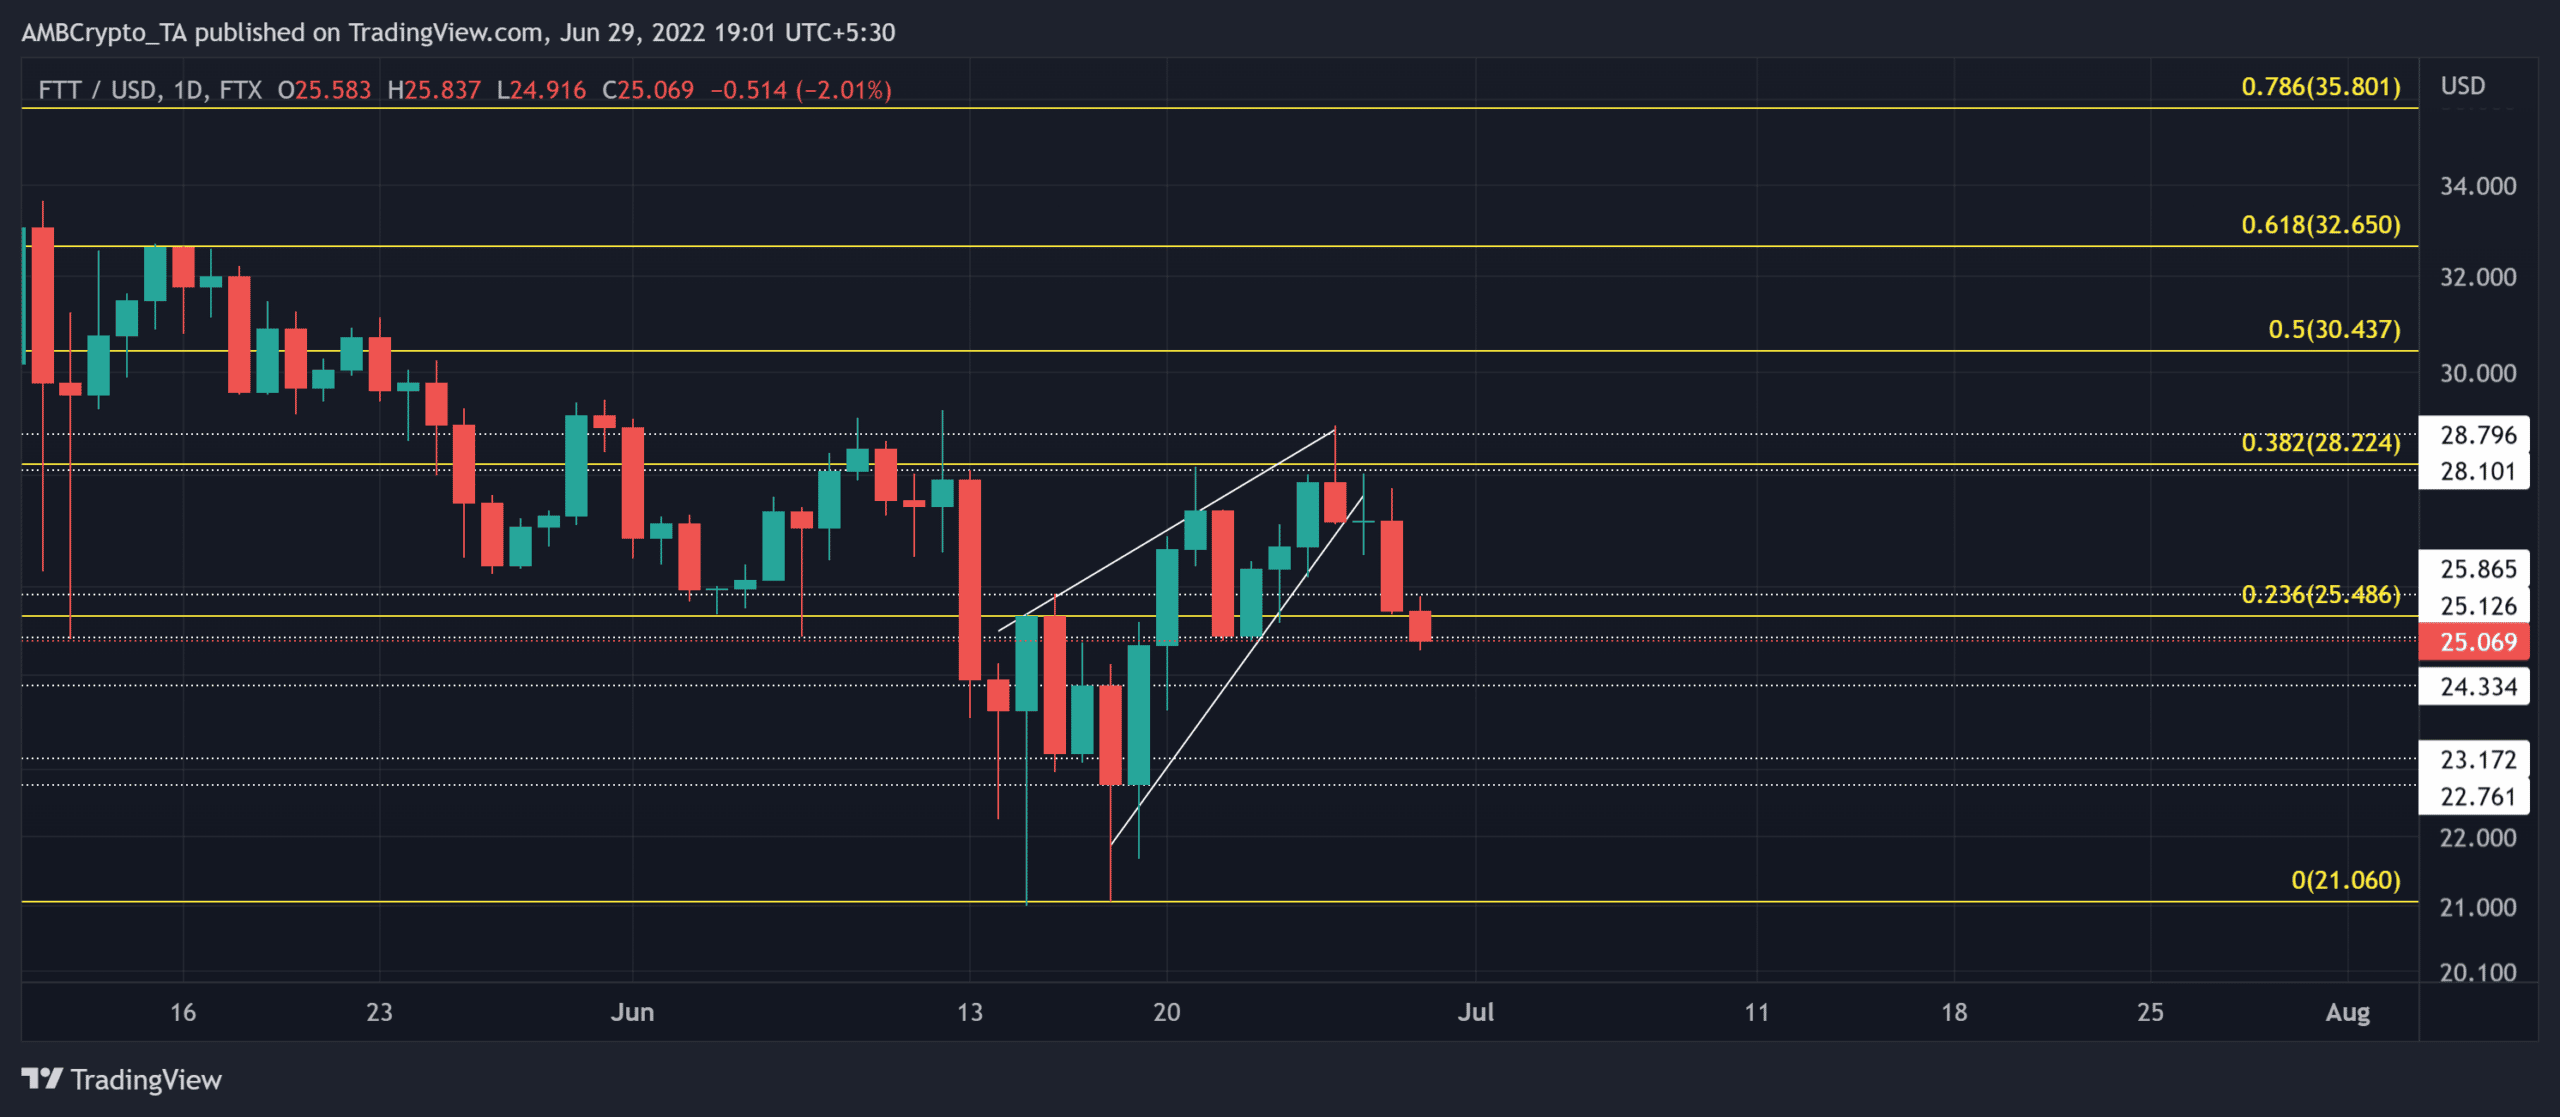
In this timeframe, FTT saw a strong reversal from the 38.2% level. sustained close below the 23.6% level could propel a low volatility phase in the $24-$25 range in the coming days. Thus, the potential shorting targets would remain in the $24-zone. Also, with increasing trading volumes, the 24-hour losses depicted a rather strong bear move.
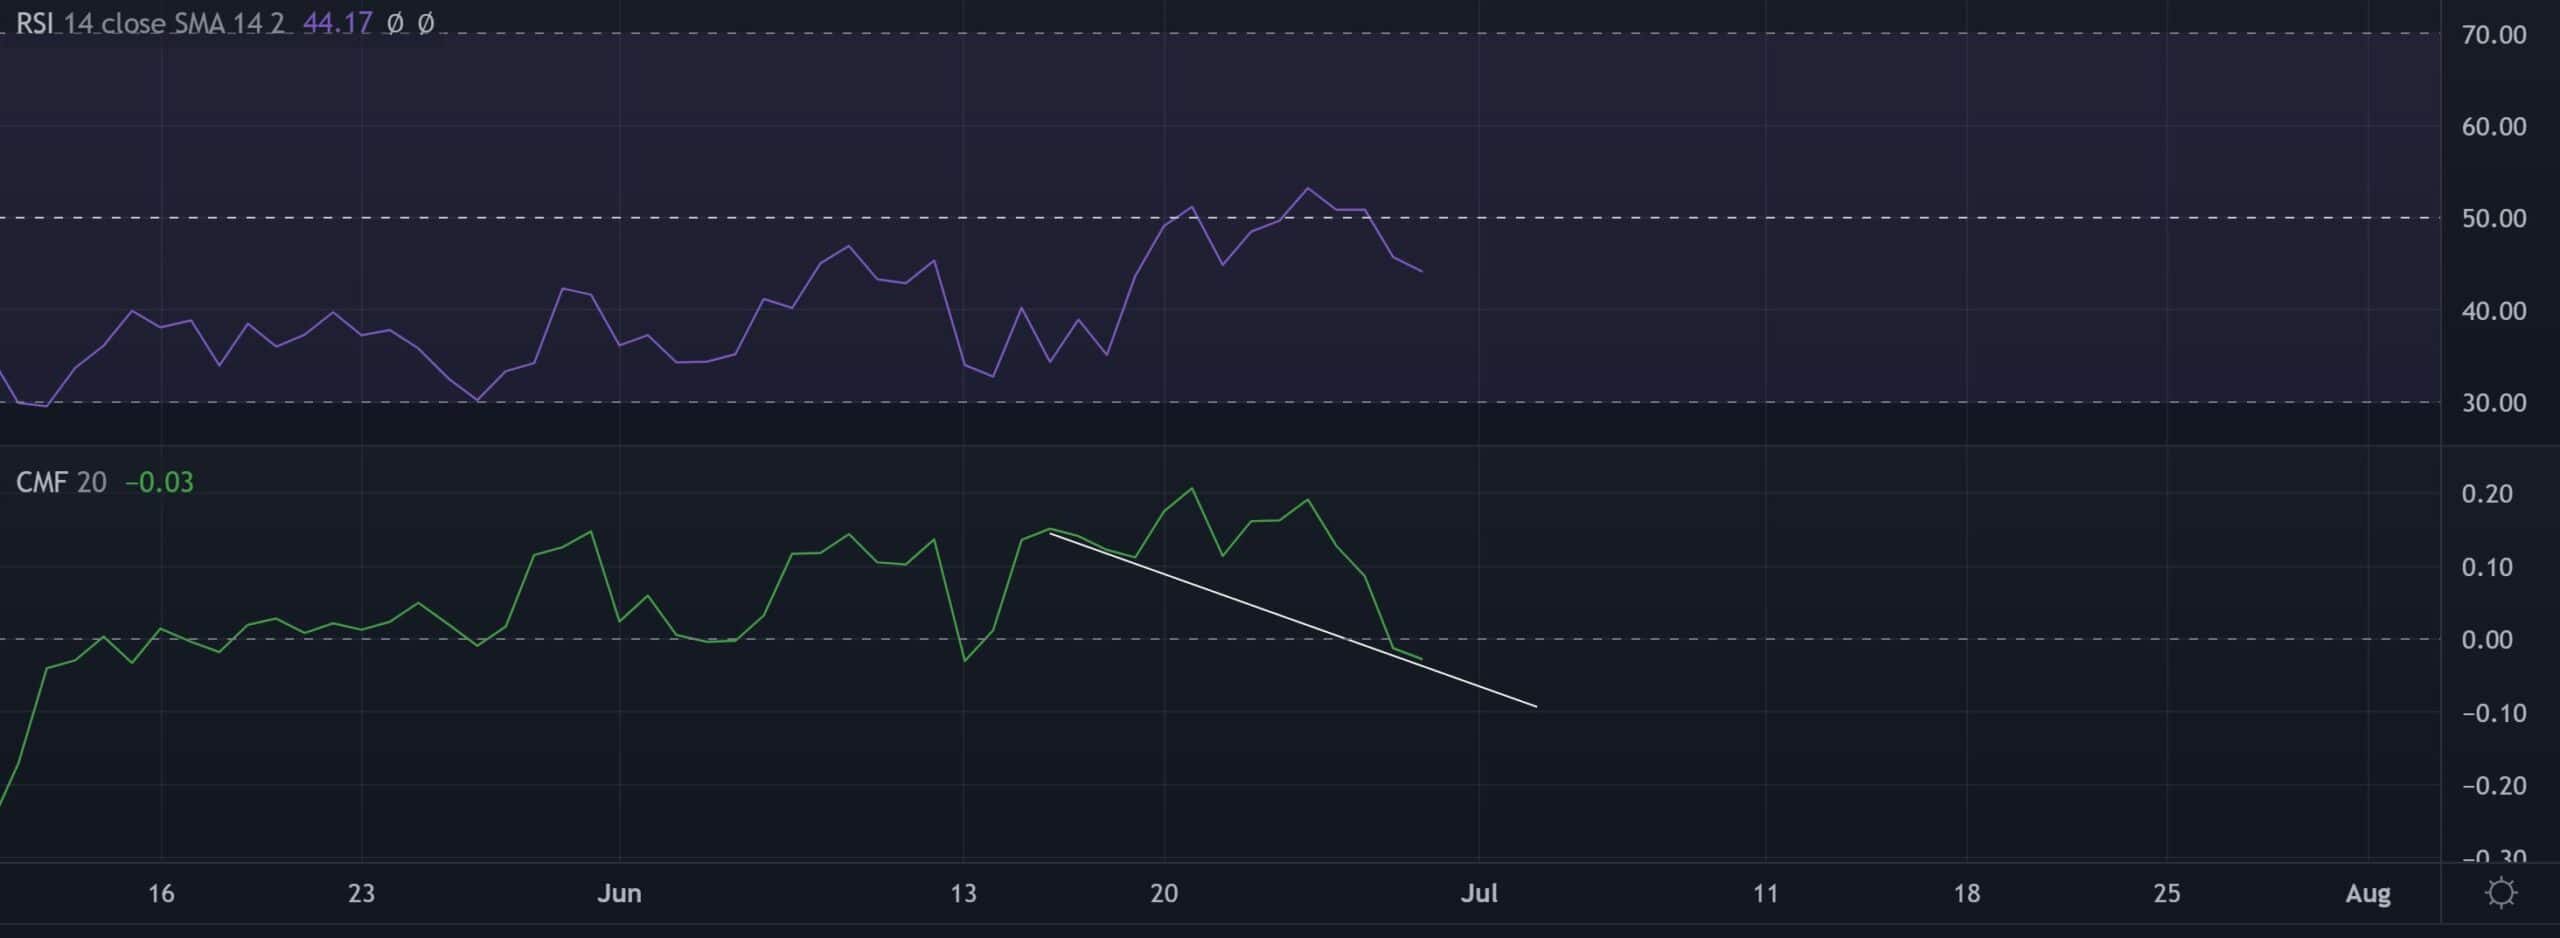
The Relative Strength Index (RSI) plunged below the midline after barely sustaining itself above the 50-mark. Looking at its south-looking tendencies, the buyers still had a long way to alter the broader outlook in their favor.
Also, the CMF dipped below the zero-line and reaffirmed the bearish strength. But any comebacks along its trendline support can aid near-term recovery efforts.
Conclusion
Given the break below the $25-level on the H4 alongside the patterned break and bearish indications on the daily timeframe, FTT could test the $23-$24 range. The targets would remain the same as mentioned above.
Any bearish invalidations should likely find a rebounding region in the $26-zone. Also, investors/traders must keep a close eye on Bitcoin’s movement as FTT shares a 58% 30-day correlation with the king coin.


