As Tezos [XTZ] pushes past $1.66, bulls can consider these levels to book a profit

Disclaimer: The information presented does not constitute financial, investment, trading, or other types of advice and is solely the writer’s opinion.
Tezos [XTZ] has performed decently well over the past month. Both Bitcoin [BTC] and Tezos registered gains of around 25% in July. This highlighted two things. One was the fairly positive correlation between Bitcoin and most of the larger altcoins in the market. The second was a possible lack of conviction among XTZ bulls. In a month when Ethereum [ETH] rose by 70%, Tezos was only able to follow Bitcoin’s lead step for step. Could another leg upward be pending for Tezos?
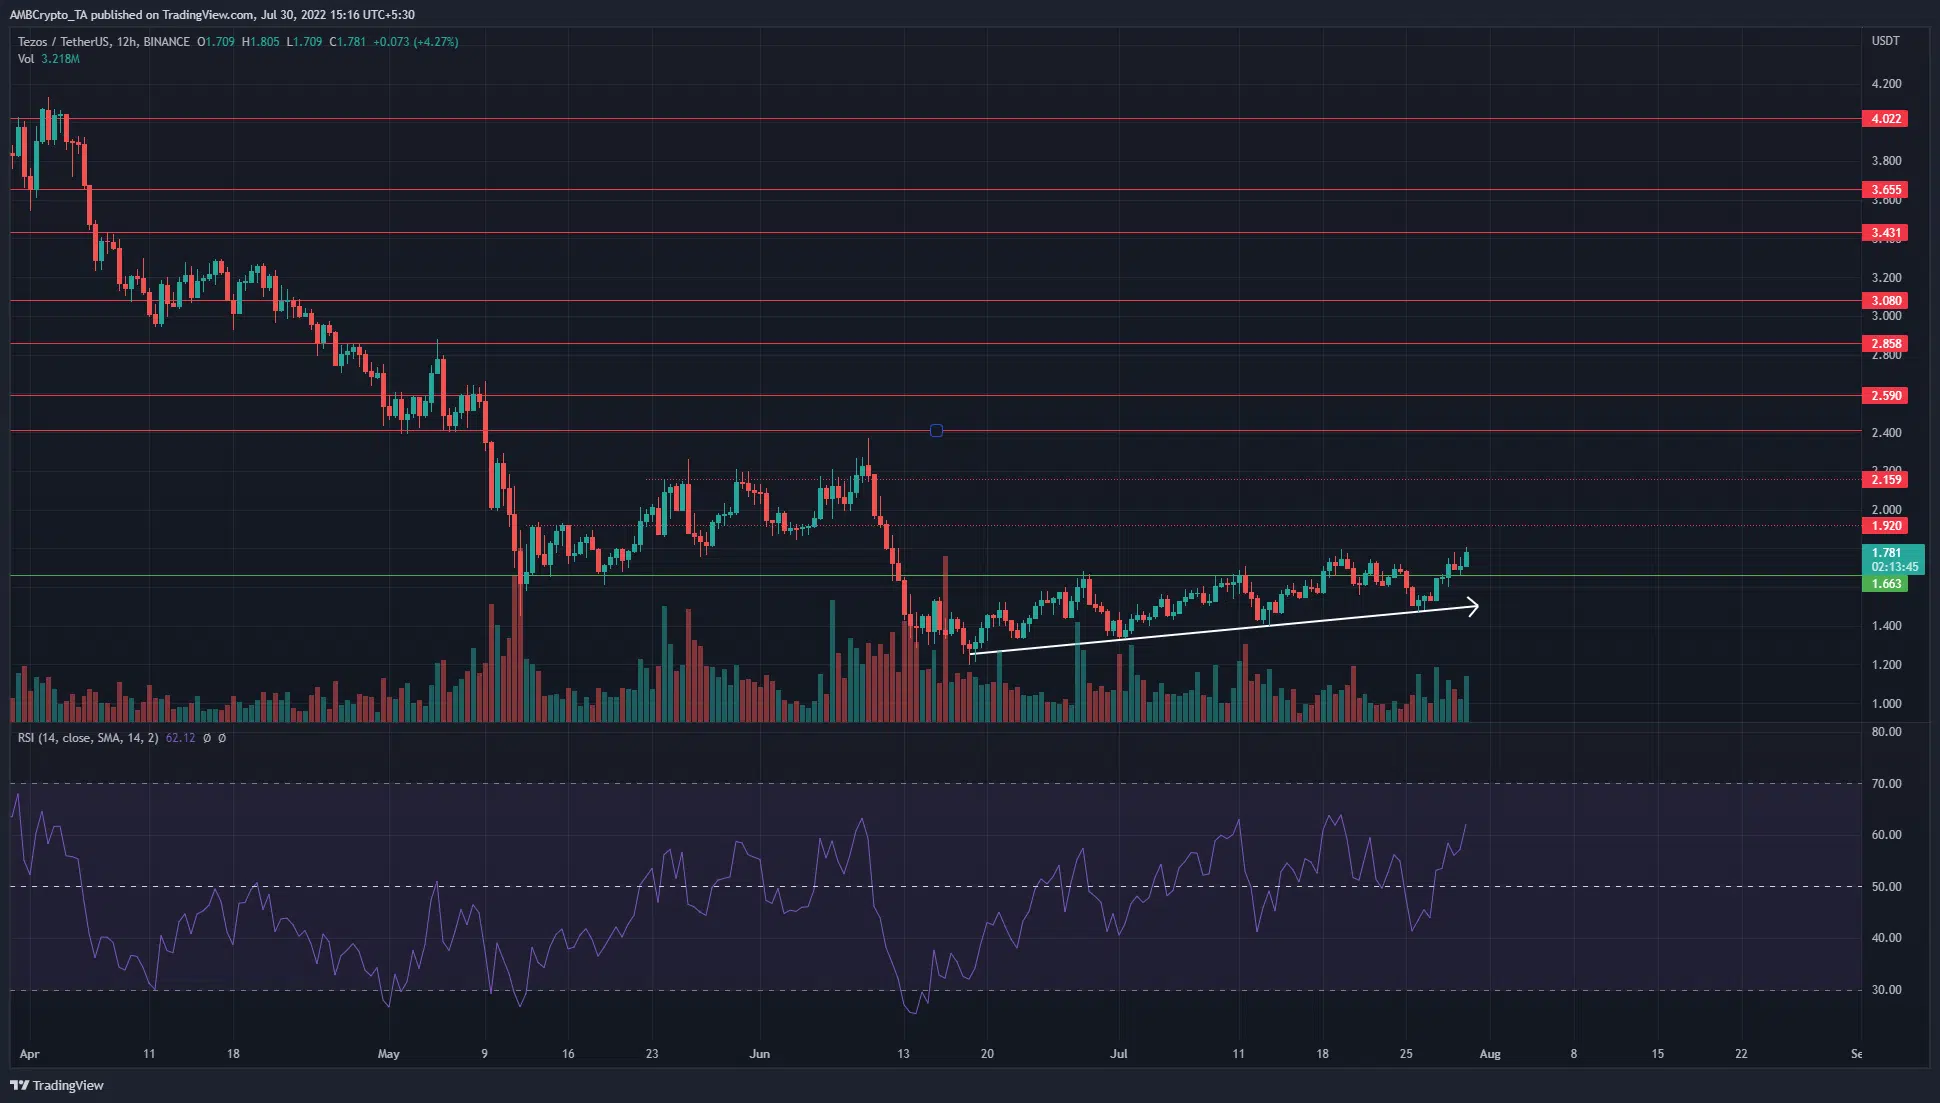
XTZ- 12-Hour Chart
On the 12-hour chart, the series of higher lows that XTZ formed from mid-June was visible. The downtrend from April was also apparent. XTZ has a bullish market structure after breaking above the $1.66 level of former resistance. Yet, that does not mean XTZ can climb back to the previous highs just yet.
Two levels of resistance at $1.92 and $2.15 were highlighted on the chart, and it was likely these levels would offer stubborn opposition to XTZ bulls. The Relative Strength Index (RSI) has oscillated from 45 to 65 throughout July. At the time of writing, the RSI was at 62 and above neutral 50 to suggest an upward trend in progress.
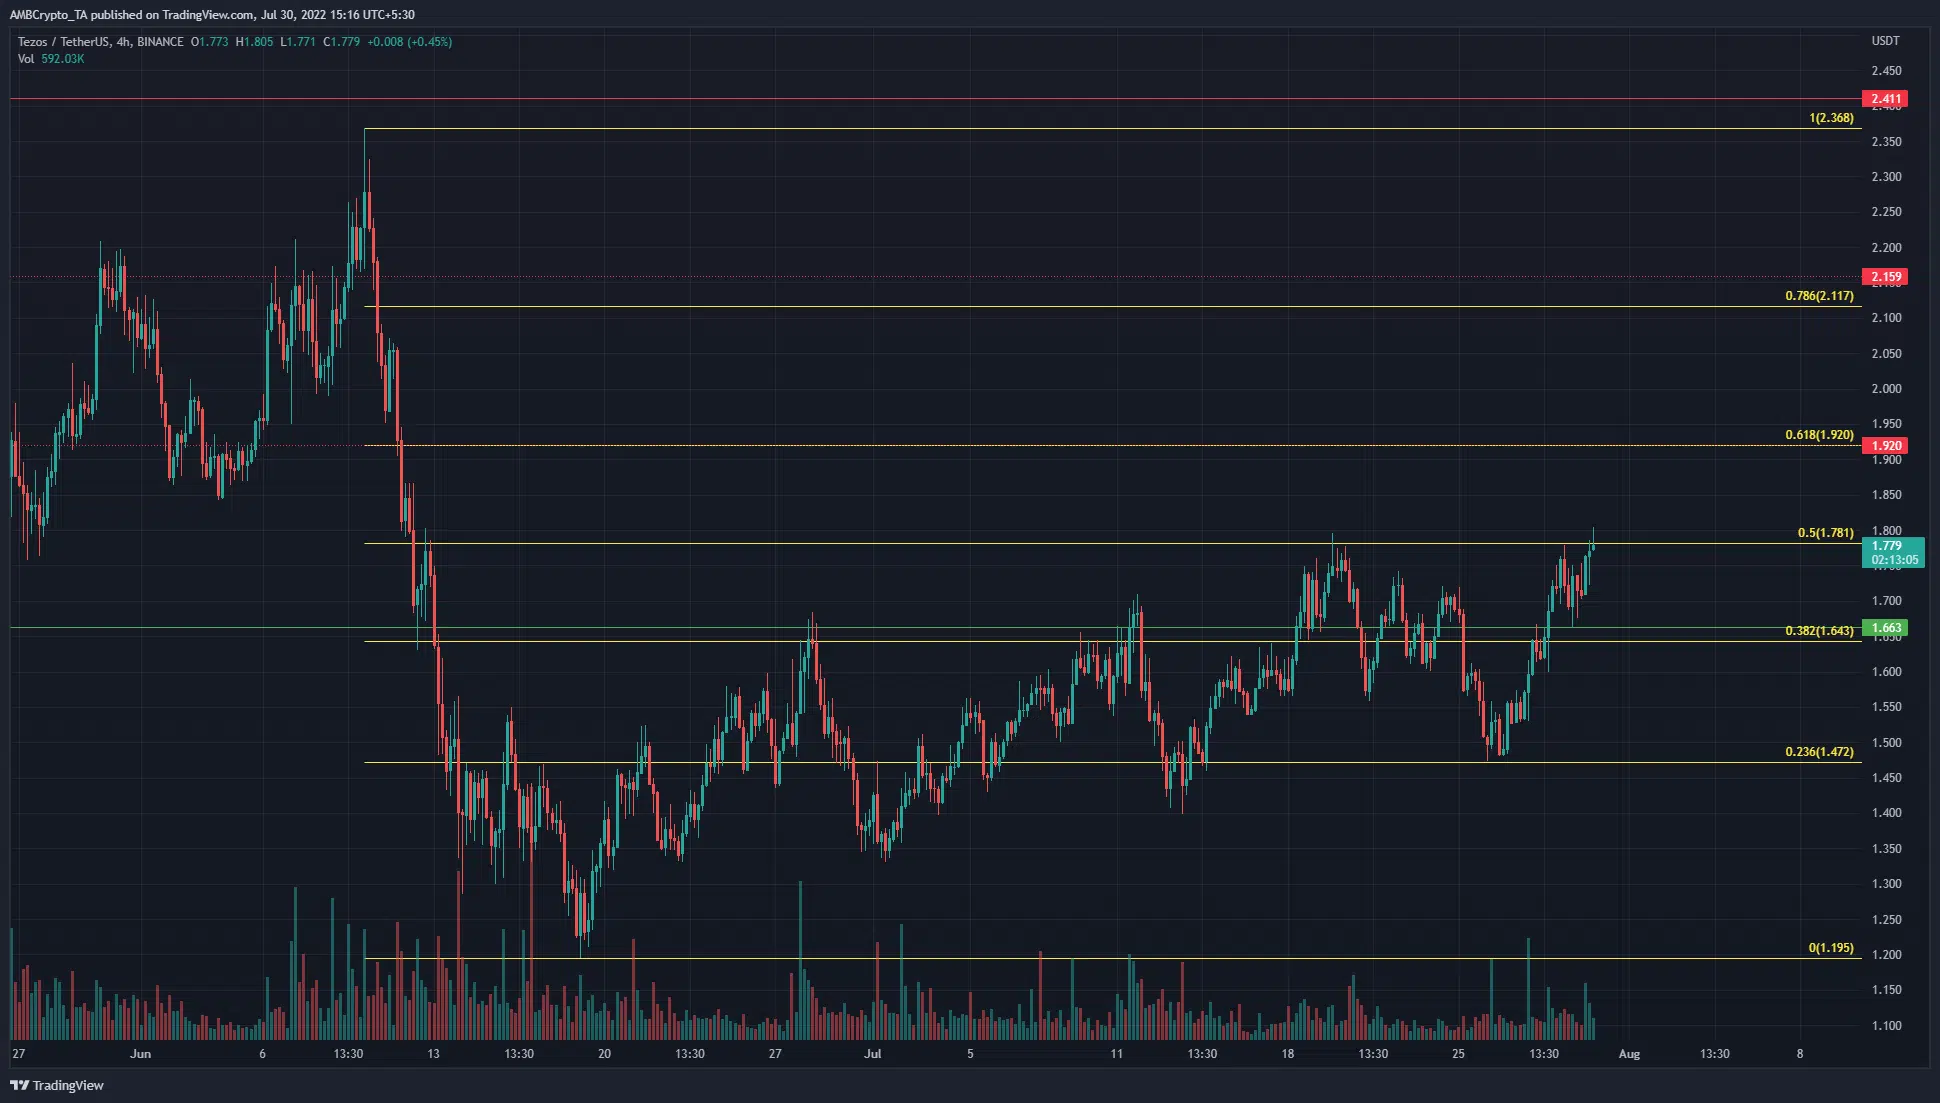
XTZ- 4-Hour Chart
The drop from $2.36 to 1.195 in June was used to draw a set of Fibonacci retracement levels (yellow). The 38.2% level lay at $1.64, close to the horizontal $1.66 level of significance. A retracement past the 38.2% level can reach the 61.8%-78.6% pocket. Generally, a move past the 38.2% level does climb (or drop, based on trend) to the 61.8% level.
In this case, that would be the $1.92 resistance level. Once more the Fibonacci retracement level had good confluence with a horizontal level, with the 78.6% retracement level also close to the $2.15 resistance.
Therefore, if Bitcoin can climb past $24.5k to reach $26k, a move upward for XTZ to these resistance levels can also be expected.
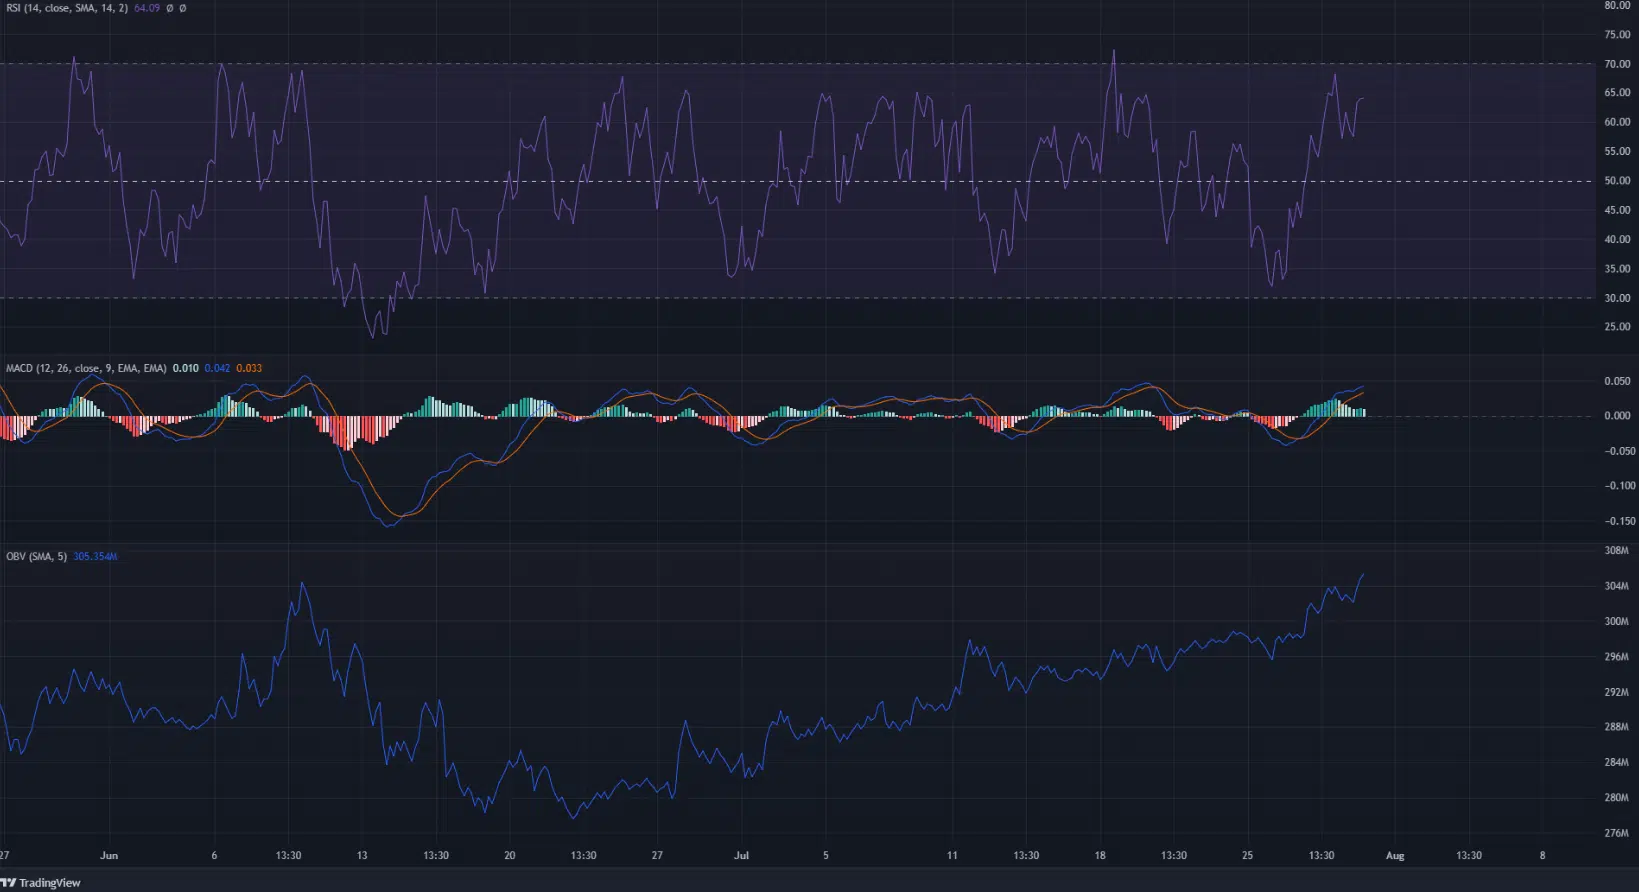
On the four-hour chart as well, the Relative Strength Index (RSI) had a bullish look to it as it climbed back above neutral 50. Yet, it can be observed that over the past few weeks the RSI has not stayed above neutral 50. Hence, even though bullish momentum was on the cards, the trend was not wholly in favor of the buyers.
The Moving Average Convergence Divergence (MACD) also surged above the zero line in the past few days, to underline bullish intent once more. The On-Balance Volume (OBV) also formed a series of higher lows in the past month to show strong buying volume.
Conclusion
The presence of strong buying, alongside the move above $1.66, meant that XTZ had the potential for another leg upward. Yet, Bitcoin approached some resistance at $24.2k-$24.5k, and also at $26k. Rejection in this area could lead to a wave of selling across the market, and Tezos could take a hit as well.


