Chainlink [LINK] buyers must consider this before going long

Disclaimer: The findings of the following analysis are the sole opinions of the writer and should not be considered investment advice
In pursuit of expediting the previous bull run, Chainlink [LINK] buyers provoked a month-long rising wedge rally until mid-August. But the bears found renewed selling pressure at the $9.2 ceiling, as they have for the past three months.
Meanwhile, the price struggled to stay afloat above the daily EMA ribbons. The current pattern could reignite a short-term decline before a buying comeback. At press time, LINK traded at $6.866, down by 5.6% in the last 24 hours.
LINK Daily Chart
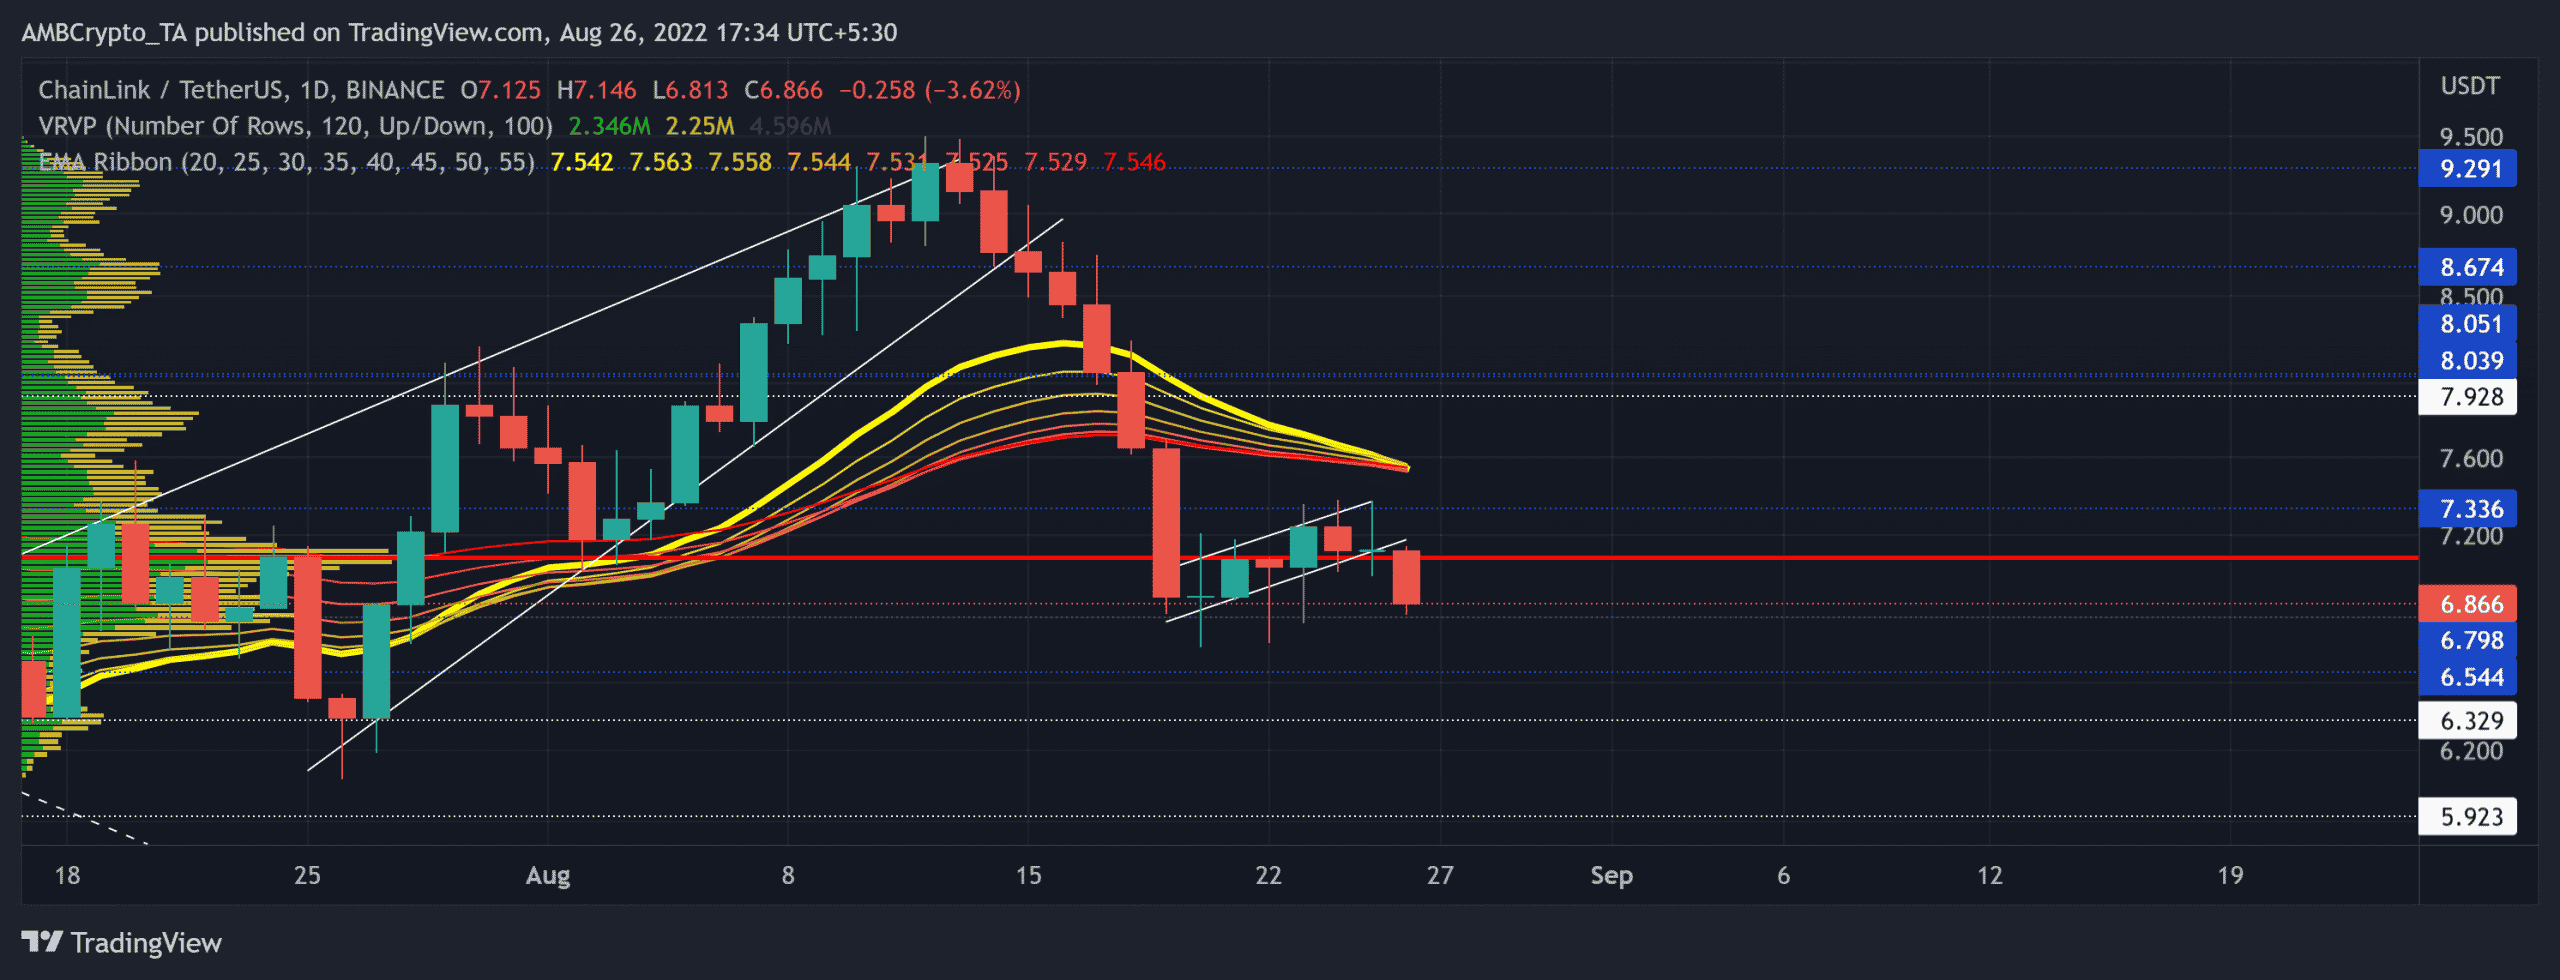
Since diminishing toward its two-year low on 13 June, LINK buyers reclaimed the $8-level. But this rally proved to be momentous after the expected rising wedge breakdown.
Consequently, the price action fell below the EMA ribbons to affirm a selling edge. But with the $6.7-mark support posing a near-term hurdle for sellers, any reversals could induce a relatively slow-moving phase on the chart.
In this case, the price action could hover near the Point of Control (POC, red) for a while before a trend-altering move.
A potential close below the $6.7-level could open gateways for a test of the $6.3-zone. Post which, buyers would strive to maintain their edge. But a compelling bearish crossover on the EMA ribbons can create a market that is conducive for the bears.
Rationale
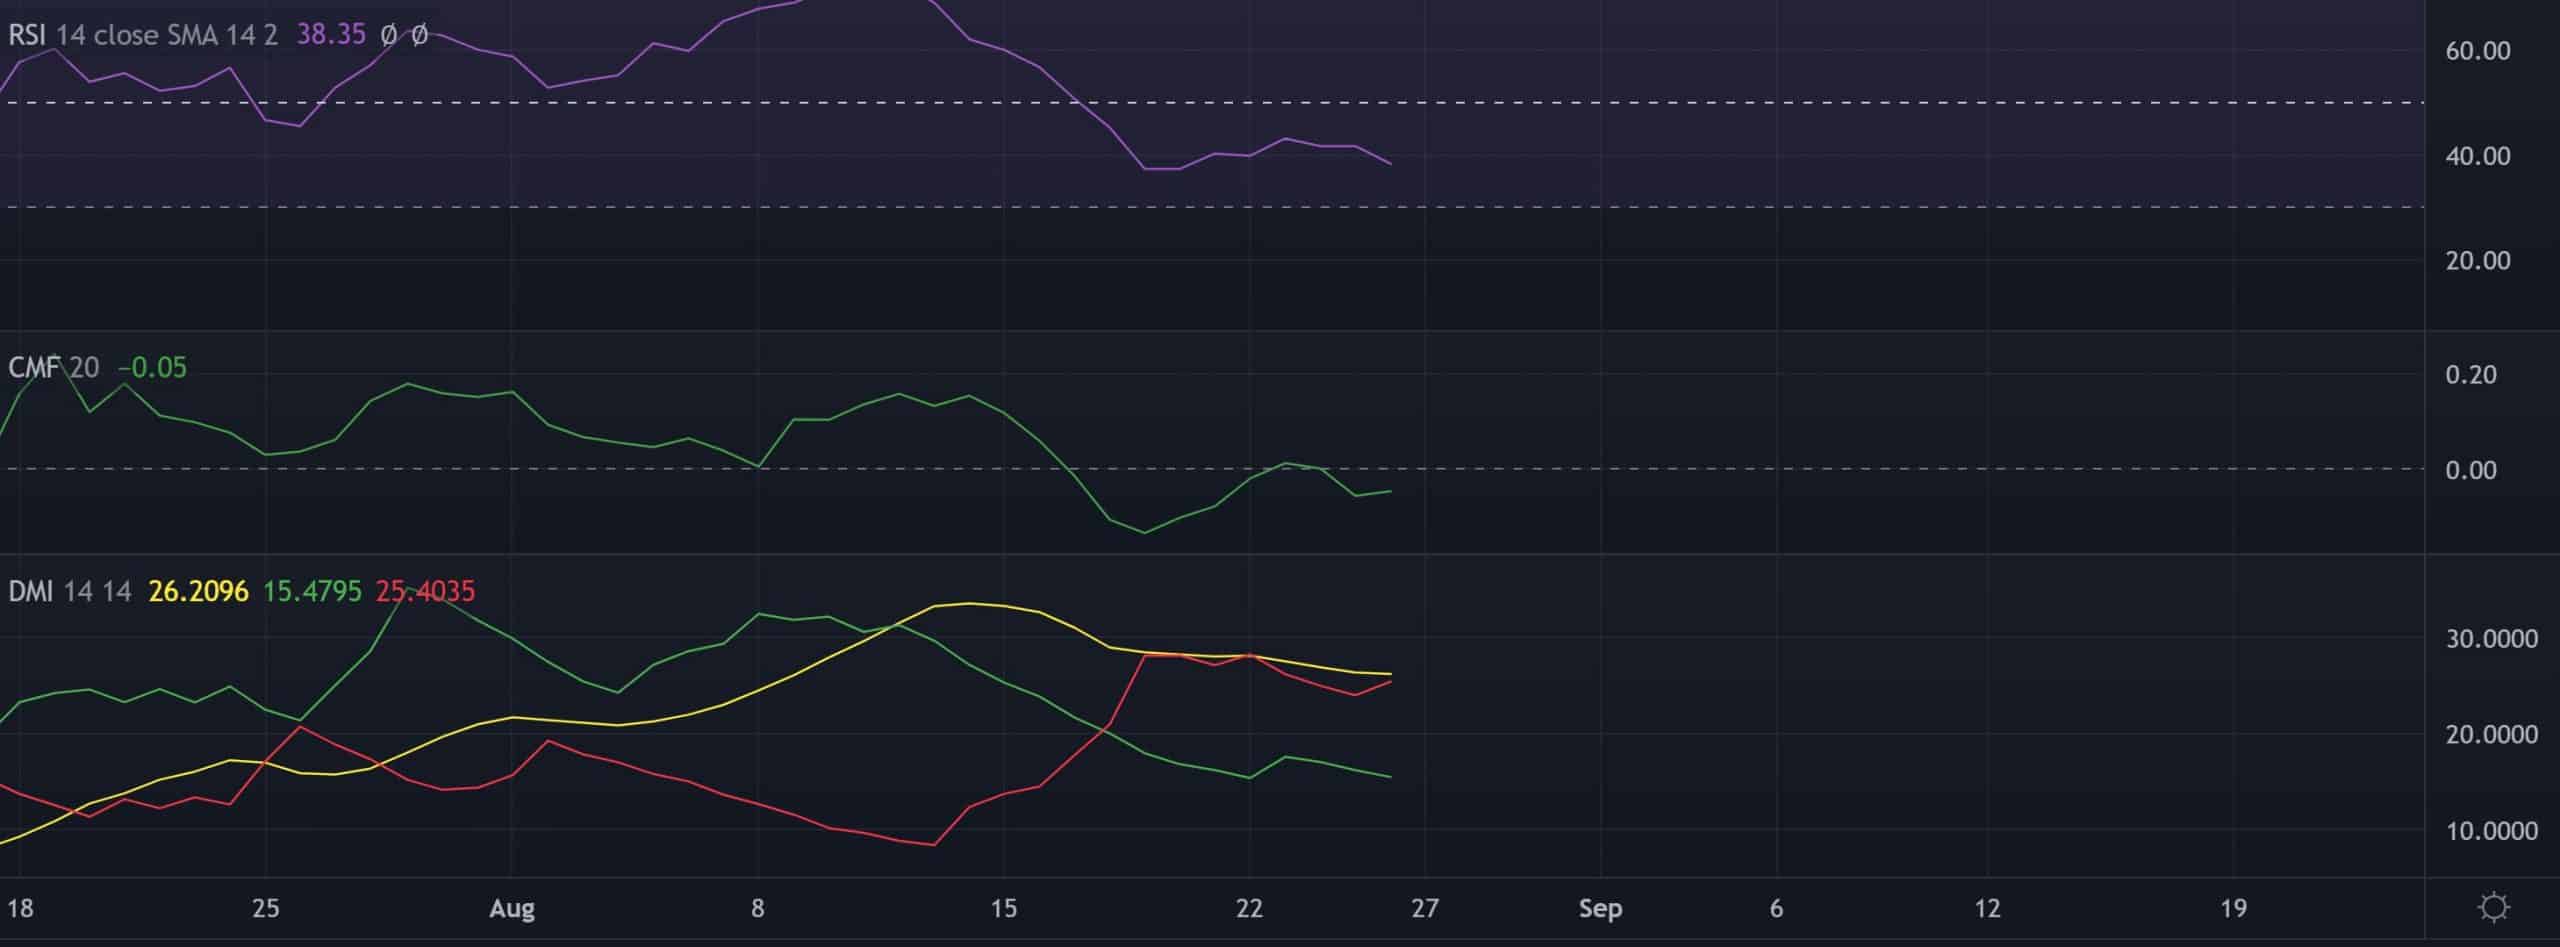
The Relative Strength Index (RSI) entered the bearish region at the time of writing. The index has taken a sideways trajectory and must reclaim its spot above the midline to project a long-term buying advantage.
Further, the Chaikin Money Flow (CMF) echoed the RSI’s weak readings to depict weak buying strength.
A sustained position below the zero mark could slow down the buying pressure.
To top this off, the -DI of the Directional Movement Index (DMI) still looked north. Thus, the buyers must wait for a potential bullish cross with the +DI before taking a long position.
Conclusion
The bearish flag-like setup alongside the weak readings on the indicators and low volumes put LINK in a rather fragile condition. The buyers must step in to defend the $6.7-zone to prevent additional losses. The targets would remain the same as above.
Any bearish invalidations could see a sluggish phase near the POC zone. Finally, an overall market sentiment analysis becomes vital to complement the technical factors to make a profitable move.