Why Bitcoin investors can expect a bull run from this defending zone

Disclaimer: The findings of the following analysis are the sole opinions of the writer and should not be considered investment advice.
- Bitcoin witnessed a patterned breakdown from its long-term trendline resistance.
- The daily active addresses witnessed a substantial plunge but the funding rates show some improvement.
Over the last seven months, Bitcoin [BTC] struggled to move past its trendline resistance (white, dashed) while affirming a robust bearish edge. The king coin saw a relatively dull phase post an expected breakdown from its bearish pattern over the last few days.
Here’s AMBCrypto’s price prediction for Bitcoin [BTC] for 2023-24
The heightened selling pressure has refrained the 20 EMA (red) and the 50 EMA (cyan) from looking north. Given BTC’s recent rebounding tendencies $18.4k-$18.7k range, buyers would look to stop the bleeding in the coming sessions.
At press time, BTC was trading at $18,431.39, down by 3.53% in the last 24 hours.
After a bearish flag breakdown, can BTC float above its support range?

At the time of writing, BTC was striving to revive from its multi-yearly support zone in the $18.4K-$18.7K range. Should this range continue to uphold value in buyers’ minds, the coin could see a near-term revival toward the Point of Control (POC, red) level in the coming sessions.
This revival could extend the squeeze phase near the high liquidity range. In this case, the first major resistance for the coin would lie in the $19.3K zone. A plausible close above this barrier could pave a path in retesting the $20.3K ceiling.
But a sustained close below the $18.4K-mark could expose BTC to a test of its first major support level at the $17.6K level. Additionally, as BTC entered a low liquidity zone, it could potentially witness high volatility moves in the coming times.
Furthermore, The Accumulation/distribution’s higher troughs over the last few days marked a bullish divergence with the price action.
An improved funding rate alongside a plunge in active addresses
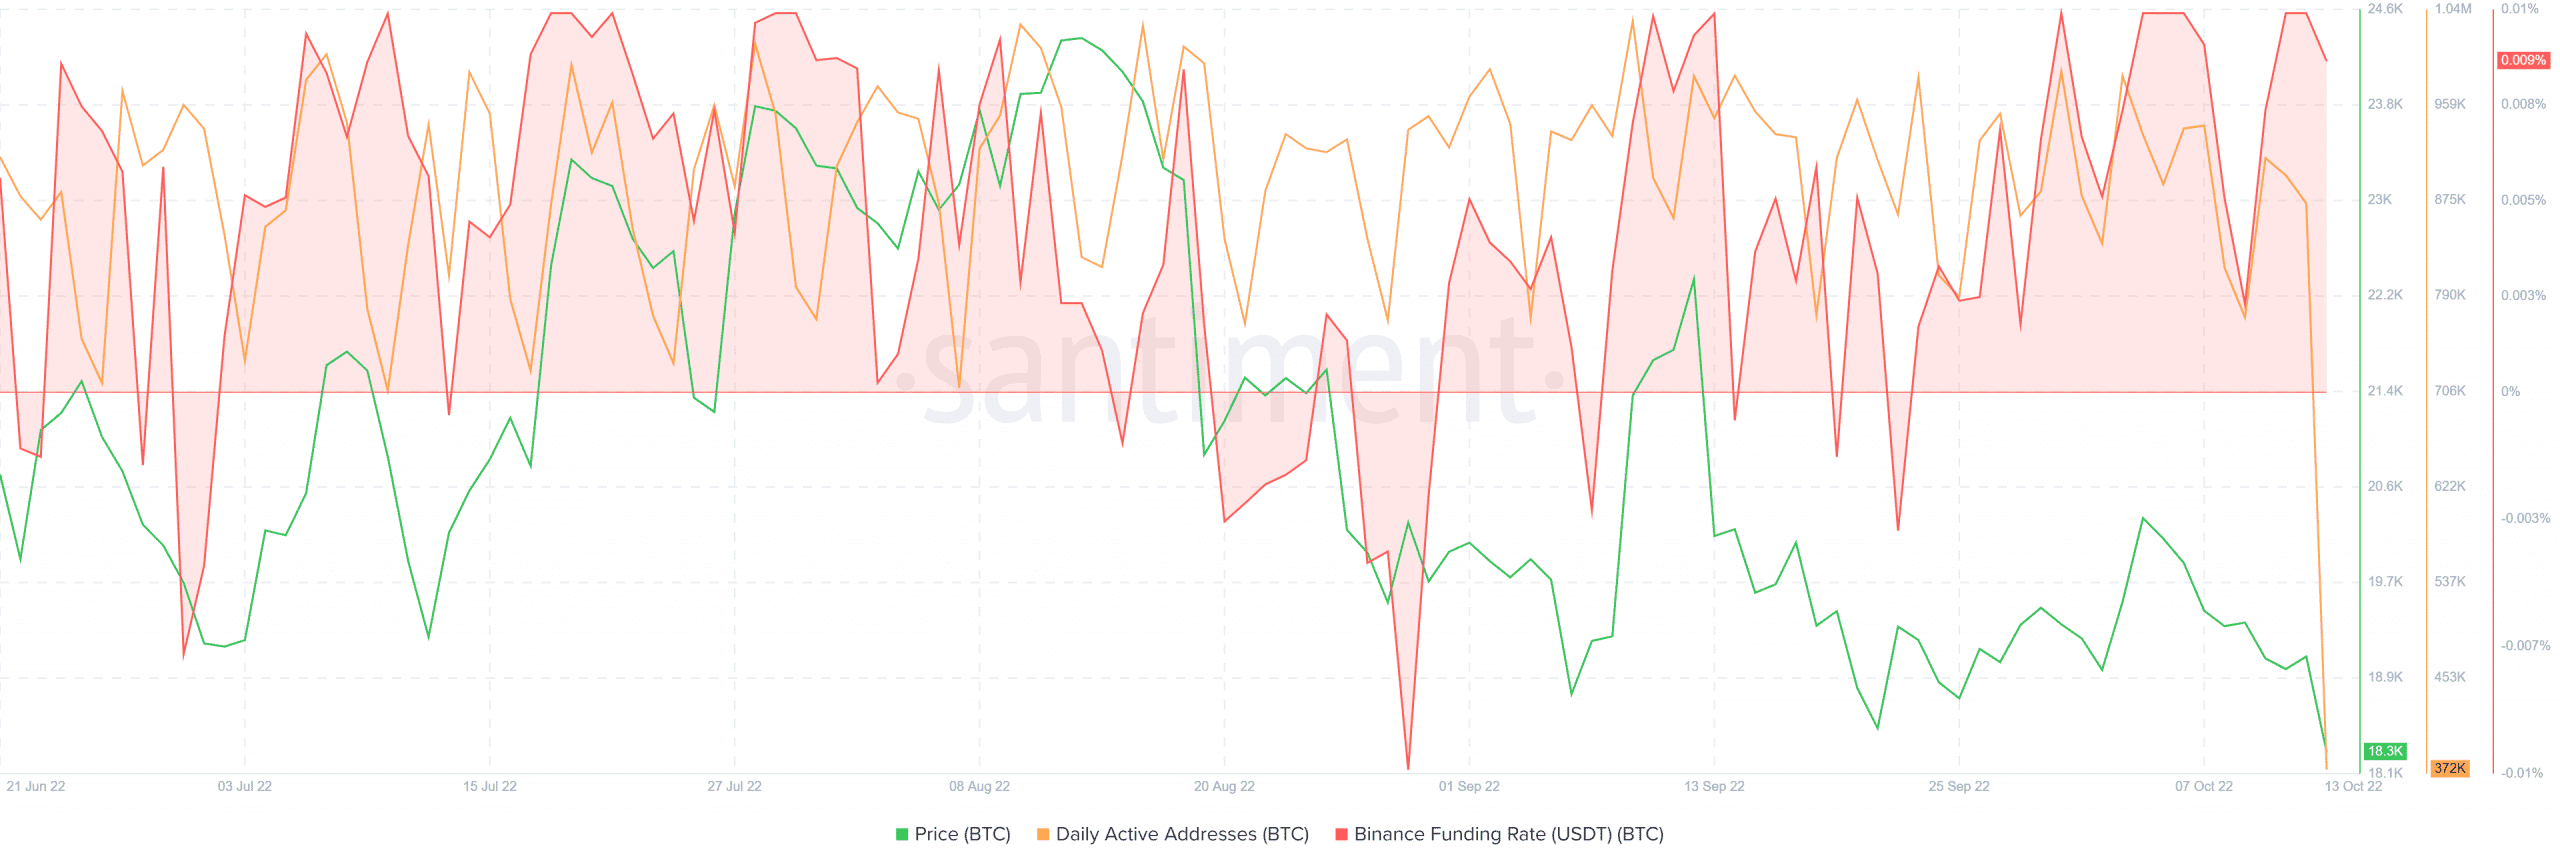
For a few months, BTC’s daily active addresses took a sideways trajectory while historically displaying a slight correlation with the price action. Over the last few hours, this count fell to its multi-yearly low as evidenced by the major dip on the chart.
But the king coin’s funding rate on Binance continued to mark a slight uptick as it remained above zero to display a slight bullish bias. The buyers should look for a decline in these rates to gauge the chances of a bearish pull.
The triggers and targets would remain the same as discussed. Also, investors/traders should factor in macro-economical factors affecting the broader sentiment. This analysis will help them increase the chances of a profitable bet.