What Chainlink [LINK] bulls need to be wary of before timing entries

Disclaimer: The findings of the following analysis are the sole opinions of the writer and should not be considered investment advice.
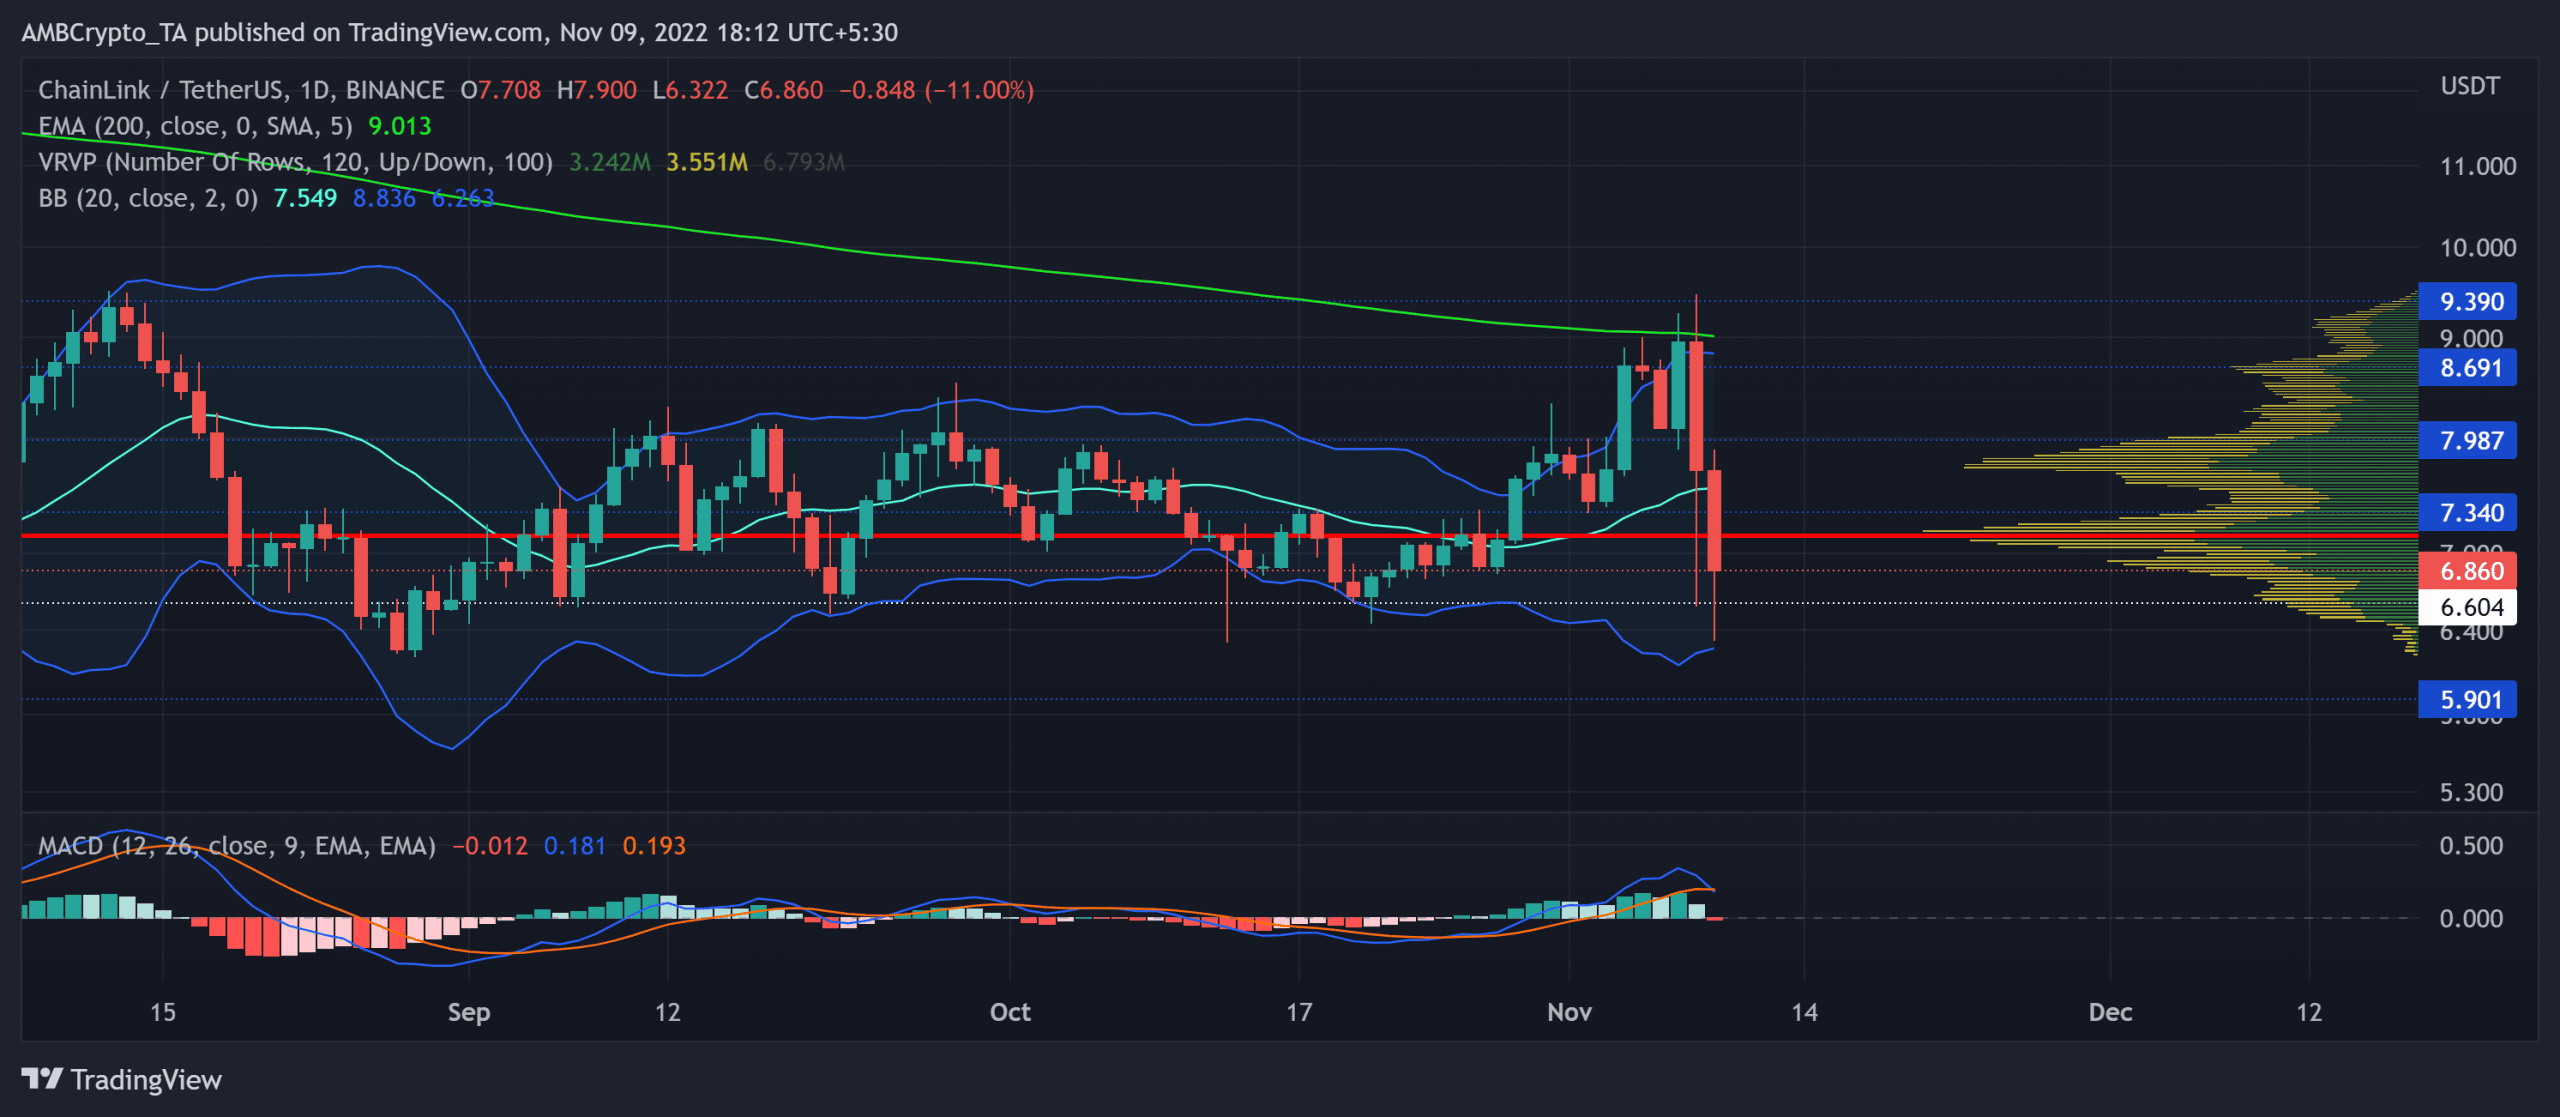
- Chainlink registered double-digit losses over the past day while falling below the basis line of its Bollinger Bands.
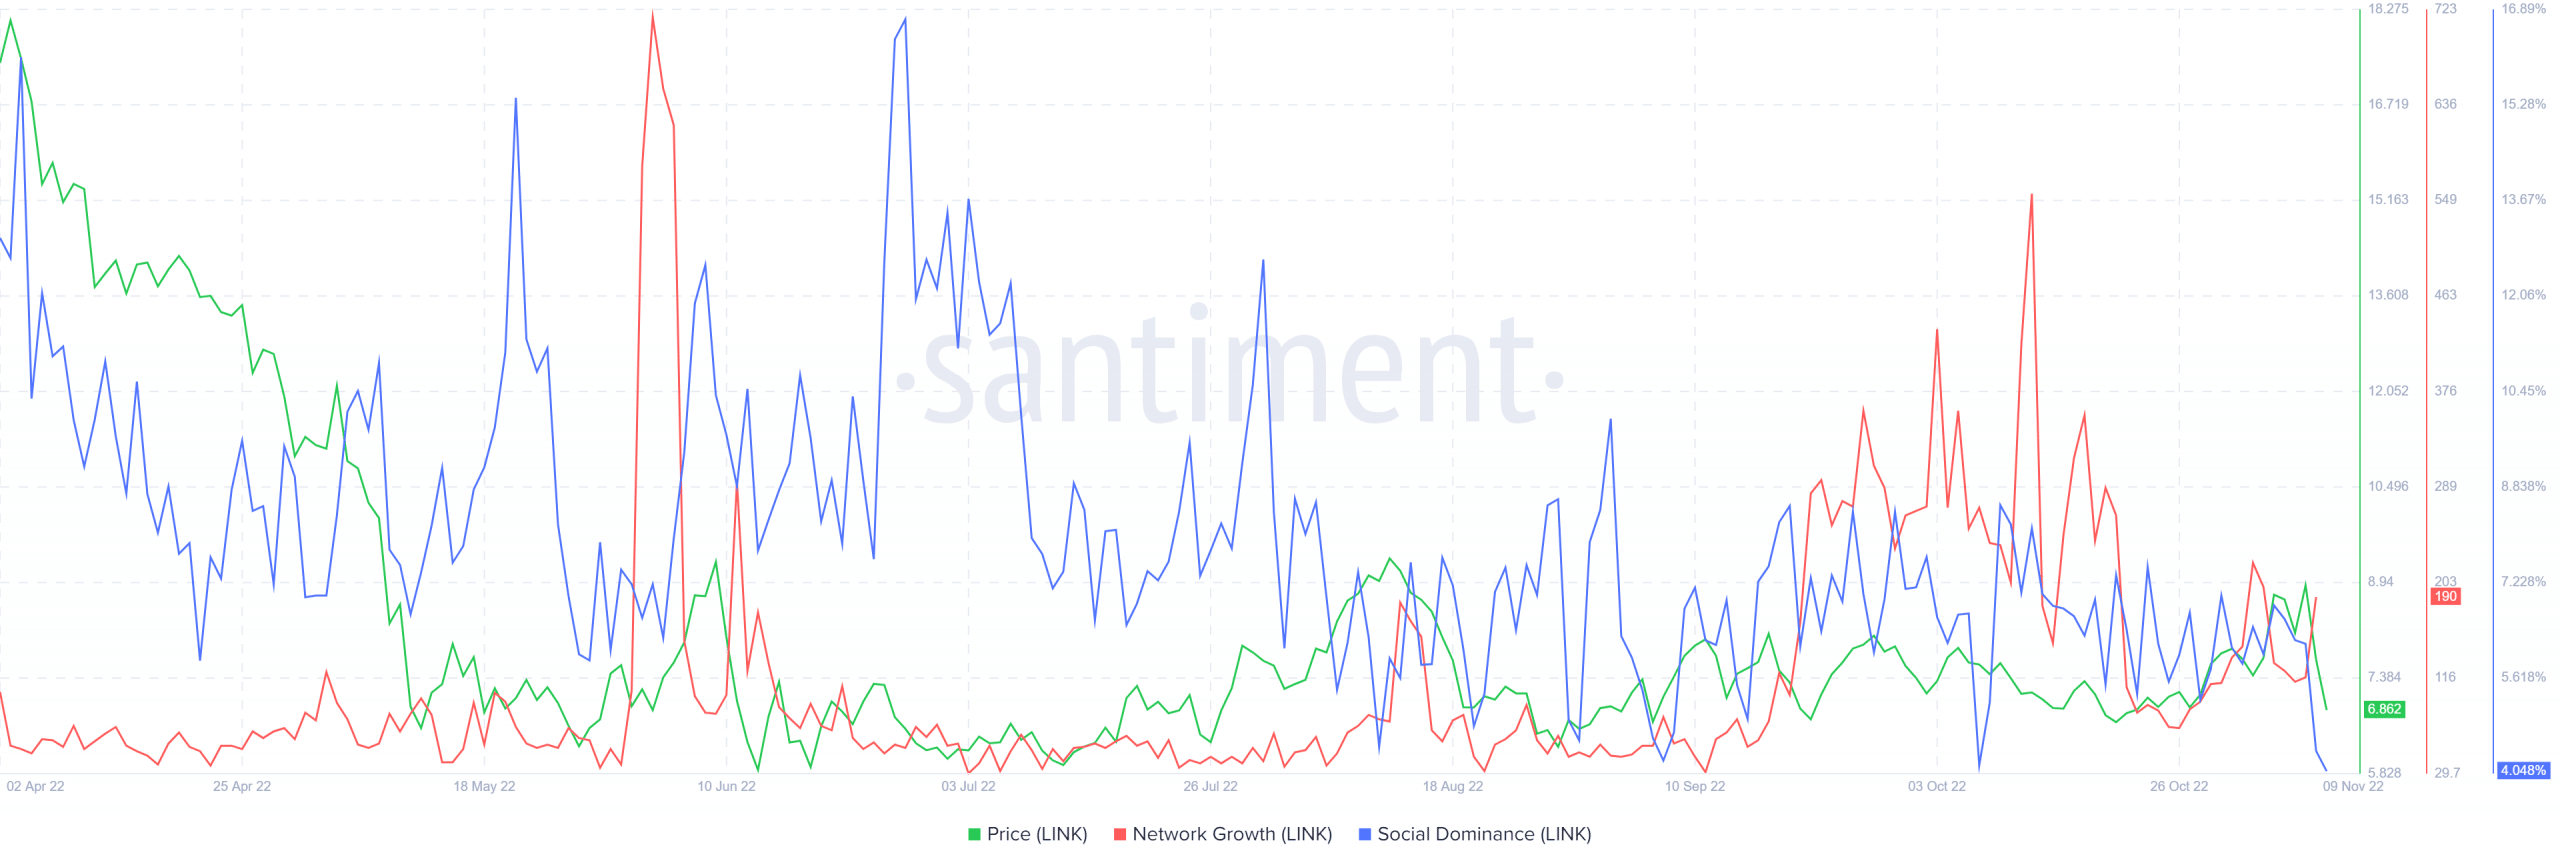
- LINK’s social dominance and network growth corroborated with the market-wide bearishness.
After reversing from the 200 EMA (green) on 8 November, Chainlink [LINK] sellers were quick to induce a rebound toward the lower band of the Bollinger Bands (BB).
Read price prediction for Chainlink [LINK] for 2023-24
While the price kept traversing just above the $6.6 support, the buyers would aim to look for rebounding opportunities. The ongoing selling spree could strive to settle before a bullish rebuttal in the coming sessions.
At press time, LINK traded at $6.86, down by 22.57% in the last 24 hours.
Can the immediate support level reignite a near-term revival?
Since declining toward its multi-yearly lows near the $5.9 support zone in mid-July, LINK buyers strived to find newer highs. The 200 EMA has constricted the buying endeavors in the daily timeframe since the beginning of this year.
In the wake of a nearly two-month compression in the $6.6-$8 range, the altcoin finally entered a high volatility phase. The recent bull run saw an expected reversal from the 200 EMA and the upper band of the BB. Consequently, LINK fell below the basis line of BB to affirm a change in momentum toward the sellers.
Should the buyers hold up the psychological support level at the $6.6-mark, an immediate recovery can aid the bulls in rallying LINK toward the $7.3-$7.9 range in the coming sessions. The price action could hover near the Point of Control (POC, red) for a while before a trend-altering move.
A potential close below the $6.6-level could open gateways for a test of the lower band of the BB followed by the $5.9 baseline.
In the meantime, the Moving Average Convergence Divergence (MACD) undertook a bearish crossover on the daily chart. But the lines still swayed above the zero mark. Such historical crossovers above the equilibrium encouraged near-term pulldowns.
Social Dominance and Network Growth point toward this
According to data from Santiment, since mid-October, the token marked a sharp slump in its Network Growth and Social Dominance on a daily basis. However, in late October its price action registered growth while diverging with these metrics.
Should Bitcoin continue to deteriorate in the coming sessions, LINK buyers may find it difficult to improve its social dominance in the coming days. Moreover, LINK shared a 66% 30-day correlation with the king coin. A close eye on Bitcoin’s movement would be imperative to make a profitable move.
Nonetheless, the targets would remain the same as discussed.


