DOT investors can be in a state of frenzy despite Polkadot’s latest achievements

- DOT held the #1 rank on the list of cryptos with the highest Nakamoto Coefficient metric
- However, other DOT metrics and market indicators showed a bearish picture
Polkadot [DOT] was in the news again as it managed to gain the #1 rank on this list of cryptocurrencies with the highest Nakamoto Coefficient metric. The Nakamoto Coefficient shows the number of validators (nodes) required to successfully slow down or prevent any particular blockchain from operating as intended.
The higher the Nakamoto Coefficient in relation to the total number of validators, the less likely a decentralized blockchain is to be disrupted by collusion. Apart from DOT, Avalanche [AVAX] and Solana [SOL] made it to the top three on the list.
NC metric minimum number of validators required to make up 33.3% of network staking share to prevent a bad validator from manipulating transactions. The higher value means higher decentralization 🔥
And @Polkadot is ranked #1
Details 👉 https://t.co/RFm2gfZGzp #Polkadot $DOT pic.twitter.com/BAYfKWE9FU— Polkadot Insider 🐂⭕️ (@PolkadotInsider) January 15, 2023
How much are 1,10,100 DOTs worth today?
More to be merry about…
In addition to the aforementioned information, Polkadot nomination pools hit another milestone only two months after its launch. According to the official tweet, pool members have bonded over 1,000,000 DOT.
To give more context, Polkadot nomination pools make it easier to stake natively by lowering the barrier for earning rewards to as little as 1 DOT, and efficiently balancing the interests of smaller and larger DOT holders.
1/ Polkadot nomination pools have hit another milestone – just 2 months after launch, more than 1,000,000 DOT has been bonded by pool members!
Check the 🧵 to learn more about Polkadot nomination pools and how to stake natively on Polkadot.
To start staking now 👇
— Polkadot (@Polkadot) January 13, 2023
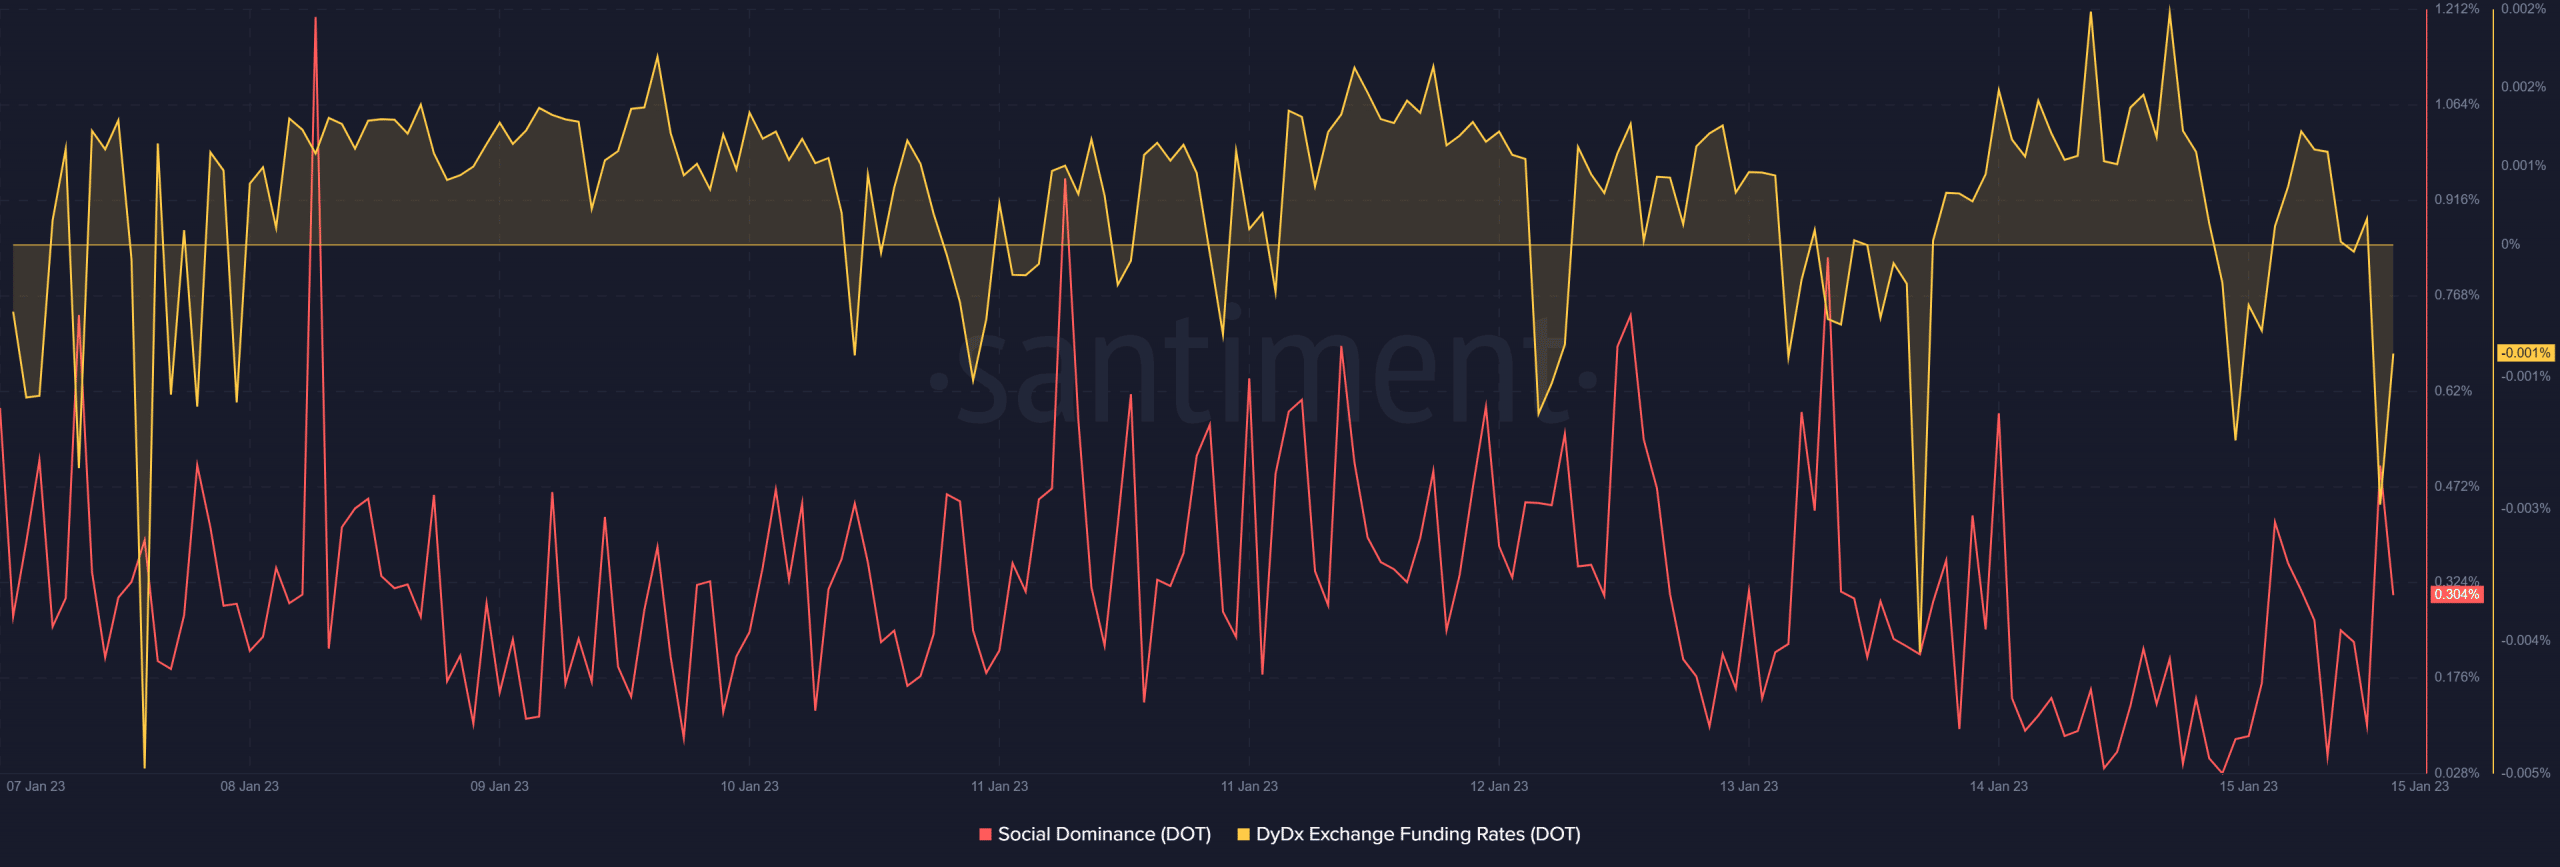
However, despite these updates, DOT preferred to stay away from the limelight especially on the price front. DOT failed generate any significant demand in the futures market as its DyDx funding rate registered a decline on 15 January.
Interestingly, Polkadot topped the list of cryptocurrencies in terms of social activity on 14 January. However, Santiment’s chart told the opposite story as DOT’s social dominance went down over the last week.
Another major bearish signal was revealed by CryptoQuant, as it showed that DOT’s Relative Strength Index (RSI) was in an oversold position. This could pull DOT’s price down in the coming days.
Is your portfolio green? Check out the Polkadot Profit Calculator
What next for DOT?
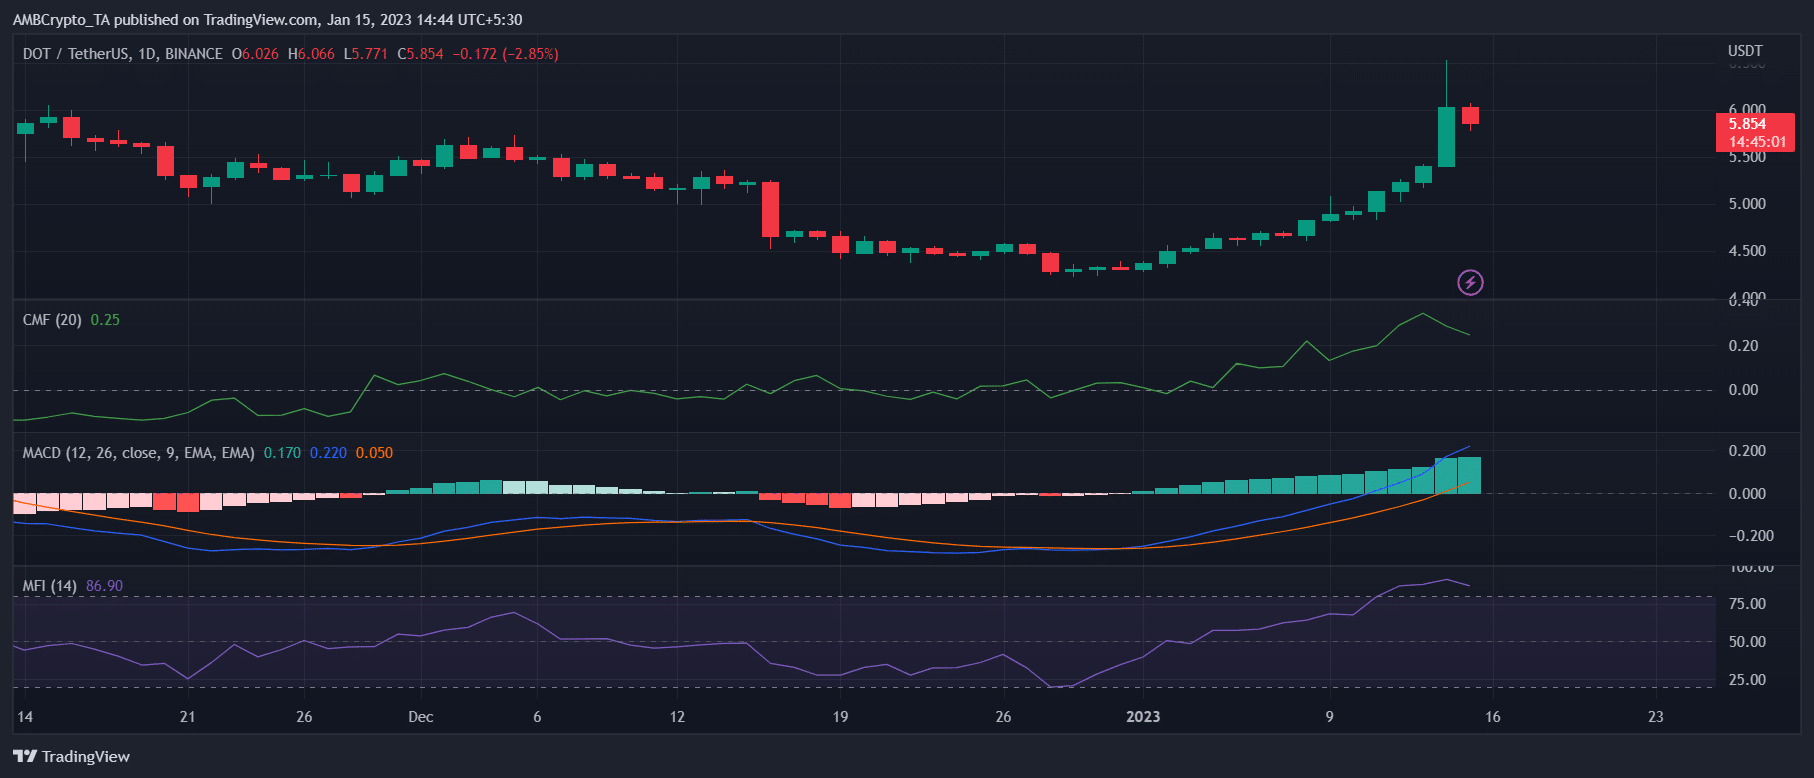
DOT’s daily chart also painted a bearish picture, thus strengthening the possibility of a price decline. The Money Flow Index (MFI) was in the overbought zone, which was a bearish signal.
Moreover, the Chaikin Money Flow (CMF) also registered a downtick, further increasing the chances of a price fall. Nonetheless, the Moving Average Convergence Divergence (MACD) stood in favor of the bulls.