Tezos [XTZ] holders can expect price drawback this week, here’s why
![Tezos [XTZ] holders can expect price drawback this week, here's why](https://ambcrypto.com/wp-content/uploads/2023/01/nick-fewings-zF_pTLx_Dkg-unsplash-1.jpg)
- XTZ’s price has rallied by 61% since the year began.
- Daily chart readings, however, revealed that a price correction might be imminent.
According to data from the cryptocurrency price tracking platform CoinMarketcap, Tezos native coin XTZ ranked as one of the best-performing crypto assets in the last 24 hours.
Exchanging hands at $1.17, the altcoin’s price rallied by 4% during that period. In the last week, XTZ’s price also grew by 4%.
While bullish sentiment lingers in the market at press time, a closer assessment of XTZ’s performance on a daily chart revealed that a price drop might take place in the coming week.
Realistic or not, here’s XTZ’s market cap in BTC’s terms
Brace for impact
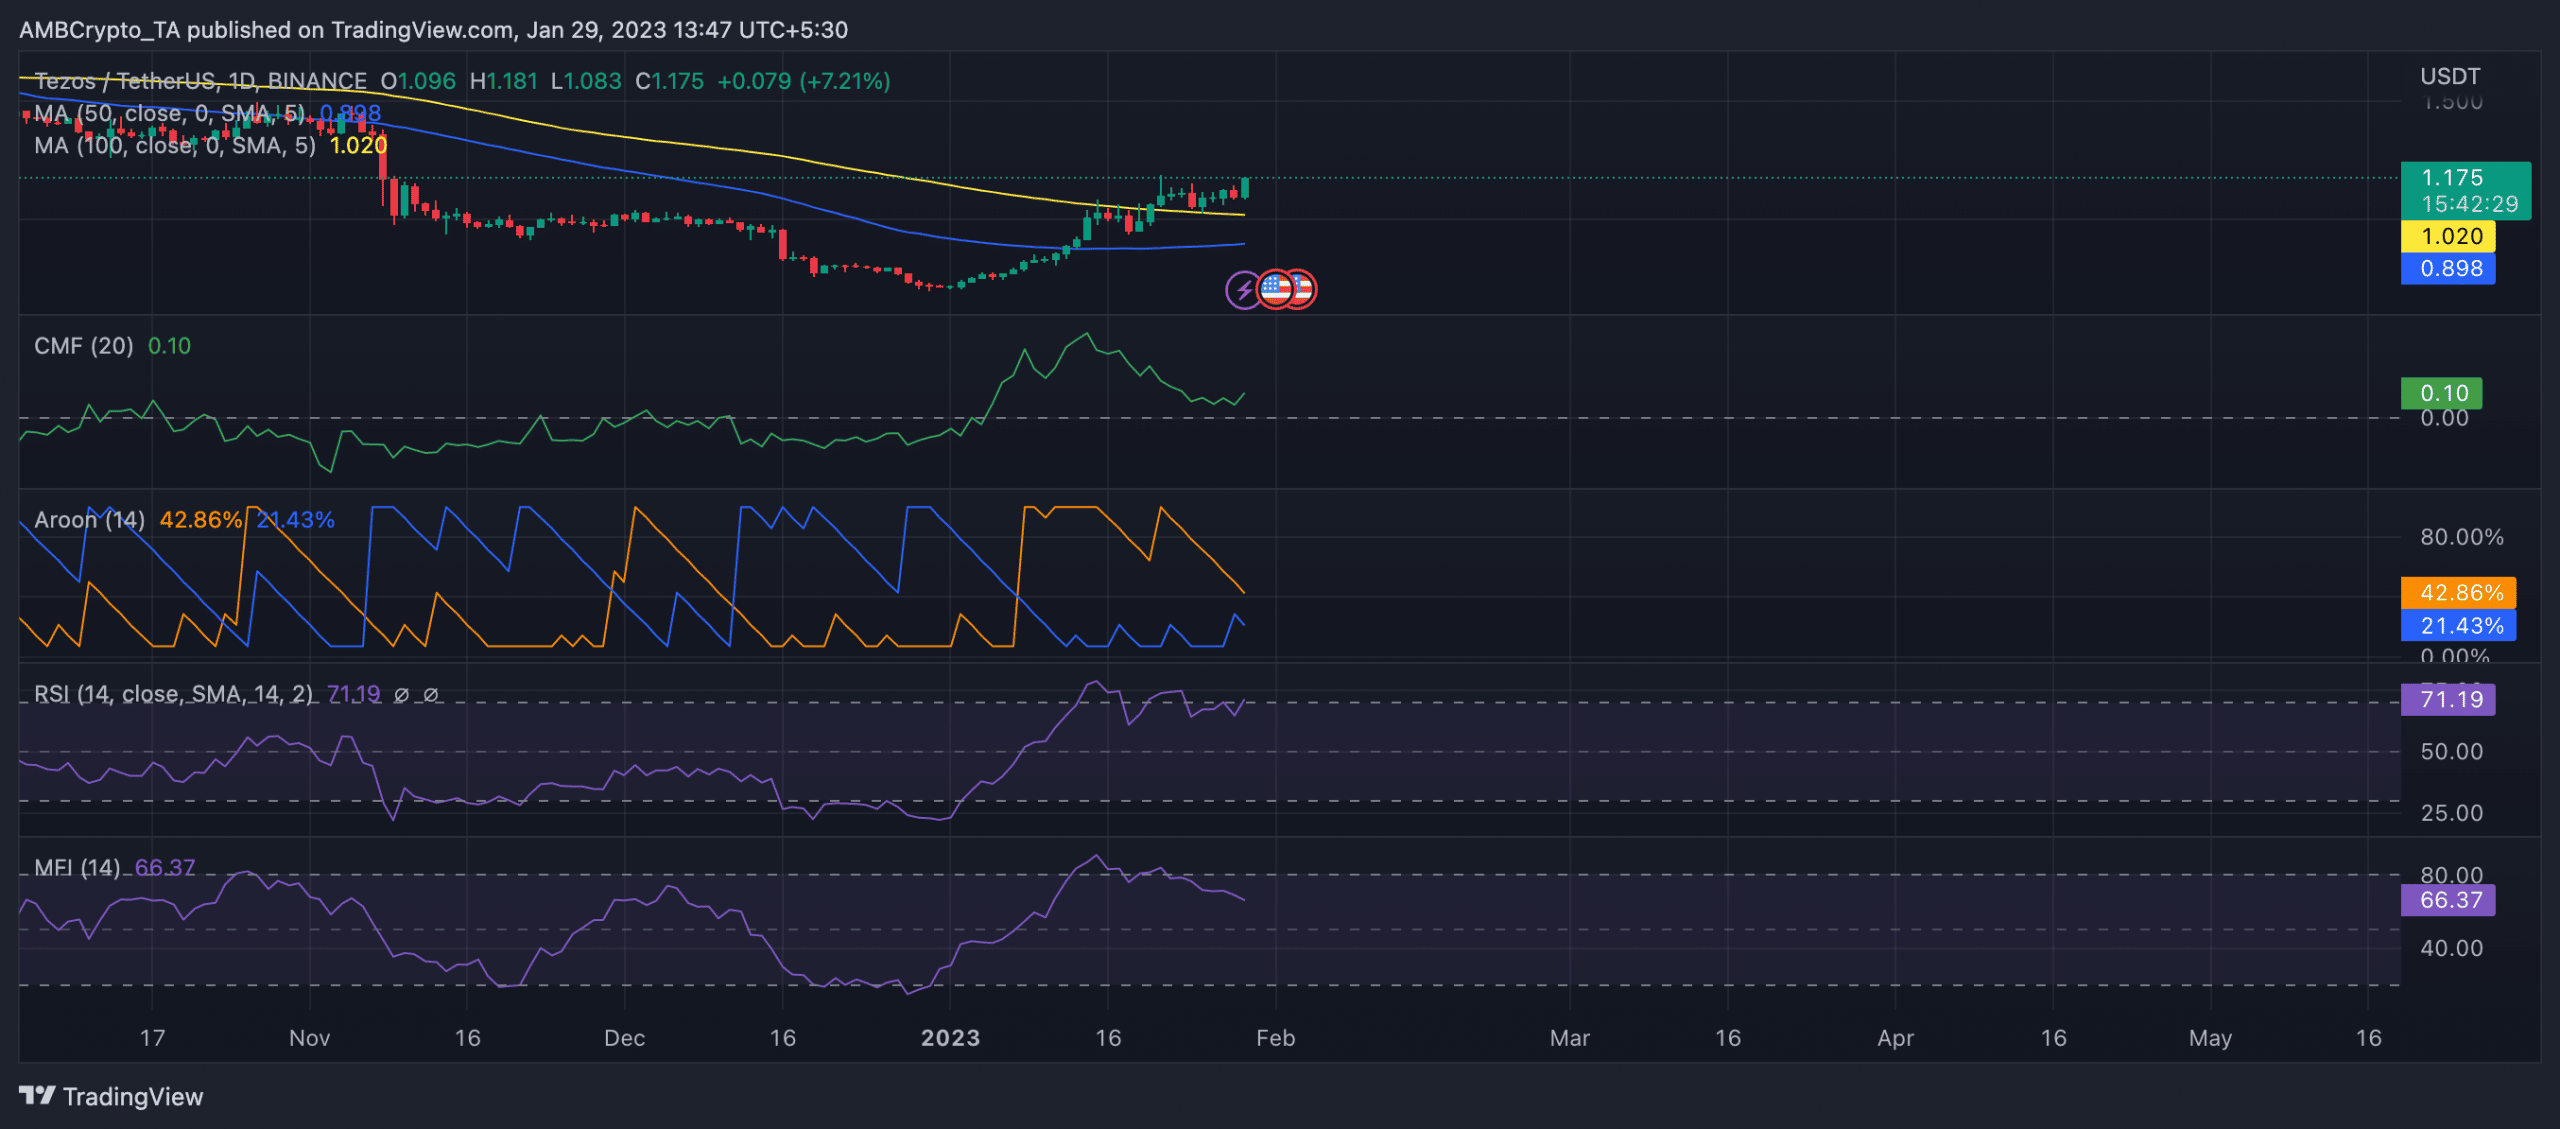
The widespread growth in the general cryptocurrency market caused XTZ’s price to spike by 61% since 1 January. Investors who sought to quickly make profits began acquiring coins, causing key indicators like the Relative Strength Index (RSI) and the Money Flow Index (MFI) to reach overbought highs.
However, XTZ began to see a drop in bullish conviction on 14 January when its Chaikin Money Flow (CMF) embarked on a downtrend while its price rallied. This created a bearish divergence that often suggests an imminent price correction.
A rallying price coupled with a declining CMF means that the concerned asset’s buying pressure is not as strong as the price increase would suggest.
This divergence could be a sign that the rally is not sustainable and that the price may be due for a correction. Still in a downtrend, XTZ’s CMF was 0.10 at press time.
Read Tezos’ [XTZ] Price Prediction 2023-24
Additionally, an examination of the Aroon indicator for XTZ showed that although the price of the altcoin may be rising, the bullish momentum has weakened. At press time, the Aroon Up line (orange) was pegged at 42.86%.
The Aroon Up line is an indicator that measures the strength and recentness of an asset’s uptrend. A value close to 100 indicates a strong uptrend and a recent high, while a value close to zero indicates a weak uptrend and a high that was reached a long time ago. This is a sign of a potential reversal in the trend.
Lastly, a death cross was spotted with the 50-day moving average (blue) lying below the 200-day moving average (yellow). This crossover is considered a bearish signal and is often taken as an indication that a downtrend is about to begin or that the current uptrend is losing strength.